. 2025 Oct;12(39):e02707.
doi: 10.1002/advs.202502707. Epub 2025 Jul 28.

Capsaicin Alleviates Autophagy-Lysosomal Dysfunction via PPARA-Mediated V-ATPase Subunit ATP6V0E1 Signaling in 3xTg-AD Mice

Affiliations

Capsaicin Alleviates Autophagy-Lysosomal Dysfunction via PPARA-Mediated V-ATPase Subunit ATP6V0E1 Signaling in 3xTg-AD Mice

Haitao Yu et al. Adv Sci (Weinh). 2025 Oct.

Abstract

Autophagy-lysosomal pathway deficits contribute to the accumulation of amyloid-β (Aβ), Tau, and lipid droplets in Alzheimer's disease (AD). Capsaicin, a specific agonist of transient receptor potential vanilloid 1 (TRPV1), can improve cognitive function in AD patients, but the detailed mechanism is still unclear. Here, it is revealed that capsaicin ameliorated AD-related pathology by activating peroxisome proliferator-activated receptor alpha (PPARA/PPARα, a key regulator of lipid metabolism) to promote lipid metabolism and reverse autophagy-lysosomal deficits. Molecular mechanism research found that capsaicin significantly activated the PPAR signaling pathway to promote lipid metabolism, with PPARA identified as the key transcription factor. In addition, capsaicin upregulated ATP6V0E1 (V-ATPase V0 complex subunit e1, involved in lysosomal acidification) expression through PPARA, restoring V-ATPase activity. This enhanced lysosomal acidification facilitated lipophagy (autophagic clearance of lipid droplets), while promoting the clearance of Aβ and Tau aggregates via the autophagy-lysosomal pathway. Further, inhibition of ATP6V0E1 and PPARA expression blocked the effect of capsaicin on alleviating AD lipid pathology and cognitive deficits through autophagy-lysosomal flux. Taken together, capsaicin promotes lipid metabolism, reduces lipid deposition, and attenuates AD-related pathologies, while PPARA-ATP6V0E1-V-ATPase signaling mediated autophagy-lysosomal pathway plays a key role in this process.

Keywords: ATP6V0E1; Alzheimer's disease; PPARA; V‐ATPase; autophagy; capsaicin.


Conflict of interest statement

The authors declare no conflict of interest.

Figures

Figure 1
Figure 1
Capsaicin improves spatial memory impairment in 3xTg‐AD mice. A) Experimental workflow of the in vivo study. B–G) The Morris water maze (MWM) was used to detect the effect of capsaicin treatment on the spatial learning and memory of 3xTg‐AD mice fed with 0.01% capsaicin. B,C) Escape latency to the hidden platform in the training phase, and the AUC of escape latency. D) Swimming pathway traveled to locate the platform on day 7. E) The escape latency of day 7. F) The counts of the original position of the platform crossing on day 7. G) The distance traveled on day 7. H–M) The Novel‐object recognition test (NOR) was also used to assess the learning and memory ability of mice treated with 0.01% capsaicin. H) Schematic diagram of the replacement of the old to the new object. I) The change of exploration time of the three groups between object A and object B on sample phase. J) The change of exploration time of the three groups between object B and object C on test phase. K) The change of exploration time of the three groups between object A on the sample phase and object C on test phase. L) The exploration time for novel object between the sample phase and the test phase. M) Discrimination index of the new object. WT, n = 16, 3xTg‐AD, n = 8, 3xTg‐AD + Cap, n = 16. One‐way ANOVA followed by Tukey's post hoc test for (C, E, F, G, and M). Two‐way ANOVA test followed by Bonferroni's post hoc test for B, and I‐L. Data were shown as mean ± SEM. *< 0.05, **< 0.01, ***< 0.001, ****p < 0.0001, ns, not significant.
Figure 2
Figure 2
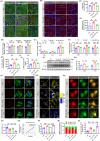
Capsaicin activates PPAR signaling pathway to promote lipid metabolism and reduce lipid droplets aggregation in the hippocampus of 3xTg‐AD mice. A and B) Immunofluorescence staining analysis of BODIPY (lipid droplets fluorescent dye) in the DG, CA1, and CA3 area of hippocampus in 3xTg‐AD mice treated with or without capsaicin and WT mice. A) Representative confocal images of BODIPY+ immunofluorescence labeling. B) Quantification of the number of BODIPY+ in the hippocampus of WT and 3xTg‐AD and 3xTg‐AD + Cap mice. n = 3/group, and 5 visual fields/group were imaged. C,D) Lipidomics results showed that triglyceride (TG) abnormalities, sphingomyelin (SM), and phospholipids (PS, PE, PC) were reduced in AD mice, and treatment with capsaicin ameliorated these phenomena. C) Principal component analysis (PCA) results demonstrated that the lipidomic data of AD mice were highly distinguishable from WT and capsaicin‐administered 3xTg‐AD mice, whereas 3xTg‐AD mice administered capsaicin partially crossed over with WT, suggesting that the lipidomics of AD mice tended to return to normal after capsaicin administration. D) The heatmap of changes in the content of different lipid components in the 3 groups of mice, n =  3/group. E) The heatmap of differentially expressed genes (DEGs, p < 0.05, fold change >1.5) in the hippocampus for 3xTg‐AD + Cap versus 3xTg‐AD mice, n = 3/group. The Z value of gene abundance was plotted in a red‐blue color scale, with red and blue indicating increased and decreased protein expression, respectively. F,G) KEGG enrichment analysis of decreased DEGs F), KEGG enrichment analysis of increased DEGs G). H,I) The heatmap H) and PPI network module I) of DEGs involved in the PPAR signaling pathway. J) The mRNA expression levels of 10 genes across three groups, n = 8/group. K) All DEGs were input into metascape online website (http://metascape.org/). and the transcription factors involved in regulation were predicted in the “Summary of enrichment analysis in TRRUST” module. L,M) The expression of PPARA in the hippocampus of WT mice, 3xTg‐AD mice, and 3xTg‐AD mice fed with capsaicin, n = 4/group. One‐way ANOVA followed by Tukey's post hoc test for (B, J, M). Data were shown as mean ± SEM. *< 0.05, **< 0.01, ***< 0.001, ****p < 0.0001, ns, not significant.
Figure 3
Figure 3
Capsaicin promotes lipid degradation by enhancing the autophagy‐lysosomal pathway. A,B) Characterization of the staining of BODIPY and LAMP1 (lysosome marker) in the hippocampus of 3xTg‐AD mice treated with or without capsaicin and WT mice via immunofluorescence, representative confocal images of BODIPY and LAMP1 immunofluorescence co‐labeling A), quantification of the relative fluorescence density of LAMP1+ in visual field B), quantification of the number of BODIPY+ and LAMP1+ in visual field, n = 3/group, 5 visual fields/group were imaged C). D,E) Immunohistochemical (IHC) analysis was performed to examine the distribution of Plin2 in hippocampal regions across the three experimental groups D), followed by quantitative statistical evaluation, n = 3/group, 5 visual fields/group were imaged E). F–H) Quantitative analysis of triglyceride (TG), n = 6/group F), cholesteryl ester (CE), n = 5/group G), and Free fatty acids (FFA) levels, n = 5/group H) was performed in hippocampal tissues from all three experimental groups. I) The concentration of cathepsin B (CTSB) in mouse hippocampal tissues was quantified by ELISA kit, n = 5/group. J,K) The protein expression levels of CTSB and CTSD were analyzed by Western blot J), followed by quantification, n = 4/group K). L) LysoTracker Red and BODIPY immunofluorescence were used to evaluate the lysosomal function and lipid droplets degradation. M,N) LysoSensor Yellow/Blue DND‐160 was used to distinguish acidic lysosomes (yellow puncta) from alkalinized lysosomes (blue puncta) in live cells M), followed by quantification, n = 10/group N). O,P) Lysosomal PH was calibrated using a standard curve generated with LysoSensor Yellow/Blue, n = 5/group O), and lysosomal PH of four groups, n = 4/group P). Q–S) The mCherry‐GFP‐LC3B plasmid and treated with Aβ1‐42, capsaicin and chloroquine (CQ), and the levels of autophagic flow were evaluated by quantifying GFP and mCherry fluorescence dots, representative confocal images of GFP and mCherry immunofluorescence co‐labeling Q), quantification of percentage of fluorescent dots/cell R), quantification of number of yellow LC3B puncta/cell, n = 10/group S). One‐way ANOVA followed by Tukey's post hoc test for (B, C, E, F, G, H, I, K, N, P, R, and S). Data were shown as mean ± SEM. *< 0.05, **< 0.01, ***< 0.001, ****p < 0.0001, ns, not significant.
Figure 4
Figure 4
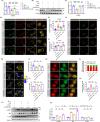
Capsaicin increases ATP6V0E1‐associated lysosomal function in 3xTg‐AD mice. A) Volcano plots of 3xTg‐AD + Cap versus 3xTg‐AD mice for lysosome‐related genes: the x‐axis represents the ratio in 3xTg‐AD + Cap versus 3xTg‐AD groups, and the y‐axis is the ‐log10‐transformed p‐value. The red color represented increased expression, and the blue color represented reduced expression. n = 3/group. B) Profile plot of mRNA expression of lysosome‐related genes, the dotted line connects the average abundance of the protein in the different animal groups, n = 3/group. C) The mRNA levels of lysosome‐related genes in the volcano plot were verified by qRT‐PCR analysis, n = 4/group. D–F) Relative mRNA expression levels of Atp6v0e1 in peripheral blood of GSE63060, Ctrl n = 104, MCI n = 80, AD n = 145 D), peripheral blood of GSE63061, Ctrl n = 134, MCI n = 109, AD n = 139 E), and in brain of GSE5281, Ctrl n = 13, AD n = 10 F). G) The vacuolar ATPase (V‐ATPase) Elisa kit showed that V‐ATPase was decreased in the hippocampus of 3xTg‐AD mice, but reversed by capsaicin administration, n = 5/group. H) PPARA was predicted to have five sites of those were predicted with a relative profile score threshold 85% in the promoter region of ATP6V0E1 by JASPAR software. I,J) Chromatin immunoprecipitation (ChIP)‐qPCR showed that capsaicin promoted ATP6V0E1 transcription through PPARA, the image of agarose gel electrophoresis experiment of ChIP products I), the result of qPCR of the highest scoring prediction binding sequence, n = 6/group J). K,L) Dual‐luciferase reporter assay revealed that PPARA has at least one binding site to promote the transcription of ATP6V0E1, and capsaicin also promoted ATP6V0E1 transcription by activating PPARA‐ATP6V0E1 binding site, the pattern diagram of dual‐luciferase reporter experiment K), the ratio of relative light units of the two fluorescence intensities, n = 5/group L). M–P) Overexpression or knockdown of PPARA to further analyze the changes of ATP6V0E1 in protein level, when PPARA was overexpressed, the protein level of ATP6V0E1 was increased, n = 4/group M–N), while PPARA was knocked down, the protein level of ATP6V0E1 was decreased, n = 4/group O,P). (Q) Diagram of the amelioration of capsaicin‐mediated PPARA‐ATP6V0E1‐V‐ATPase pathway activation on lysosome function and lipid accumulations, and was created using BioRender (https://www.biorender.com/). Unpaired t‐test for (F, N, and P). One‐way ANOVA followed by Tukey's post hoc test for (C, D, E, G, J, and L). Data were shown as mean ± SEM. *< 0.05, **< 0.01, ***< 0.001, ****p < 0.0001, ns, not significant.
Figure 5
Figure 5
Inhibition of ATP6V0E1 expression blocked the effect of capsaicin on reducing lipid deposition through autophagy‐lysosomal flux. A) The mRNA levels of ATP6V0E1 in the four groups of cells were detected after finishing Vector or siATP6V0E1 transfection for 48 h, n = 8/group.  B,C) The protein level of PPARA after the transfection for 48 h, n = 3/group. D–F) Double immunofluorescence staining of LAMP1 and BODIPY confirmed that capsaicin improved autophagy and promoted lipid droplets degradation through ATP6V0E1 D), number of BODIPY+ particle per cell, n = 20/group E), relative fluorescence density/cell, n = 10/group F). G) LysoTracker Red and BODIPY immunofluorescence were used to evaluate the lysosomal function and lipid droplets degradation. H,I) LysoSensor Yellow/Blue DND‐160 was used to distinguish acidic lysosomes (yellow puncta) from alkalinized lysosomes (blue puncta) in live cells H), followed by quantification, n = 10/group I). J) Lysosomal PH of four groups, n = 4/group. K–M) The mCherry‐GFP‐LC3B plasmid and Vector or siATP6V0E1 RNA were transfected and subsequently treated with Aβ1‐42 and capsaicin, and the level of autophagic flow was evaluated by quantifying GFP and mCherry fluorescence signals, representative confocal images of GFP and mCherry immunofluorescence co‐labeling K), quantification of percentage of fluorescent dots/cell L), quantification of number of yellow LC3B dots/cell, n = 10/group M). N,O) The protein expression of autophagy‐lysosomal markers LAMP1, p62, LC3B, n = 3/group. One‐way ANOVA followed by Tukey's post hoc test for (A, C, E, F, I, J, L, M, and O). Data were shown as mean ± SEM. *< 0.05, **< 0.01, ***< 0.001, ****p < 0.0001, ns, not significant.
Figure 6
Figure 6
Inhibition of PPARA expression blocked the effect of capsaicin on reducing lipid deposition through autophagy‐lysosomal flux. A,B) The protein level of PPARA in the four groups after finishing the Vector or shPPARA transfection for 48 h, n = 3/group. C) The mRNA level of ATP6V0E1 after finishing the transfection for 48 h, n = 6/group. D) Immunofluorescence double labeling of LysoTracker Red and BODIPY. E,F) LysoSensor Yellow/Blue DND‐160 was used to distinguish acidic lysosomes (yellow puncta) from alkalinized lysosomes (blue puncta) in live cells (E), followed by quantification, n = 10/group F). G) Lysosomal PH of four groups, n = 4/group. H–J) The immunofluorescence of mCherry‐GFP‐LC3B plasimd among the four groups, representative confocal images of GFP and mCherry immunofluorescence co‐labeling H), quantification of percentage of fluorescent dots/cell I), quantification of number of yellow LC3B dots/cell, n = 10/group J). K) The relative mRNA levels of genes correlated with the PPAR pathway, n = 6/group. L,M) The protein expression of autophagy‐lysosomal markers LAMP1, p62, LC3B, n = 3/group. One‐way ANOVA followed by Tukey's post hoc test for (B, C, F, G, I, J, K, and M). Data were shown as mean ± SEM. *< 0.05, **< 0.01, ***< 0.001, ****p < 0.0001, ns, not significant.

References

    1. Collaborators G. B. D. N., Lancet Neurol. 2019, 18, 459.
    1. Scheltens P., De Strooper B., Kivipelto M., Holstege H., Chételat G., Teunissen C. E., Cummings J., van der Flier W. M., Lancet 2021, 397, 1577. - PMC - PubMed
    1. Hodson R., Nature 2018, 559, S1. - PubMed
    1. Hamilton L. K., Dufresne M., Joppe S. E., Petryszyn S., Aumont A., Calon F., Barnabe‐Heider F., Furtos A., Parent M., Chaurand P., Fernandes K. J., Cell Stem Cell 2015, 17, 397. - PubMed
    1. Huynh K., Lim W. L. F., Giles C., Jayawardana K. S., Salim A., Mellett N. A., Smith A. A. T., Olshansky G., Drew B. G., Chatterjee P., Martins I., Laws S. M., Bush A. I., Rowe C. C., Villemagne V. L., Ames D., Masters C. L., Arnold M., Nho K., Saykin A. J., Baillie R., Han X., Kaddurah‐Daouk R., Martins R. N., Meikle P. J., Nat. Commun. 2020, 11, 5698. - PMC - PubMed

LinkOut - more resources