. 2025 Dec;16(1):2486816.
doi: 10.1080/19491034.2025.2486816. Epub 2025 Apr 9.

Constitutive heterochromatin controls nuclear mechanics, morphology, and integrity through H3K9me3 mediated chromocenter compaction

Affiliations

Constitutive heterochromatin controls nuclear mechanics, morphology, and integrity through H3K9me3 mediated chromocenter compaction

Gianna Manning et al. Nucleus. 2025 Dec.

Abstract

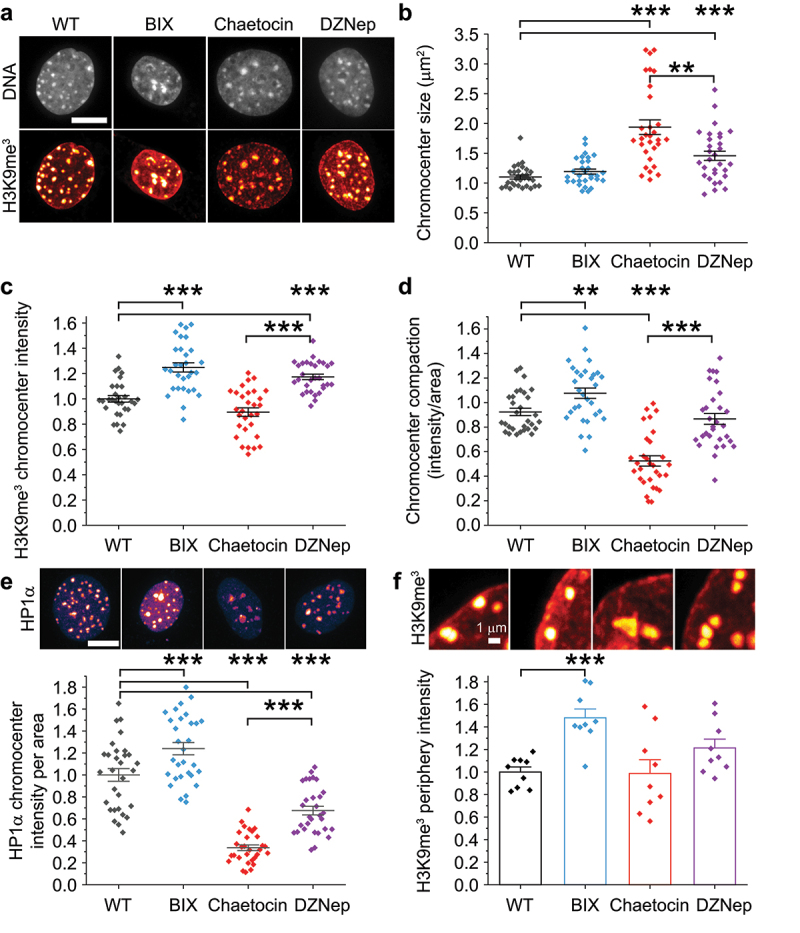
Aberrant nuclear morphology is a hallmark of human disease and causes nuclear dysfunction. Perturbed nuclear mechanics via reduced heterochromatin weakens the nucleus resulting in nuclear blebbing and rupture. While the role of heterochromatin is known, the separate roles of constitutive heterochromatin methylation states remains elusive. Using MEF and HT1080 cells, we isolated the individual contribution of constitutive heterochromatin H3K9 methylation states through histone methyltransferase inhibitors. Inhibition of SUV39H1 via Chaetocin downregulates H3K9 trimethylation (me3), while inhibition of G9a via BIX01294 downregulates H3K9 dimethylation (me2). Overall, the loss of H3K9me3 increased nuclear blebbing and rupture in interphase nuclei due to decreased nuclear rigidity from decompaction of chromocenters. Oppositely, loss of H3K9me2 decreased nuclear blebbing and rupture with increased nuclear rigidity and more compact chromocenters. We show that facultative heterochromatin and HP1α are non-essential for chromocenter compaction. Constitutive heterochromatin provides essential nuclear mechanical support to maintain nuclear shape and integrity through chromocenter compaction.

Keywords: Chromocenter; heterochromatin; nuclear blebbing; nuclear mechanics; nuclear structure.


Conflict of interest statement

No potential conflict of interest was reported by the author(s).

Figures

Images of nuclear immunofluorescence examples for H3K9me2, H3K9me3, and H3K27me3. Scatter graph SuperPolts of each immunofluorescence intensity relative to wild type. The inhibitor BIX01294 decreases H3K9me2, while inhibitor Chaetocin decreases H3K9me3. DZNep decreases H3K27me3 but also decreases H3K9me2 and increases H3K9me3.
Figure 1.
Heterochromatin histone modification states can be modulated distinctly. (a-c) Example images of MEF nuclei DNA stained by Hoechst (gray) and immunofluorescence for (a) H3K9me2 (blue), (b) H3K9me3 (red), and (c) H3K27me3 (purple). For each immunofluorescence marker there is an example image of wild type (WT) and inhibitor including BIX01294, Chaetocin (CHT), or DZNep treatment for 16 h. (d) Graphs of immunofluorescence relative to wild type for all inhibitors for H3K9me2, H3K9me3, and H3K27me3. Each condition consists of six replicates n averages > 20 nuclei each. One-way ANOVA multiple comparison between wild type and each treatment with p values reported as *< 0.05, **< 0.01, ***< 0.001, or ns denotes no significance, p > 0.05. Error bars represent standard error. Scale bar = 10 µm.
Images of nuclear shape where normal is ellipse and blebbed has a deformation. NLS-GFP images show dynamic nuclear blebbing and rupture where the NLS-GFP spills out of the nucleus. Bar graphs of averages for static blebbing and dynamic blebbing and rupture percentages show decrease for BIX and increase for Chaetocin and DZNep.
Figure 2.
Nuclear blebbing and rupture increase upon loss of H3K9me3 while loss of H3K9me2 decreases this effect. (a) Example images of a normal shaped and blebbed MEF nucleus DNA stained by Hoechst. Graph of percentage of blebbed nuclei from population imaging after 16 h of treatment. Each condition consists of three biological replicates n > 60 nuclei each. (b) Example images of a normal shaped and blebbed HT1080 nucleus via H2B-mcherry. Graph of percentage of blebbed nuclei from live cell imaging after 16 h of treatment. Each condition consists of three technical replicates n > 40 nuclei each. (c) Example images of nuclear bleb formation and rupture upon timelapse imaging of MEF NLS-GFP cells over 3 h. Time between images indicated by time stamp hour:minute. Graphs of 3 h timelapse imaging (d) percent nuclear blebbing, (e) percent nuclear rupture, (f) percent bleb-based nuclear rupture, and (g) nuclear rupture frequency for conditions wild type (WT), BIX01294 (BIX), Chaetocin, and DZNep treatment over 16 h. Each condition consists of three biological replicates n > 180 nuclei each replicate and > 600 nuclei total for nuclear blebbing and rupture. Two-tailed unpaired Student’s t-test between wild type and each treatment with p values reported as *< 0.05, **< 0.01, ***< 0.001, or ns denotes no significance, p > 0.05. Two-tailed unpaired Student’s t-test between Chaetocin and DZNep were all p > 0.05. Error bars represent standard error. Scale bar = 10 µm.
NLS-GFP images show dynamic behavior throughout interphase and mitosis. Example images show nuclear blebbing and rupture in interphase where the NLS-GFP spills out of the nucleus. Bar graphs of bulk percentages and averages for dynamic blebbing and rupture show all conditions rupture primarily in interphase and the increase in nuclear blebbing occurs in interphase for Chaetocin and DZNep. Chaetocin also shows increased abnormal mitosis and decreased post-mitosis nuclear circularity.
Figure 3.
Nuclear blebbing and rupture upon loss of H3K9me3 is due to interphase-based behaviors and not dependent on mitotic failures. (a) Example images of MEF NLS-GFP cells treated with Chaetocin and imaged for 16 h. Pre-mitosis the normal shaped nucleus forms nuclear blebs and ruptures before going through an abnormal mitosis resulting in abnormally shaped daughter nuclei post-mitosis which can be measured by decreased circularity. Time between images indicated by time stamp hour:minute. (b) Nuclear rupture distribution categorized for occurring pre-mitosis, post normal mitosis, post abnormal mitosis. Nuclear ruptures of three technical replicates WT (n = 13, 6, 8) BIX01294 (n = 1, 1, 0) Chaetocin (n = 10, 4, 11), DZNep (n = 16, 18, 27). (c) Graph of the percentage of abnormal mitosis for wild type (WT), BIX01294 (BIX), Chaetocin, and DZNep treatment over the later 16 h of a 24-h treatment. Each condition consists of three biological replicates n averages > 30 mitotic events. (d) Graph of the percentage of interphase-based nuclear blebbing for (WT), BIX01294 (BIX), Chaetocin, and DZNep treatment over 16 h. Each condition consists of three biological replicates with n > 50 nuclei each. (e) Post-mitosis nuclear circularity measured 15 min after NLS-GFP nucleus accumulation. Each condition consists of three technical replicates n > 25 nuclei total. Two-tailed unpaired Student’s t-test between all conditions with p values reported as *< 0.05, **< 0.01, ***< 0.001, or ns denotes no significance, p > 0.05. For panels C and E Chaetocin is statistically significantly different from all other conditions. Error bars represent standard error. Scale bar = 10 µm.
Images of isolated nucleus pulled by micropipettes to measure force response. Force vs. extension traces examples and scatter plots of nuclear spring constant show, relative to wild type, BIX increased short extension mechanics, DZNep decreases short extension and long extension mechanics and Chaetocin decreases short, long, and long minus short mechanics.
Figure 4.
Nuclear stiffness increases upon loss of H3K9me2 and decreases upon loss of H3K9me3. (a) Example images of a single isolated nucleus dual micropipette micromanipulation force-extension measurement experiment. These nuclei are isolated from MEF vimentin null nuclei to aid clean isolation from live cells. The pull pipette (pp) extends the nucleus as the force pipette’s (fp) deflection multiplied by its premeasured bending constant measures force. (b, c) Example nucleus force–extension curves for (b) BIX01294 (blue, decreased H3K9me2) and (c) Chaetocin (red, decreased H3K9me3) relative to an example wild type (WT, black). Dotted line at 3 µm denotes separation of short and long extension regimes, previously shown to reflect respectively the chromatin and chromatin + lamin mechanical contributions [29,55]. Inset shows the relative slopes with provide the nuclear spring constant, k = f/δl. (d-f) Average nuclear spring constants for (d) short extension <3 µm, (e) long extension >3 µm, and (f) strain stiffening via long minus short extension regimes for wild type (WT, gray, n = 18 short and 13 long), BIX01294 (BIX, blue, n = 10), Chaetocin (red, n = 10), and DZNep (purple, n = 13 short and 12 long). (g) Graph of the ratio of the long extension and short extension nuclear spring constant for wild type (WT), BIX01294 (BIX), Chaetocin, and DZNep. Mann-Whitney U test between wild type and each treatment were run for panels d-f and a one-way ANOVA multiple comparison was run for panel G with p values reported as *< 0.05, **< 0.01, ***< 0.001, or ns denotes no significance, p > 0.05. Chaetocin and DZNep were statistically similar for all graphs d-g, p > 0.05. Error bars represent standard error. Scale bar = 10 µm.
Confocal nucleus images H3K9me3 and HP1α chromatin immunofluorescence show internal dense globular chromocenters and peripheral enrichment. Scatter plot graphs of average and individual chromocenter size, H3K9me3 intensity, and intensity/size. Relative to wild type for intensity/area BIX increased, Chaetocin decreased, and DZNep remained the same. Scatter plot graph of average and individual chromocenter HP1α intensity/size show increase in BIX, decrease in DZNep, and even more drastic decrease in Chaetocin. Scatter plot graph of average and replicate averages of H3K9me3 peripheral intensity increases in BIX.
Figure 5.
Chromocenter compaction increases upon loss of H3K9me2, decreases upon loss of H3K9me3, and is unchanged by loss of H3K27me3. (a) Example images of MEF nuclei DNA stained by Hoechst (gray) and immunofluorescence for H3K9me3 (red) for wild type (WT, gray), BIX01294 (BIX, blue), Chaetocin (red), and DZNep (purple). Scale bar = 10 µm. (b, c, d) Graphs of (b) chromocenter size and (c) chromocenter average H3K9me3 intensity used to calculate (d) chromocenter compaction for wild type (WT), BIX01294 (BIX), Chaetocin, and DZNep. The raw data for each chromocenter measured is graphed as a heatmap in Supplemental Figure S2. (e) Example images and graph of relative HP1α chromocenter intensity per area and (f relative H3K9me3 peripheral intensity for wild type (WT), BIX01294 (BIX), Chaetocin, and DZNep. Scale bar = 10 µm for panel E images and 1 µm for panel F images. Each condition consists of 30 nuclei each measuring n > 10 chromocenters. Mann-Whitney U test for panels B-D and one-way ANOVA multiple comparison for panels e-f between wild type and each treatment and Chaetocin compared to DZNep with p values reported as * < 0.05, ** < 0.01, *** < 0.001, or no asterisk denotes no significance, p > 0.05. Error bars represent standard error.

Similar articles

Cited by

References

    1. Khatau SB, Hale CM, Stewart-Hutchinson PJ, et al. A perinuclear actin cap regulates nuclear shape. Proc Natl Acad Sci USA. 2009;106:19017–18. - PMC - PubMed
    1. Hatch EM, Hetzer MW.. Nuclear envelope rupture is induced by actin-based nucleus confinement. J Cell Biol. 2016;215(1):27–36. doi: 10.1083/jcb.201603053 - DOI - PMC - PubMed
    1. Jung-Garcia Y, Maiques O, Monger J, et al. LAP1 supports nuclear adaptability during constrained melanoma cell migration and invasion. Nat Cell Biol. 2023;25:108–119. - PMC - PubMed
    1. Le Berre M, Aubertin J, Piel M. Fine control of nuclear confinement identifies a threshold deformation leading to lamina rupture and induction of specific genes. Integr Biol (Camb). 2012;4(11):1406–1414. doi: 10.1039/c2ib20056b - DOI - PubMed
    1. Mistriotis P, Wisniewski EO, Bera K, et al. Confinement hinders motility by inducing RhoA-mediated nuclear influx, volume expansion, and blebbing. J Cell Biol. 2019;218:4093–4111. - PMC - PubMed

MeSH terms

LinkOut - more resources