. 2025 Jul 28:271678X251361247.
doi: 10.1177/0271678X251361247. Online ahead of print.

Circulating extracellular vesicles in facilitated stroke recovery via MiR-451-5p/MIF and MiR-451-5p/CCND1 axes

Affiliations

Circulating extracellular vesicles in facilitated stroke recovery via MiR-451-5p/MIF and MiR-451-5p/CCND1 axes

Kenichiro Hira et al. J Cereb Blood Flow Metab. .

Abstract

Extracellular vesicles (EVs) derived from cells such as mesenchymal stem cells exert neurorestorative effects; however, the efficacy of circulating EVs for repairing injured brains and functional recovery after stroke remains unknown. This study shows that miR-451-5p in circulating EVs is crucial for stroke recovery, with its first therapeutic application in middle cerebral artery occlusion (MCAO) rats. Circulating EVs derived from MCAO rats in the chronic recovery phase were enriched in miR-451-5p, especially in CD9+ EVs., increased S100A10+ astrocytes and decreased C3d+ astrocytes in the peri-infarct area (PIA). They also increased axonemal phosphorylated high-molecular-weight neurofilaments and dendritic non-phosphorylated high-molecular-weight neurofilaments, reduced the infarct size, and enhanced functional recovery. EVs with miR-451-5p overexpression suppressed macrophage migration inhibitory factor in cultured neurons and cyclin D1 in cultured astrocytes after stroke. These findings indicate that miR-451-5p-enriched CD9+ circulating EVs restored ischemic brain tissues, making them potential therapeutic targets for stroke.

Keywords: Circulating EVs; cyclin D1; ischemic stroke; macrophage migration inhibitory factor; miR-451-5p.


Conflict of interest statement

The author(s) declared no potential conflicts of interest with respect to the research, authorship, and/or publication of this article.

Figures
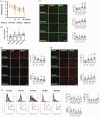
Figure 1.
Figure 1.
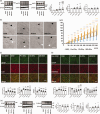
Effect of circulating EV treatment on functional recovery, neuronal regeneration, and profile change of reactive astrocytes in the PIA after middle cerebral artery occlusion (MCAO). (a,b) Modified neurological severity score (mNSS) (a) and Rotarod test (b) after MCAO in vehicle-treated rats. EVs extracted from pre-operated rats (Pre-EVs), EVs extracted from 3 days after MCAO rats (3D-EVs), and EVs extracted from 28 days after MCAO rats (28D-EVs) treated rats. n = 9/group. Values are the mean ± SD. *P < 0.05, **P < 0.01, ***P < 0.001 vs. Vehicle; #P < 0.05, ##P < 0.01 vs. Pre-EVs. (c) Representative confocal images of phosphorylated high-molecular-weight neurofilament (pNFH)+, non-phosphorylated high-molecular-weight neurofilament (npNFH)+, and microtubule-associated protein 2 (MAP2)+ cells in the peri-infarct area (PIA) of vehicle-, Pre-EV-, 3D-EV-, and 28D-EV-treated rats. n = 5/group. Values are the mean ± SD. **P < 0.01, ***P < 0.001 vs. Vehicle; #P < 0.05, ##P < 0.01, ###P < 0.001 vs. Pre-EVs. Scale bars = 50 μm. (d,e) Representative confocal images of glial fibrillary acidic protein (GFAP)+, complement 3d (C3d)+, and GFAP+/C3d+ in the PIA of vehicle-, Pre-EV-, 3D-EV-, and 28D-EV-treated rats (D). Representative confocal images of GFAP+, S100 calcium-binding protein A10 Continued.(S100A10)+, and GFAP+/S100A10+ of the PIA in vehicle-, Pre-EV-, 3D-EV-, and 28D-EV-treated rats (E). n = 5/group. Values are the mean ± SD. *P < 0.05, ***P < 0.001 vs. Vehicle; #P < 0.05, ##P < 0.01 vs. Pre-EVs. Scale bars = 50 μm. (f) Fluorescence-activated cell sorter (FACS) of GFAP+ cells in the PIA at 28 days after MCAO in Pre-operated rats and vehicle-, Pre-EV-, 3D-EV-, and 28D-EV-treated rats. The upper row shows the median C3d+/S100A10+ ratio. The lower row shows that the X-axis measures fluorescence in the FITC channel (marking S100A10+ cells), and the Y-axis measures fluorescence in the Cy5 channel (marking C3d+ cells). Quantitative data of the density of C3d+, S100A10+, and C3d+-S100A10+ cells in the PIA. n = 7/group. Values are the mean ± SD. #P < 0.05 vs. Vehicle.
Figure 2.
Figure 2.
Characteristics of circulating EVs and their distribution in the brain after MCAO. (a,b) Total number (a) and protein (b) of EVs in the whole blood. n = 30/group. Values are the mean ± SD. ***P < 0.001 vs. Pre-EVs; ###P < 0.001 vs. 3D-EVs. (c) Radiant efficiency indicates the accumulation of ExoGlow dye-labeled EVs in the brain. (d,e) Average radiant efficiency of the whole brain (e) and sliced brain (f) in Sham-operated rats and Pre-EV-, 3D-EV-, and 28D-EV-treated rats. n = 7–9/group. Values are the mean ± SD. *P < 0.05, **P < 0.01, ***P < 0.001 vs. Sham-operated rats. (f) Double immunostaining of PIA in frozen brain sections. EVs were labeled with ExoSparkler Exosome Membrane Labeling Kit-Red. Scale bars = 10 μm.
Figure 3.
Figure 3.
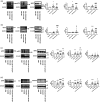
Changes in neuron-associated proteins, effects on axon elongation during EV treatment in OGD neurons, and changes in the profile of OGD astrocytes treated with circulating EVs. (a) Western blots showing protein levels of pNFH, npNFH, and MAP2 in OGD neurons and OGD neurons treated with Pre-EVs, 3D-EVs, and 28D-EVs. n = 5/group. Values are the mean ± SD. *P < 0.05, **P < 0.01 vs. OGD; #P < 0.05, ##P < 0.01 vs. Pre-EVs. (b) Axonal elongation of OGD neurons treated with each EV. n = 5/group. Values are the mean ± SD. *P < 0.05, **P < 0.01, ***P < 0.001 vs. OGD. Scale bars = 50 μm. (c,d) Representative confocal images of GFAP+ - C3d+ cells (c) and GFAP+ - S100A10+ cells (d) in non-OGD-, OGD, Pre-EV-treated, 3D-EV-treated, and 28D-EV-treated OGD astrocytes. n = 5/group. Values are the mean ± SD. **P < 0.01, ***P < 0.001 vs. Non-OGD; #P < 0.05, ##P < 0.01, ###P < 0.001 vs. OGD; †P < 0.05, ††P < 0.01, †††P < 0.001 vs. Pre-EVs. (e) Western blots showing GFAP, C3d, and S100A10 protein levels in OGD astrocytes, OGD astrocytes treated with Pre-EVs, 3D-EVs and 28D-EVs. n = 5/group. Values are the mean ± SD. **P < 0.01, ***P < 0.001 vs. OGD; ##P < 0.01 vs. Pre-EVs.
Figure 4.
Figure 4.
MiR-451-5p contained in 28 D-EVs, its origin, and distribution of surface tetraspanins of circulating EVs. (a,b) Heatmap representation of significantly changed microRNAs and volcano plot. (c) MiR-451-5p measured by qRT-PCR. n = 5/group. Values are the mean ± SD. ***P < 0.001 vs. Pre-EVs. (d) Diseases and functions results associated with miR-451-5p in QIAGEN Ingenuity Pathway Analysis (IPA) core analysis. Red bars represent bone marrow-related diseases. (e) Comparison by EV type based on CD9, CD63, and CD81 captured by antibody spots against MIgG, CD63, CD81, and CD9 on microarrays. n = 5/group. Values are the mean ± SD. *P < 0.05, **P < 0.01, ***P < 0.001 vs. Pre-EVs; #P < 0.05, ###P < 0.001 vs. 3D-EVs and (f) comparison of miR-451-5p in CD9+28D-EVs and CD928D-EVs by qRT-PCR. Values are the mean ± SD. *P < 0.05 vs. CD928D-EVs.
Figure 5.
Figure 5.
Transition of proteins in neurons and astrocytes by miR-451-5p treatment. (a,b) Representative western blots showing protein levels of pNFH, npNFH, and MAP2 in neurons (A) and protein levels of GFAP, C3d, and S100A10 in astrocytes (B) treated with 28D-EVs, 28D-mimic-EVs, and 28D-inhibitor-EVs after OGD. n = 5/group. Values are the mean ± SD. *P < 0.05, **P < 0.01, ***P < 0.001 vs. 28D-EVs; #P < 0.05, ##P < 0.01, ###P < 0.001 vs. 28D-mimic-EVs and (c,d) representative western blots showing protein levels of pNFH, npNFH, and MAP2 in neurons (C), and protein levels of GFAP, C3d, and S100A10 in astrocytes (D) treated with 28D-EVs, 293T-EVs, and miR-451-rich-293T-EVs after OGD, respectively. n = 5/group. Values are the mean ± SD. *P < 0.05, **P < 0.01, ***P < 0.001 vs. OGD; #P < 0.05, ###P < 0.001 vs. 28D-EVs; †P < 0.05, ††P < 0.01 vs. 293T-EVs.
Figure 6.
Figure 6.
Transition of miR-451-5p-related decreased proteins and effect of miR-451-5p on improving functional recovery after MCAO and pathological changes in the PIA. (a,b) Network analysis of proteins affected by miR-451-5p in cultured neurons (a) and astrocytes (b). (c) Representative western blots showing MIF, BCL2, and CCND1 protein levels in OGD neurons and astrocytes treated with 293T-EVs and miR-451-rich-293T-EVs. n = 5/group. Values are the mean ± SD. **P < 0.01 vs. 293T-EVs.Continued.(d) Representative western blots showing MIF, BCL2, and CCND1 protein levels in OGD neurons and astrocytes treated with Pre-EVs and 28D-EVs. n = 5/group. Values are the mean ± SD. *P < 0.05, **P < 0.01 vs. Pre-EVs. e,g, Representative confocal images of MIF+, MAP2+, and MIF+/MAP2+ in the PIA of 293T-EV-, miR-451-rich-293T-EV-, Pre-EV-, and 28D-EV-treated rats. n = 5/group. Values are the mean ± SD. ***P < 0.001 vs. 293T-EVs or Pre-EVs. Scale bars = 50 μm. f,h, Representative confocal images of CCND1+, GFAP+, and CCND1+/GFAP+ in the PIA of 293T-EV-, miR-451-rich-293T-EV-, Pre-EV-, and 28D-EV-treated rats. n = 5/group. Values are the mean ± SD. ***P < 0.001 vs. 293T-EVs or Pre-EVs. Scale bars = 50 μm. i,j, Modified NSS (e) and Rotarod test (f) in 293T-EVs and miR-451-rich-293T-EVs-treated MCAO rats. n = 9/group. Values are the mean ± SD. *P < 0.05 vs. 293T-EVs treated rats.

References

    1. GBD. Stroke collaborators. Global, regional, and national burden of stroke and its risk factors, 1990–2019: a systematic analysis for the global burden of disease study 2019. Lancet Neurol 2021 2019; 20: 795–820. - PMC - PubMed
    1. Ueno Y, Chopp M, Zhang L, et al. Axonal outgrowth and dendritic plasticity in the cortical peri-infarct area after experimental stroke. Stroke 2012; 43: 2221–2228. - PMC - PubMed
    1. Pekny M, Wilhelmsson U, Tatlisumak T, et al. Astrocyte activation and reactive gliosis-a new target in stroke? Neurosci Lett 2019; 689: 45–55. - PubMed
    1. Mifsud G, Zammit C, Muscat R, et al. Oligodendrocyte pathophysiology and treatment strategies in cerebral ischemia. CNS Neurosci Ther 2014; 20: 603–612. - PMC - PubMed
    1. Hira K, Ueno Y, Tanaka R, et al. Astrocyte-derived exosomes treated with a semaphorin 3a inhibitor enhance stroke recovery via prostaglandin D2 synthase. Stroke 2018; 49: 2483–2494. - PubMed

LinkOut - more resources