. 2025 Sep 1;224(9):e202411203.
doi: 10.1083/jcb.202411203. Epub 2025 Jul 28.

STIM-IP3R crosstalk regulates migration of breast cancer cells

Affiliations

STIM-IP3R crosstalk regulates migration of breast cancer cells

Ruslana Militsin et al. J Cell Biol. .

Abstract

Calcium ions (Ca2+) are crucial second messengers involved in numerous processes including tumorigenesis and cancer cell migration. Previous studies have shown that the endoplasmic reticulum (ER) Ca2+ sensors, stromal interaction molecules STIM1 and STIM2, are key regulators of cancer cell migration. In this study, using breast cancer cells lacking one or both STIM isoforms we show that although STIM proteins are critical regulators of cell migration, they are dispensable for this cellular activity. The mechanism underlying this complex effect involves functional crosstalk between STIM proteins and inositol 1,4,5-trisphosphate receptors (IP3Rs). Our findings indicate that beyond their classical role in store-operated Ca2+ entry, STIM proteins shape the spatial dynamics of IP3R-mediated Ca2+ release. Our results suggest that following ER Ca2+ depletion, the activated STIM proteins shift the pattern of IP3R-mediated Ca2+ release from a localized signal, which promotes cell migration, to a more diffuse signal, which attenuates cell migration.


Conflict of interest statement

Disclosures: The authors declare no competing interests exist.

Figures
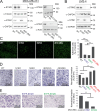
Figure S1.
Figure S1.
Additional data related to Fig. 1 . (A and B) Expression of STIM1 and STIM2 in MDA-MB-231 (A) and LM2-4 (B) cells following CRISPR/Cas9 gene editing. Representative images from WB analysis of lysates prepared from the indicated MDA-MB-231 (A) or LM2-4 (B) cells using antibodies for STIM1, STIM2, actin, GAPDH, or tubulin. Clones F10 and E5 are shown here as additional controls and were not used in the present study. (C) Representative images (left) and quantitation (right) of adhesion assays (n = 5) using the indicated MDA-MB-231 cells. The field of view in each image measures 2 × 2 mm. (D and E) Representative images (left) and quantitation (right) of two invasion assays using WT, S1KO, S2KO, dKO (C4), or dKO(B6) MDA-MB-231 cells (D) or using dKO(B6) cells re-expressing EYFP-STIM1 or EYFP-STIM2 (E). Scale bar = 300 μm. Results from each experiment in C or in D were normalized to WT cells, while data from E were normalized to control dKO cells. Bars show the mean ± SEM. Statistics: one-way ANOVA with Tukey’s post hoc test; *P < 0.05, **P < 0.01, ***P < 0.001. Source data are available for this figure: SourceData FS1.
Figure 1.
Figure 1.
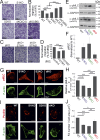
STIM proteins are essential for breast cancer cell seeding in a soft extracellular environment. (A) Average intracellular Ca2+ responses of SOCE are shown for WT (black, n = 126), S1KO (blue, n = 77), S2KO (green, n = 124) or for two independent clones of S1/S2 dKO (red; trace shows average of the two clones, B6, n = 46; C4, n = 54 cells). (B and C) Quantification (bars show the mean ± SEM) of SOCE (B) and Tg-induced ER Ca2+ release (C) for individual cells shown in (A). AUC is the area under the curve from time point 400 to 1,200 s. (D) ER Ca2+ was measured by tracking the fluorescence of G-CEPIA following treatment with Tg. Right inset shows a representative trace from WT cell illustrating the Tg-induced change in ER Ca2+ (Δ). Left, bars show the mean ± SEM of normalized ΔER Ca2+ for WT (n = 57), S1KO (n = 45), S2KO (n = 31), or S1/S2 dKO (B6, n = 42) cells. (E) Normalized alamarBlue absorbance (bars show the mean ± SEM, n = 3) at the indicated days following cell seeding is shown for WT, S1KO, S2KO, or dKO cells. (F) Left, representative images of colonies of the indicated type of cells formed on soft agar with or without embedded fibronectin (FN, orange) after 3 wk. Right, quantification of the average number of individual colonies per field of view, as indicated. Bars show the mean ± SEM from two experiments. The scale bar is 350 or 200 μm, as indicated. (G) Time course of average tumor growth after cancer cell inoculation is shown for the indicated cell types (five or six mice in each group). Note that no tumors were detected in mice injected with S1KO, S2KO, or dKO cells. Statistics: one-way ANOVA with Tukey’s post hoc test; *P < 0.05, **P < 0.01, ***P < 0.001.
Figure 2.
Figure 2.
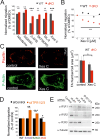
Deletion of both STIM isoforms rescues cell migration. (A) Representative images of WT, S1KO, S2KO, or dKO migrating cells, as indicated. (B) Scale bar = 350 μm (B)Number of migrating cells from each group was normalized to that of control (WT) cells. Bars show the mean ± SEM (WT, n = 18; S1KO, n = 13; S2KO, n = 15; dKO-C4, n = 8; dKO-B6, n = 7). (C and D) EYFP-STIM1 or EYFP-STIM2 was re-expressed in dKO cells. (C) Representative images of migrating cells from the indicated cells. Scale bar = 350 μm. (D) Number of migrating cells from STIM1 or STIM2 rescue cells was normalized to that of control (dKO) cells. Bars show the mean ± SEM (control, n = 7; STIM1, n = 6; STIM2, n = 7). (E and F) WB analysis of lysates from WT, S1KO, S2KO, and dKO cells using two different antibodies against pMLC (ab2480 or cs3675) and GAPDH as a loading control. (E) Representative images from two independent experiments. (F) Quantification of pMLC signal intensity relative to that of GAPDH and normalized to control (WT) cells. (G and H) Bars shows the mean ± SEM of normalized pMLC (n = 4) (G and H). Representative confocal images (G) and quantification (H) of anti-phosphorylated MLC (red) and phalloidin (F-actin, green) fluorescence (see the Materials and methods section). Bars show the mean ± SEM of pMLC staining at actin bundles per cell in the indicated cell type (WT, n = 30; S1KO, n = 28; S2KO, n = 32; dKO, n = 30). (I and J) Representative images (I) and quantification (J) of anti-paxillin (red) and phalloidin (F-actin, green) fluorescence (see the Materials and methods section). Bars show the mean ± SEM of FAs per cell in the indicated cell type (WT, n = 30; S1KO, n = 34; S2KO, n = 31; dKO, n = 36). Scale bar = 10 μm. Statistics: one-way ANOVA with Tukey’s post hoc test; *P < 0.05, **P < 0.01, ***P < 0.001. Source data are available for this figure: SourceData F2.
Figure S2.
Figure S2.
Expression of EMT markers and NFAT1 in MDA-MB-231 and MCF-7 cells. (A–D) Representative images (left) and quantitation (right) of WB analysis (n = 3–4) of lysates prepared from the indicated MDA-MB-231 or MCF-7 cells using antibodies for vimentin and actin (A), NFAT1 and GAPDH (B), Snail and tubulin (C), or E-cadherin and actin (D). (E) Quantification of total F-actin content in the indicated MDA-MB-231 cells (see Materials and methods). Bars show the mean ± SEM. Source data are available for this figure: SourceData FS2.
Figure S3.
Figure S3.
Additional data related to Fig. 3 . (A) Expression of IP3Rs in MDA-MB-231 and LM2-4 cells. (A-left) Representative images of WT and dKO migrating cells under normal conditions or low Ca2+, as indicated. (A-right) Quantification of the number of migrating cells from each group was normalized to that of control (WT) cells. Scale bar = 350 μm. (B and C) Representative images (left) and quantitation (right) of WB analysis (n = 3–4) of lysates prepared from the indicated MDA-MB-231 (A) or LM2-4 (B) cells using antibodies for IP3R1, IP3R2, IP3R3, or tubulin, as indicated. (D) Migration analysis of WT, S1KO, S2KO, or dKO cells treated with the indicated ITPR siRNAs. Bars show the mean ± SEM. Statistics: one-way ANOVA with Tukey’s post hoc test; *P < 0.05, **P < 0.01, ***P < 0.001. Source data are available for this figure: SourceData FS3.
Figure 3.
Figure 3.
Deletion of STIM proteins sensitizes cell migration to IP3R inhibition. (A) Indicated compounds were added to either WT or dKO cells, and the number of migrating cells from each group was normalized to that of control (DMSO-treated cells). The following inhibitor concentrations were used: 2-APB at 50 μM (WT, n = 5; dKO, n = 11), nifedipine at 50 μM (WT, n = 5; dKO, n = 10), SKF96365 at 10 μM (WT, n = 5; dKO, n = 10), Xes-C at 5 μM (WT, n = 10; dKO, n = 5), NS8593 at 5 μM (WT, n = 5; dKO, n = 5), and ML-9 at 10 μM (WT, n = 5; dKO, n = 5). Bars show the mean ± SEM. (B) Migration was analyzed as in A using the indicated concentration of Xes-C (WT, n = 11–16; dKO, n = 5–11). (C) (C-left) Representative images (left) of anti-paxillin (red) and phalloidin (F-actin, green) fluorescence in dKO cells treated with Xes-C or DMSO (control). (C-right) Mean ± SEM of FAs per cell in WT (control, n = 9; Xes-C, n = 15) or dKO (control, n = 8; Xes-C, n = 13) cells. Scale bar = 10 μm. (D) Migration analysis (bars show the mean ± SEM) of WT (n = 14), S1KO (n = 11), S2KO (n = 10), or dKO cells (n = 15) treated with the indicated ITPR siRNAs. (E) WB analysis using antibodies for IP3R1, IP3R2, IP3R3, or tubulin of lysates prepared from WT cells treated with siRNAs against IP3R1, IP3R2, or IP3R3, as indicated. Statistics: two-tailed t test; *P < 0.05, **P < 0.01, ***P < 0.001. Source data are available for this figure: SourceData F3.
Figure 4.
Figure 4.
Deletion of both STIM proteins diminishes the overall IP3-mediated response. (A) Average intracellular Ca2+ responses following application of Ca2+-free solution containing 200 μM ATP in a representative experiment are shown for WT (n = 48) and dKO (n = 46) cells. (B) Bars show the mean ± SEM of the percentage of responding cells (gray bars) or quantitation of ATP-induced Ca2+ release (AUC, purple bars) from three experiments as shown in A. (C) Cells were loaded with ci-IP3 and Cal-590 (see Materials and methods). Panel shows the average intracellular Ca2+ responses for WT (n = 163), S1KO (n = 139), S2KO (n = 200), or dKO (n = 189) cells following a brief (1-s) illumination with 405-nm laser. Note the lack of response in WT cells lacking ci-IP3 (n = 19). (D) Bars show the mean ± SEM of the percentage of responding cells (gray bars) or quantitation of UV-induced Ca2+ release (AUC, purple bars) from seven experiments as shown in C. Statistics: two-tailed t test (B) and one-way ANOVA with Tukey’s post hoc test (D); *P < 0.05, **P < 0.01, ***P < 0.001. AUC, area under the curve.
Figure S4.
Figure S4.
Additional data related to Figs. 4, 5 and 6. (A) Cells were cultured on Matrigel-coated polyacrylamide gels of the indicated stiffness or on glass. The average intracellular Ca2+ responses in Fura-2–loaded cells following the application of a Ca2+-free solution containing 200 µM ATP are shown for each condition (n = 202 for both WT and dKO cells). (B–D) Mean rise and decay times of Ca2+ puff fluorescence were measured during increases and decreases to 20%, 50%, 80%, and 100%, analyzed from the indicated type of MDA-MB-231 (B) or LM2-4 (C) cells shown in Fig. 5 or from MDA-MB-231 STIM dKO control or STIM1, STIM2, or STIM1 D76A–expressing (rescue) cells (D) shown in Fig. 6. (E) Quantification of resting Ca2+ levels in the indicated cells following loading with a Ca2+ indicator (Fura-2), caged IP3 (ci-IP3/PM), and EGTA-AM. Statistics: one-way ANOVA with Tukey’s post hoc test; *P < 0.05.
Figure 5.
Figure 5.
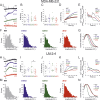
STIM proteins promote a change in the IP3R mode of Ca 2+ release. Analysis of global and puff Ca2+ release in the indicated MDA-MB-231 (WT, n = 15; S1KO, n = 16; S2KO, n = 12; dKO, n = 15) cells or LM2-4 (WT, n = 14; S1KO, n = 8; S2KO, n = 11; dKO, n = 12) cells. (A and H) Representative traces of Cal-520 fluorescence ratios (ΔF/F0) recorded from the center of an individual puff site before and after ci-IP3 uncaging by a pulse (1 s) of 405-nm light in the indicated MDA-MB-231 (A) or LM2-4 (H) cells. (B, C, I, and J) Boxplot analysis shows the number of Ca2+ puffs (B and I) or puff sites (C and J) per cell for the indicated type of MDA-MB-231 (B and C) or LM2-4 (I and J) cells. (D and K) Average global Ca2+ responses recorded after UV-induced IP3 uncaging for the indicated type of MDA-MB-231 (D) or LM2-4 (K) cells. (E and L) Time course of Ca2+ release via Ca2+ puff in the indicated MDA-MB-231 (E) or LM2-4 (L) cells was quantified by multiplying the number of Ca2+ puffs by the average puff amplitude within 6-s time intervals. Note that in S1KO or S2KO cells, the rise in cell-wide Ca2+ (D and K) occurs, while localized Ca2+ release decreases (E and L). (F, G, M, and N) Amplitude distributions of local Ca2+ puffs in the indicated MDA-MB-231 (F) or LM2-4 (M). (G and N) Curves show the normalized Gaussian fit to the data shown in F or M for the indicated type of cells. Statistics: one-way ANOVA with Tukey’s post hoc test; *P < 0.05.
Figure S5.
Figure S5.
Analysis of STIM expression and function in LM2-4 cells. (A) Average intracellular Ca2+ responses during SOCE are shown for WT (n = 137), S1KO (n = 70), S2KO (n = 73), and S1/S2 dKO (n = 87) LM2-4 cells. (B and C) Quantification of SOCE (B) and Tg-induced ER Ca2+ release (C) for individual cells depicted in A. The AUC was calculated from 400 to 1,200 s. (D) Analysis of SOCE in Fluo-4–loaded LM2-4 cells (n = 46) compared with MDA-MB-231 cells (n = 47). (E and F) Representative images (left) and quantification (right) of WB analysis (n = 3–4) of lysates from LM2-4 and MDA-MB-231 cells using antibodies against STIM1, STIM2, or actin, as indicated. (G) Traces of cell-wide Ca2+ dynamics recorded from individual WT, S1KO, S2KO, and dKO LM2-4 cells using the experimental protocol described in Fig. 5. Upper inset shows a pie chart of the fraction of cells showing global Ca2+ rise (blue) following UV-induced uncaging of IP3. (H) Total cell lysates were prepared from S1/S2 dKO HEK293 cells expressing either EYFP-STIM1 WT, the D76A mutant, or EGFP. WB images of the IP protein material and eluted fractions are shown, demonstrating the absence of interaction between STIM1 and IP3R2 or IP3R3. Bars show the mean ± SEM. Statistics: one-way ANOVA with Tukey’s post hoc test (B and C) or two-tailed t test (F); *P < 0.05, **P < 0.01, ***P < 0.001. AUC, area under the curve; IP, immunoprecipitated. Source data are available for this figure: SourceData FS5.
Figure 6.
Figure 6.
Restoring STIM1 or STIM2 expression rescues IP3-dependent Ca 2+ release through a diffuse release mode. (A) Proposed model for STIM regulation of diffuse Ca2+ release via IP3R. Under ER Ca2+ replete conditions, STIM is at a resting conformation and IP3R-mediated Ca2+ release occurs primarily via local Ca2+ puffs. Upon a decrease in [Ca2+]ER, STIM adopts an active conformation and promotes a diffuse mode of Ca2+ release via IP3R. (B) Average (mean ± SEM) intracellular Ca2+ responses of basal and SOCE are shown for control dKO (n = 67) or for dKO cell expressing STIM1 (n = 85), STIM2 (n = 89), or STIM1 D76A (n = 58) cells. (C) Boxplot shows quantification of Tg-induced ER Ca2+ release for individual cells shown in B. (D–J) Analysis of global and puff Ca2+ release in MDA-MB-231 control dKO cells (n = 13) or in cells expressing EYFP-STIM1 (n = 19), EYFP-STIM2 (n = 23), or EYFP-STIM1 D76A (n = 29). (D) Representative traces of Cal-590 fluorescence ratios (ΔF/F0) recorded from the center of an individual puff site before and after ci-IP3 uncaging by a pulse (1 s) of 405-nm light in the indicated cells. (E and F) Boxplot shows the number of Ca2+ puffs (E) or puff sites (F) per cell for the indicated cells. (G) Average global Ca2+ responses recorded after UV-induced IP3 uncaging for the indicated cells. (H) Time course of Ca2+ release via Ca2+ puff in the indicated cells was quantified as in Fig. 5 E. Note that in cells expressing STIM1 or STIM2, a rise in global Ca2+ levels (G) is accompanied by a decrease in localized Ca2+ release (H). However, in cells expressing the STIM1 D76A mutant, the global Ca2+ increase occurs without a corresponding decrease in localized release. (I) Amplitude distributions of local Ca2+ puffs in the indicated cells. (J) Curves show the normalized Gaussian fit to the data shown in I for the indicated type of cells. Statistics: one-way ANOVA with Tukey’s post hoc test; *P < 0.05, ***P < 0.001.
Figure 7.
Figure 7.
Mechanistic model of STIM-IP3R crosstalk in regulating breast cancer cell migration. Breast cancer cell migration is regulated by a dynamic interplay between STIM proteins and IP3Rs, which together shape the spatiotemporal pattern of intracellular Ca2+ signaling. In WT cells, transient ER Ca2+ depletion triggered by localized IP3R-mediated Ca2+ release is rapidly replenished through SOCE, driven by the coordinated activity of both STIM1 and STIM2. This balance of spatiotemporally separated localized Ca2+ signals from both IP3Rs and SOCE supports efficient cell migration. In cells lacking either STIM1 or STIM2, the remaining isoform functions near its activation threshold due to lower ER Ca2+ stores. As a result, even slight ER Ca2+ depletion, such as that initiated by IP3R activity, activates the residual STIM protein, shifting IP3R-mediated Ca2+ signals from localized to diffuse/global Ca2+ release mode. This altered Ca2+ pattern disrupts the finely tuned signaling required for cell migration, leading to impaired motility. In cells lacking both STIM isoforms, this feedback mechanism is lost entirely, allowing IP3Rs to continue generating localized Ca2+ signals unmodulated by STIM proteins. Restoration of spatially confined Ca2+ signaling supports the maintenance of cell migration despite the complete loss of STIM-mediated SOCE. Created with https://BioRender.com.

References

    1. Ahmad, M., Ong H.L., Saadi H., Son G.-Y., Shokatian Z., Terry L.E., Trebak M., Yule D.I., and Ambudkar I.. 2022. Functional communication between IP3R and STIM2 at subthreshold stimuli is a critical checkpoint for initiation of SOCE. Proc. Natl. Acad. Sci. USA. 119:e2114928118. 10.1073/pnas.2114928118 - DOI - PMC - PubMed
    1. Aratyn-Schaus, Y., Oakes P.W., Stricker J., Winter S.P., and Gardel M.L.. 2010. Preparation of complaint matrices for quantifying cellular contraction. J. Vis. Exp. 2173. 10.3791/2173 - DOI - PMC - PubMed
    1. Béliveau, É., Lessard V., and Guillemette G.. 2014. STIM1 positively regulates the Ca2+ release activity of the inositol 1,4,5-trisphosphate receptor in bovine aortic endothelial cells. PLoS One. 9:e114718. 10.1371/journal.pone.0114718 - DOI - PMC - PubMed
    1. Brandman, O., Liou J., Park W.S., and Meyer T.. 2007. STIM2 is a feedback regulator that stabilizes basal cytosolic and endoplasmic reticulum Ca2+ levels. Cell. 131:1327–1339. 10.1016/j.cell.2007.11.039 - DOI - PMC - PubMed
    1. Brundage, R.A., Fogarty K.E., Tuft R.A., and Fay F.S.. 1991. Calcium gradients underlying polarization and chemotaxis of eosinophils. Science. 254:703–706. 10.1126/science.1948048 - DOI - PubMed

MeSH terms