. 2025 Jul 28:14:RP104423.
doi: 10.7554/eLife.104423.

Phosphoglycerate mutase regulates Treg differentiation through control of serine synthesis and one-carbon metabolism

Affiliations

Phosphoglycerate mutase regulates Treg differentiation through control of serine synthesis and one-carbon metabolism

Wesley H Godfrey et al. Elife. .

Abstract

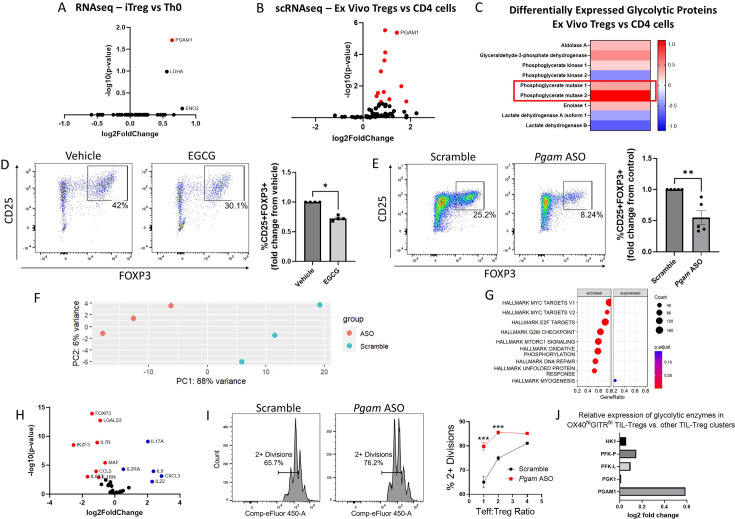
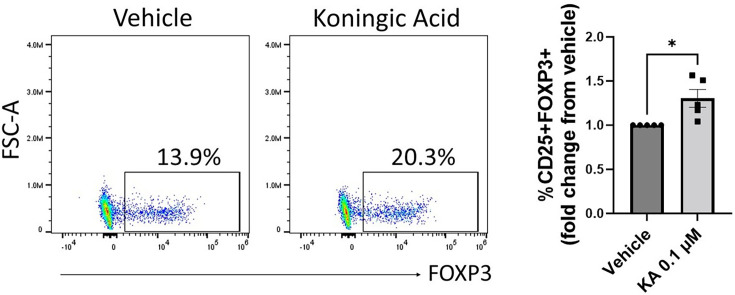
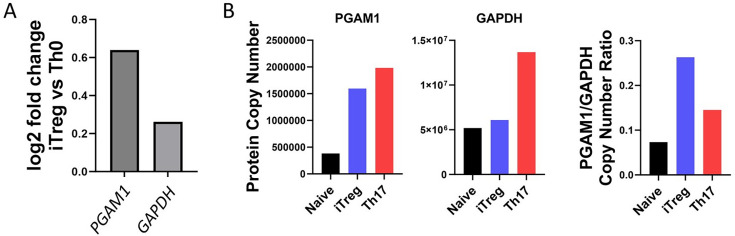
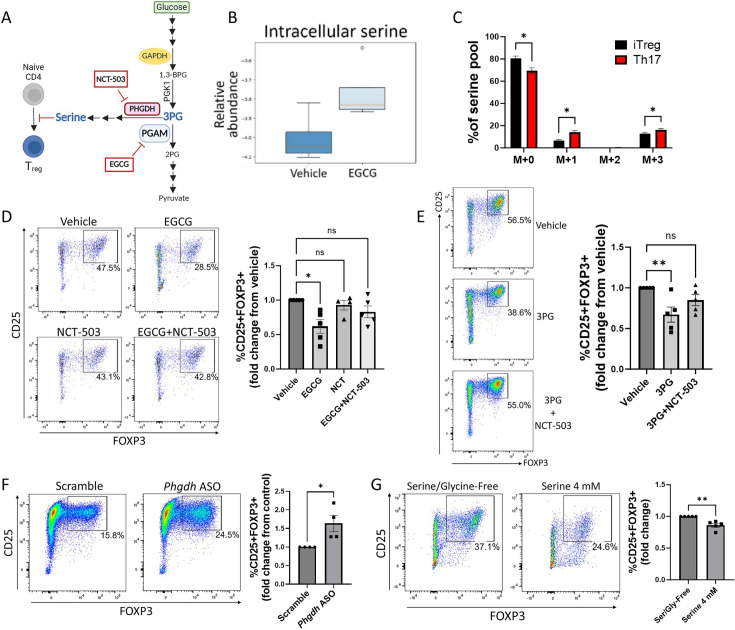
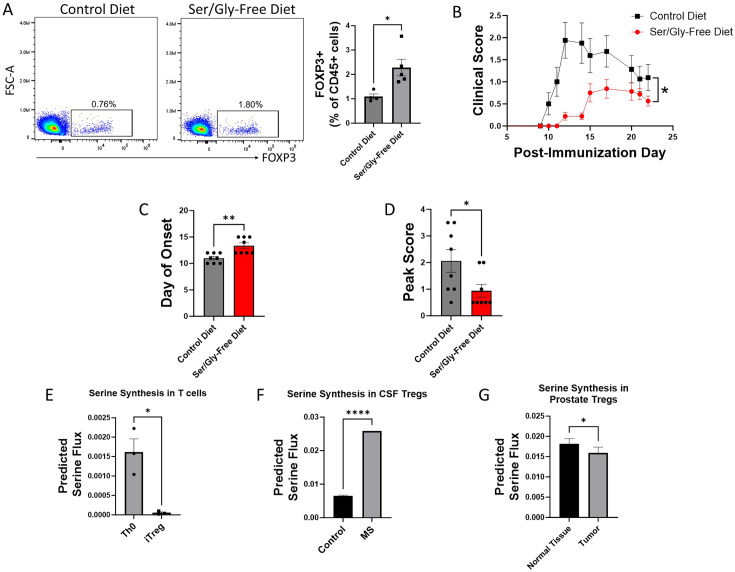
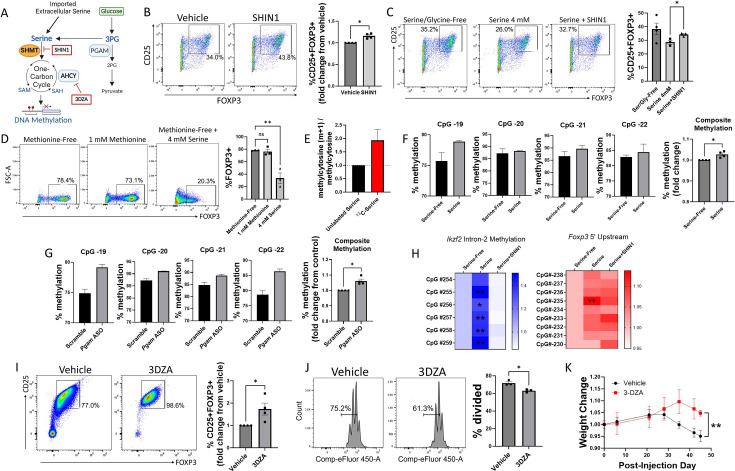
The differentiation and suppressive functions of regulatory CD4 T cells (Tregs) are supported by a broad array of metabolic changes, providing potential therapeutic targets for immune modulation. In this study, we focused on the regulatory role of glycolytic enzymes in Tregs and identified phosphoglycerate mutase (PGAM) as being differentially overexpressed in Tregs and associated with a highly suppressive phenotype. Pharmacologic or genetic inhibition of PGAM reduced Treg differentiation and suppressive function while reciprocally inducing markers of a pro-inflammatory, T helper 17 (Th17)-like state. The regulatory role of PGAM was dependent on the contribution of 3-phosphoglycerate (3 PG), the PGAM substrate, to de novo serine synthesis. Blocking de novo serine synthesis from 3 PG reversed the effect of PGAM inhibition on Treg polarization, while exogenous serine directly inhibited Treg polarization. Additionally, altering serine levels in vivo with a serine/glycine-free diet increased peripheral Tregs and attenuated autoimmunity in a murine model of multiple sclerosis. Mechanistically, we found that serine limits Treg polarization by contributing to one-carbon metabolism and methylation of Treg-associated genes. Inhibiting one-carbon metabolism increased Treg polarization and suppressive function both in vitro and in vivo in a murine model of autoimmune colitis. Our study identifies a novel physiologic role for PGAM and highlights the metabolic interconnectivity between glycolysis, serine synthesis, one-carbon metabolism, and epigenetic regulation of Treg differentiation and suppressive function.

Keywords: PGAM; T cell biology; Treg; glycolysis; immunology; immunometabolism; inflammation; mouse; phosphoglycerate mutase; serine synthesis.


Conflict of interest statement

WG, JL, SS, KC, XD, CA, VP, AM, PK, NP No competing interests declared, MK Has received ad hoc consulting fees from Biogen Idec, Genentech, Janssen Pharmaceuticals, Novartis, OptumRx, and TG Therapeutics on topics unrelated to this manuscript

Figures

Figure 1.
Figure 1.. Phosphoglycerate mutase (PGAM) regulates Treg differentiation and suppressive function.
. (AC) Analysis of publicly available transcriptomics and proteomics data reveals upregulation of PGAM expression in human iTregs and ex vivo Tregs. (A) Publicly available RNA sequencing (RNA-seq) data from human naïve CD4 cells cultured under either Th0 or Treg polarizing conditions for 72 hr (Ullah et al., 2018) was analyzed, and genes belonging to the Gene Ontology (GO) term ‘Glycolysis and Gluconeogenesis’ were plotted. (B) Differential expression of ‘Glycolysis and Gluconeogensis’ GO genes in ex vivo Tregs vs. total CD4 cells derived from healthy donor peripheral blood mononuclear cells (PBMCs) (Schafflick et al., 2020). GAPDH was removed for scaling purposes. (C) Differential expression of cytosolic glycolytic enzymes in ex vivo Tregs vs. conventional CD4 T cells derived from healthy donor PBMCs, analyzed from publicly available proteomics data (Procaccini et al., 2016). (D) Naïve murine CD4 cells were cultured under Treg polarizing conditions for 4 days and treated with either EGCG (20 μM) or vehicle on day 1. Treg polarization based on CD25 and FOXP3 expression was analyzed by flow cytometry. Data represent mean ± SEM from four independent experiments, with three to four biological replicates per experiment. (E) Naïve murine CD4 cells were treated with either scrambled or Pgam-specific antisense oligonucleotides (ASOs) and cultured under Treg polarizing conditions for 72 hr. CD25 and FOXP3 expression were analyzed by flow cytometry. Data represent mean ± SEM from five independent experiments, with three to four biological replicates per experiment. (FH) Naïve murine CD4 cells were cultured with either scrambled or anti-Pgam ASOs for 72 hr under Treg polarizing conditions. RNA was isolated from unsorted cells for RNA-seq, followed by library size normalization and differential expression analysis. Shown for scrambled versus anti-Pgam ASO-treated cells are (F) PCA plot, (G) Gene Set Enrichment Analysis (GSEA) using MSigDB Hallmark gene sets, and (H) volcano plot of genes associated with T cell function. Data from 3 biological replicates. (I) Naïve murine CD4 cells were cultured under Treg polarizing conditions with either scrambled or anti-Pgam ASOs for 72 hr. To assess Treg suppressive function, the polarized Tregs were cultured with naïve CD4 cells stimulated with CD3/CD28 stimulating antibodies for an additional 72 hr at the indicated ratios. Cell proliferation was measured by dilution of a cell proliferation dye. Data represent mean ± SEM from four biological replicates. (J) Analysis of a published scRNA-seq dataset of tumor-infiltrating Tregs (TIL-Tregs) (Dykema et al., 2023) shows that PGAM1 is overexpressed in the most highly suppressive subpopulation, out of proportion to proximal rate-limiting glycolytic enzymes. *p<0.05, **p<0.01, ***p<0.0001 by Mann-Whitney U Test (D, E) or two-way ANOVA with multiple comparisons testing (I). P-values in (A), (B), and (FH) were derived from Wald’s test after False Discovery Rate correction and median-of-ratios normalization via DESeq2.
Figure 1—figure supplement 1.
Figure 1—figure supplement 1.. Epigallocatechin gallate (EGCG) has no effect on Treg viability or proliferation.
Naïve murine CD4 cells were cultured under Treg polarizing conditions with either vehicle or EGCG (20 μM). (A) Viability was assayed with Zombie NIR dye. (B) Cell proliferation was assayed via cell proliferation dye, with proliferation index calculated as the total number of divisions divided by the number of cells that went into division. Data derived from three biological replicates. ns = not significant by Student’s t-test.
Figure 1—figure supplement 2.
Figure 1—figure supplement 2.. Efficient uptake of antisense oligonucleotides (ASOs) by cultured CD4 cells.
Naïve murine CD4 cells were cultured under Treg polarizing conditions for 24 hr with scrambled ASOs that were either unlabeled or labeled with a fluorescein (FAM) tag (detected in the FITC channel). Uptake of ASOs was assessed by measuring FITC signal within cells via flow cytometry.
Figure 1—figure supplement 3.
Figure 1—figure supplement 3.. Pgam antisense oligonucleotides (ASOs) reduce PGAM1 expression without impacting viability.
Naïve murine CD4 cells were cultured under Treg polarizing conditions for 72 hr with either scrambled or anti-Pgam ASOs. (A) PGAM1 expression and (B) cell viability were assayed by flow cytometry. Data represent mean ± SEM from three biological replicates. (C) Cell proliferation dye was used to quantify proliferation index, calculated as in Figure 1—figure supplement 1. Data represent mean ± SEM from three biological replicates. *p<0.05, **p<0.01 or ns = not-significant by Student’s t-test.
Figure 1—figure supplement 4.
Figure 1—figure supplement 4.. Glyceraldehyde-3-phosphate dehydrogenase (GAPDH) inhibition promotes Treg polarization.
Naïve murine CD4 cells were cultured under Treg polarizing conditions with vehicle or koningic acid (KA, 0.1 μM) for 96 hrs. Treg polarization was assayed by flow cytometry. Data represent mean ± SEM from five independent experiments performed in triplicate. *p<0.05 by Mann-Whitney U test.
Figure 1—figure supplement 5.
Figure 1—figure supplement 5.. Increased Phosphoglycerate mutase (PGAM) to glyceraldehyde-3-phosphate dehydrogenase (GAPDH) expression ratio in regulatory T cells.
(A) Analysis of a publicly available RNA sequencing (RNA-seq) dataset from human naïve CD4 cells cultured under either Th0 or Treg polarizing conditions for 72 hr (Ullah et al., 2018) shows log2 fold change of PGAM1 expression versus GAPDH expression in iTreg cells. (B) Data from the ImmPres immunological proteome resource (Brenes et al., 2023) showing protein copy number of PGAM1 (left) and GAPDH (middle) as well as the ratio of PGAM1 to GAPDH protein copy number (right), derived from murine CD4 cells in the naïve state or polarized under Treg or Th17 conditions.
Figure 2.
Figure 2.. Phosphoglycerate mutase (PGAM) regulates Treg differentiation through control of de novo serine synthesis.
(A) Schematic diagram of the intersection of glycolysis and the de novo serine synthesis pathway via the PGAM substrate 3 PG. Pharmacologic inhibitors are shown in red boxes. This panel was created using BioRender.com. (B) Naïve murine CD4 cells were cultured under Treg polarizing conditions for 4 days and treated with vehicle or epigallocatechin gallate (EGCG) (20 μM) on day 1. Unsorted cells were then lysed and metabolites were extracted and analyzed via LC-MS. Data from four biological replicates. (C) The rate of glucose-derived serine synthesis from polarized murine Tregs or Th17 cells was measured by adding U13C-glucose to the culture media for 6 hr and quantifying the percentage of labeled/unlabeled serine via LC-MS. The mass isotopomer distribution (MID) of U13C-glucose-derived serine and percent contribution to the total serine pool is shown. Data represent mean ± SEM from three biological replicates. (D) Naïve murine CD4 cells were cultured under Treg polarizing conditions for 4 days. On day 1, the cells were treated with vehicle or the indicated combinations of the PGAM inhibitor EGCG (10 μM) and the PHGDH inhibitor NCT-503 (10 μM) (doses optimized for combination treatment). Treg polarization was assayed by flow cytometry. Data represent mean ± SEM from five independent experiments. (E) Naïve murine CD4 cells were polarized under Treg conditions for 4 days. On day 1 of polarization, cells were either sham-electroporated or supplemented with 3 PG (1.5 mM) by electroporation and treated with vehicle or the PHGDH inhibitor NCT-503 (10 μM). Analysis was performed by flow cytometry. Data represent mean ± SEM from five independent experiments. (F) Naïve CD4 cells were cultured under Treg polarizing conditions with either scrambled or anti-Phgdh ASOs, and Treg generation was analyzed by flow cytometry. Data represent mean ± SEM from four independent experiments. (G) Naïve murine CD4 cells were cultured under Treg polarizing conditions for 4 days with either serine/glycine-free media or serine/glycine-free media supplemented with 4 mM serine, followed by flow cytometric analysis. Data represent mean ± SEM from five independent experiments. *p<0.05, **p<0.01 by Mann-Whitney U test (F, G), Kruskal-Wallis test with multiple comparisons testing (D, E), or Student’s t-test with multiple hypothesis correction (C). Each independent experiment shown in (D-E) included three to four biological replicates.
Figure 3.
Figure 3.. Serine synthesis and dietary availability regulate Tregs in vivo and in disease states.
(A) C57BL/6 mice were fed either serine/glycine-free diet or control diet for 8 weeks, beginning immediately post-weaning. Peripheral Tregs from blood were quantified by flow cytometry as the percentage of CD45+ cells expressing FOXP3. Data represent mean ± SEM from four to five mice per group. (B-D) Mice were fed either serine/glycine-free diet or control diet for 7 days and then subjected to MOG35-55 EAE. Clinical scoring was performed by a blinded observer. Data represent mean ± SEM from eight mice per group. Shown are (B) clinical scores over the course of the experiment, (C) day of neurologic symptom onset, and (D) peak clinical scores. (E-G) Publicly available RNA-seq data from three different datasets were analyzed using single-cell flux estimation analysis (SCFEA) to model serine synthesis rates from mRNA levels of metabolic enzymes. (E) SCFEA from human naïve CD4 cells cultured under either Th0 or Treg polarizing conditions for 72 hr (Ullah et al., 2018) predicts decreased serine synthesis in iTregs. (F) Predicted serine synthesis is increased in Tregs derived from cerebrospinal fluid of patients with treatment-naïve relapsing multiple sclerosis (MS) compared to controls (Schafflick et al., 2020). (G) Predicted serine synthesis is decreased in Tregs derived from prostate cancer versus control prostate (Camps et al., 2023). *p<0.05, **p<0.01, ****p<0.00001 by Student’s t-test (A, E, F, G), Mann-Whitney U test (C, D), and two-way ANOVA with repeated measures (B).
Figure 4.
Figure 4.. Serine inhibits Treg polarization by contributing to one-carbon metabolism and methylation of Treg-associated genes.
(A) Schematic diagram of serine entry into one-carbon metabolism and the methyl donor cycle. Pharmacologic inhibitors are shown in red boxes. This panel was created using BioRender.com. (B) Naïve murine CD4 cells were cultured under Treg polarizing conditions for 72 hr with either vehicle or SHIN1 (SHMT1/2 inhibitor, 1 μM) added at day 0 of culture. Treg polarization was assayed by flow cytometry. Data represent mean ± SEM from four independent experiments, with 3–4 biological replicates per experiment. (C) Naïve murine CD4 cells were cultured in serine/glycine-free media, media containing 4 mM serine, or media with serine plus SHIN1 (1 μM). Treg polarization was assayed by flow cytometry. Data represent mean ± SEM from three to four biological replicates per condition. (D) Naïve murine CD4 cells were cultured in methionine-free media supplemented with vehicle, 1 mM methionine, or 4 mM serine, and FOXP3 expression was assayed by flow cytometry. Data represent mean ± SEM from three biological replicates. (E) Naïve murine CD4 cells were cultured in serine/glycine-free media for 48 hr under Treg polarizing conditions and then for 12 hr with either unlabeled serine or U13C-serine. The mass isotopomer ratio of carbon-labeled methylcytosine (m+1) / unlabeled methylcytosine from unsorted cells is shown. Data represent mean ± SEM from three biological replicates. (F) Naïve CD4 cells were cultured under Treg polarizing conditions with either serine/glycine-free media or 4 mM serine. Methylation at the Foxp3 TSDR was assayed by pyrosequencing from unsorted cells. The composite methylation was calculated as the percent methylation for each of the 4 CpG sites measured in the assay normalized to the serine/glycine-free condition. Data derived from three biological replicates per condition. (G) Naïve CD4 cells were cultured under Treg polarizing conditions with either scrambled or anti-Pgam ASOs. Methylation at the Foxp3 TSDR was assayed by pyrosequencing from unsorted cells. The composite methylation was calculated as the percent methylation at each of the 4 CpG sites measured in the assay normalized to scrambled control. Data derived from three biological replicates per condition. (H) Naïve murine CD4 cells were cultured in serine/glycine-free media, media containing 4 mM serine, or media with serine plus SHIN1 (1 μM). Bisulfite-treated DNA was sequenced from unsorted cells using a Treg-specific next generation sequencing panel, and percent methylation of key sites was calculated. Data derived from three biological replicates per condition. (I) Naïve CD4 cells were cultured under Treg polarizing conditions with either vehicle or 3-Deazaadenosine (3DZA, AHCY inhibitor, 5 μM). Treg polarization was assayed by flow cytometry. Data represent mean ± SEM from 4 independent experiments, with three to four biological replicates per experiment. (J) Naïve CD4 cells were polarized to Tregs with either vehicle or 3DZA and then cultured with CD4 cells stimulated with CD3/CD28 to evaluate Treg suppressive function. CD4 cell proliferation was measured by flow cytometry. Data represent mean ± SEM from 3 biological replicates. (K) Naïve CD4 cells were cultured under Treg polarizing conditions with either vehicle or 3DZA, and 106 cells were then transferred into RAG -/- mouse recipients along with 107 activated CD4 cells. Mice were weighed at the specified times and weights are shown relative to the weight at the day of injection. Data represent mean ± SEM from five mice per group. *p<0.05, **p<0.01 by Mann-Whitney U test (B, F, G, I), one-way ANOVA with Tukey’s multiple comparisons testing (C, D), two-way ANOVA with Dunnett’s multiple comparison testing (H), Student’s t-test of average final weight (K), or Student’s t-test (J).
Figure 4—figure supplement 1.
Figure 4—figure supplement 1.. 3DZA does not affect viability.
Naïve murine CD4 cells were cultured under Treg polarizing conditions for 72 hr with either vehicle or 3DZA (5 μM). Cell viability was assayed by flow cytometry. Data represent mean ± SEM from five to six biological replicates. ns = not significant by Student’s t-test.
Figure 4—figure supplement 2.
Figure 4—figure supplement 2.. Tregs polarized with 3DZA are more suppressive in the T cell transfer model of autoimmune colitis.
Naïve murine CD4 T cells were cultured under Treg polarizing conditions with either vehicle or 3DZA and 106 cells were transferred into RAG-/- mouse recipients along with 107 activated CD4 T cells. Mice injected with vehicle-treated Tregs showed colonic wall thickening indicative of more severe colitis.

Update of

Similar articles

References

    1. Abraham AR, Maghsoudlou P, Copland DA, Nicholson LB, Dick AD. CAR-Treg cell therapies and their future potential in treating ocular autoimmune conditions. Frontiers in Ophthalmology. 2023;3:1184937. doi: 10.3389/fopht.2023.1184937. - DOI - PMC - PubMed
    1. Abramson E, Hardman C, Shimizu AJ, Hwang S, Hester LD, Snyder SH, Wender PA, Kim PM, Kornberg MD. Designed PKC-targeting bryostatin analogs modulate innate immunity and neuroinflammation. Cell Chemical Biology. 2021;28:537–545. doi: 10.1016/j.chembiol.2020.12.015. - DOI - PMC - PubMed
    1. Alghamdi N, Chang W, Dang P, Lu X, Wan C, Gampala S, Huang Z, Wang J, Ma Q, Zang Y, Fishel M, Cao S, Zhang C. A graph neural network model to estimate cell-wise metabolic flux using single-cell RNA-seq data. Genome Research. 2021;31:1867–1884. doi: 10.1101/gr.271205.120. - DOI - PMC - PubMed
    1. Angelin A, Gil-de-Gómez L, Dahiya S, Jiao J, Guo L, Levine MH, Wang Z, Kopinski PK, Quinn WJ, Wang L, Akimova T, Liu Y, Bhatti TR, Han R, Laskin BL, Baur JA, Blair IA, Wallace DC, Hancock WW, Beier UH. Foxp3 Reprograms T cell metabolism to function in low-glucose, high-lactate environments. Cell Metabolism. 2017;25:1282–1293. doi: 10.1016/j.cmet.2016.12.018. - DOI - PMC - PubMed
    1. Berod L, Friedrich C, Nandan A, Freitag J, Hagemann S, Harmrolfs K, Sandouk A, Hesse C, Castro CN, Bähre H, Tschirner SK, Gorinski N, Gohmert M, Mayer CT, Huehn J, Ponimaskin E, Abraham WR, Müller R, Lochner M, Sparwasser T. De novo fatty acid synthesis controls the fate between regulatory T and T helper 17 cells. Nature Medicine. 2014;20:1327–1333. doi: 10.1038/nm.3704. - DOI - PubMed

MeSH terms

Associated data