

Single cell transcriptomic analysis reveals transcriptome differences of different cells between eosinophilic chronic rhinosinusitis with nasal polyps and non-eosinophilic chronic rhinosinusitis with nasal polyps
- PMID: 40720416
- PMCID: PMC12303326
- DOI: 10.1371/journal.pone.0328241
Single cell transcriptomic analysis reveals transcriptome differences of different cells between eosinophilic chronic rhinosinusitis with nasal polyps and non-eosinophilic chronic rhinosinusitis with nasal polyps
Abstract
Background: Chronic rhinosinusitis (CRS) with nasal polyps is a heterogeneous chronic inflammatory disease generally divided into two phenotypes including eosinophilic CRS with nasal polyps (eCRSwNP) and non-eosinophilic CRS with nasal polyps (neCRSwNP). However, its pathogenesis remains largely unknown. The aim of this study was to explore mechanistic differences between eCRSwNP and neCRSwNP using a bioinformatics approach.
Methods: We comprehensively analyzed single-cell RNA sequencing data from 3 healthy controls and 6 patients with CRSwNP (including 3 with eCRSwNP and 3 with neCRSwNP) to explore the heterogeneity and potential mechanisms of CRSwNP.
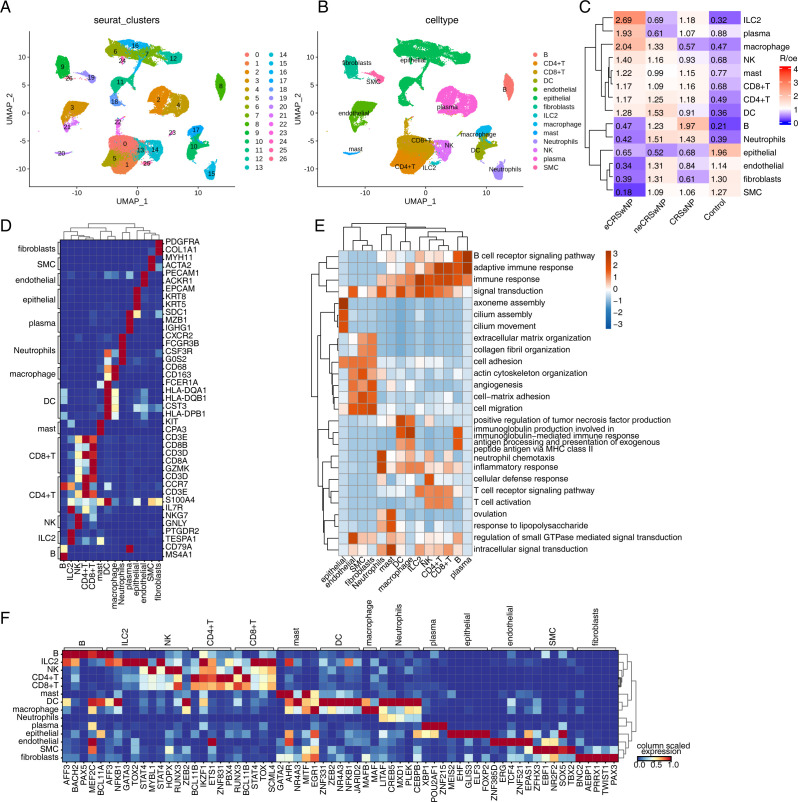
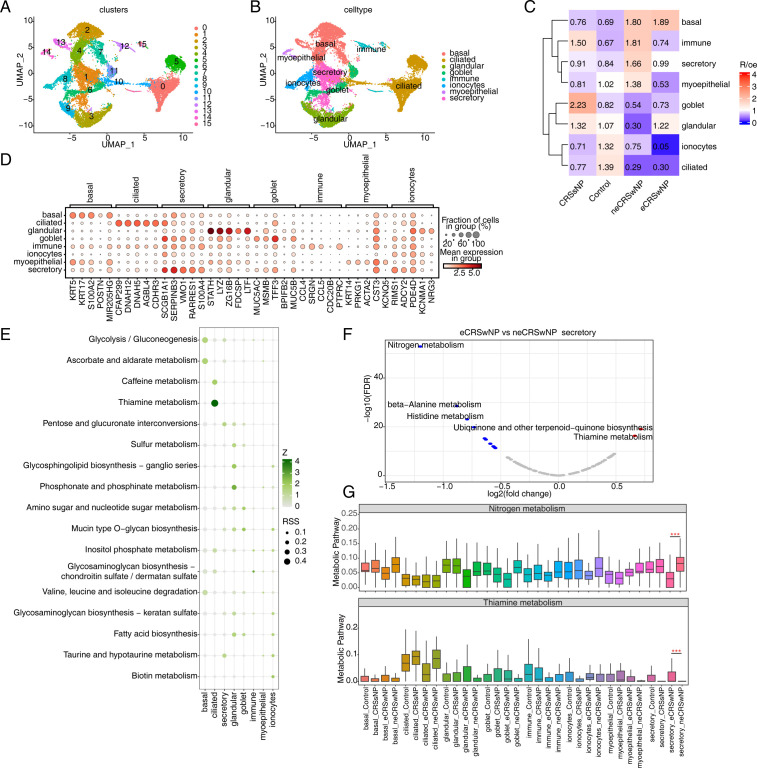
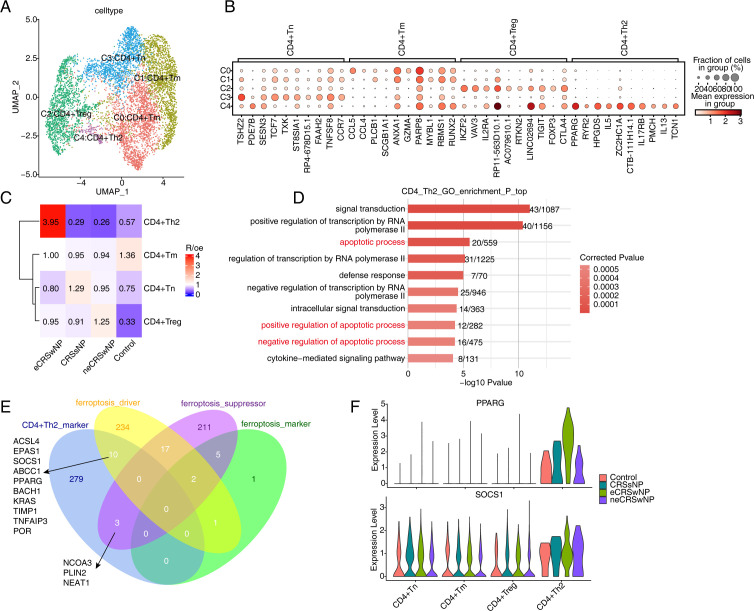
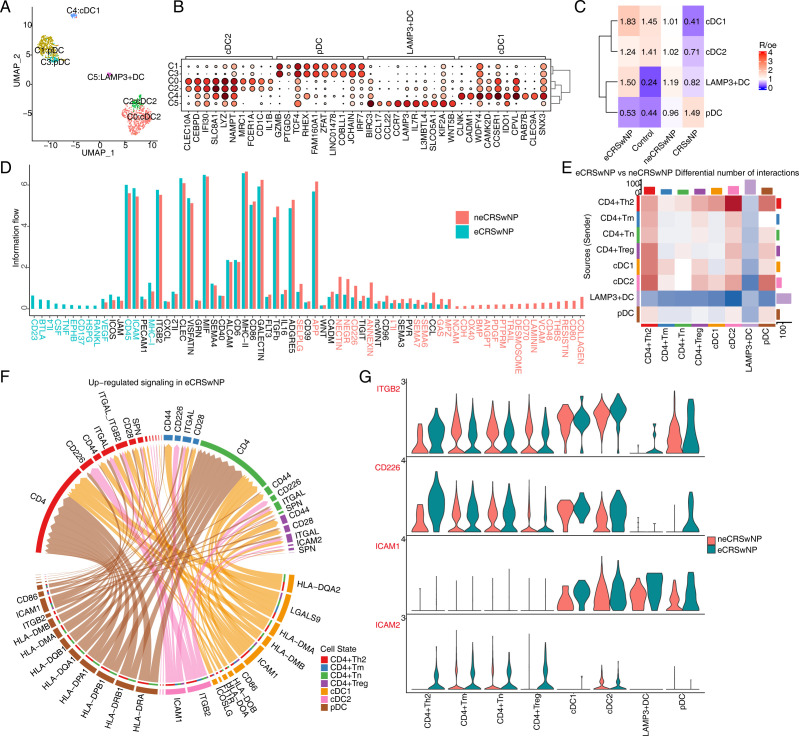
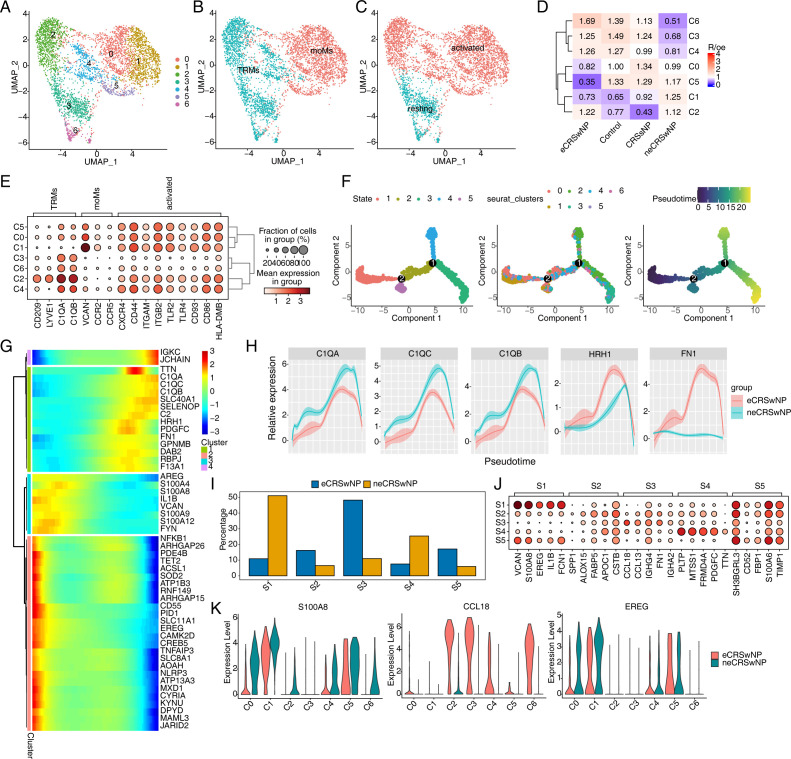
Results: Cluster analysis based on differential gene expression delineated 14 cell clusters. The eCRSwNP group exhibited a markedly higher prevalence of glandular cells and a notable reduction in fibroblasts, myoepithelial cells, and secretory cells compared to patients with neCRSwNP. Functional enrichment analysis of differentially expressed genes revealed the activation of pathways such as IL2-STAT5 signaling and the inhibition of apoptotic pathways in eCRSwNP compared to neCRSwNP. Significant differences in the metabolic profiles of epithelial cell subpopulations were observed between eCRSwNP and neCRSwNP. Furthermore, there were notable discrepancies in the numbers and functionality of immune cells between eCRSwNP and neCRSwNP. The CD4+Th2 cell subsets were found to be significantly enriched in eCRSwNP. The highest number of cellular communications from type 2 conventional dendritic cells (cDC2) to CD4+Th2 cells was found in CRSwNP, where the ICAM1-CD226 pathway from cDC2 to CD4+Th2 was significantly upregulated in eCRSwNP. In addition, eCRSwNP was mainly infiltrated with tissue-resident macrophages, whereas neCRSwNP was mainly infiltrated with monocyte-derived macrophages.
Conclusions: Our study provides new insights into the heterogeneity, molecular mechanisms, and biomarkers of CRSwNP, contributing to improved diagnostic and therapeutic options for this condition.
Copyright: © 2025 Jin et al. This is an open access article distributed under the terms of the Creative Commons Attribution License, which permits unrestricted use, distribution, and reproduction in any medium, provided the original author and source are credited.
Conflict of interest statement
The authors have declared that no competing interests exist.
Figures
Similar articles
-
Activation of pyroptosis impairs basal cell differentiation in the nasal epithelium in chronic rhinosinusitis with nasal polyps.Mol Med Rep. 2025 Aug;32(2):229. doi: 10.3892/mmr.2025.13594. Epub 2025 Jun 13. Mol Med Rep. 2025. PMID: 40511559 Free PMC article.
-
[Initial exploration of non-invasive diagnosis of eosinophilic chronic rhinosinusitis with nasal polyps via nasal brush sampling].Lin Chuang Er Bi Yan Hou Tou Jing Wai Ke Za Zhi. 2025 Jul;39(7):617-623. doi: 10.13201/j.issn.2096-7993.2025.07.004. Lin Chuang Er Bi Yan Hou Tou Jing Wai Ke Za Zhi. 2025. PMID: 40555486 Chinese.
-
GLUT1 Promotes Squamous Metaplasia in Eosinophilic Chronic Rhinosinusitis with Nasal Polyps.Am J Rhinol Allergy. 2025 Sep;39(5):353-363. doi: 10.1177/19458924251342999. Epub 2025 May 19. Am J Rhinol Allergy. 2025. PMID: 40388707
-
Systemic and topical antibiotics for chronic rhinosinusitis.Cochrane Database Syst Rev. 2016 Apr 26;4(4):CD011994. doi: 10.1002/14651858.CD011994.pub2. Cochrane Database Syst Rev. 2016. PMID: 27113482 Free PMC article.
-
Intranasal steroids versus placebo or no intervention for chronic rhinosinusitis.Cochrane Database Syst Rev. 2016 Apr 26;4(4):CD011996. doi: 10.1002/14651858.CD011996.pub2. Cochrane Database Syst Rev. 2016. PMID: 27115217 Free PMC article.
References
-
- Fokkens WJ, Lund VJ, Hopkins C, Hellings PW, Kern R, Reitsma S, et al. European Position Paper on Rhinosinusitis and Nasal Polyps 2020. Rhinology. 2020;58(Suppl S29):1–464. - PubMed
-
- Orlandi RR, Kingdom TT, Smith TL, Bleier B, DeConde A, Luong AU, et al. International consensus statement on allergy and rhinology: rhinosinusitis 2021. Int Forum Allergy Rhinol. 2021;11(3):213–739. - PubMed
MeSH terms
LinkOut - more resources
Full Text Sources
Medical
Research Materials
Miscellaneous
