. 2025 Jul 28;19(7):e0013325.
doi: 10.1371/journal.pntd.0013325. eCollection 2025 Jul.

Assessing the spatio-temporal risk of Aedes-borne arboviral diseases in non-endemic regions: The case of Northern Spain

Affiliations

Assessing the spatio-temporal risk of Aedes-borne arboviral diseases in non-endemic regions: The case of Northern Spain

Bruno V Guerrero et al. PLoS Negl Trop Dis. .

Abstract

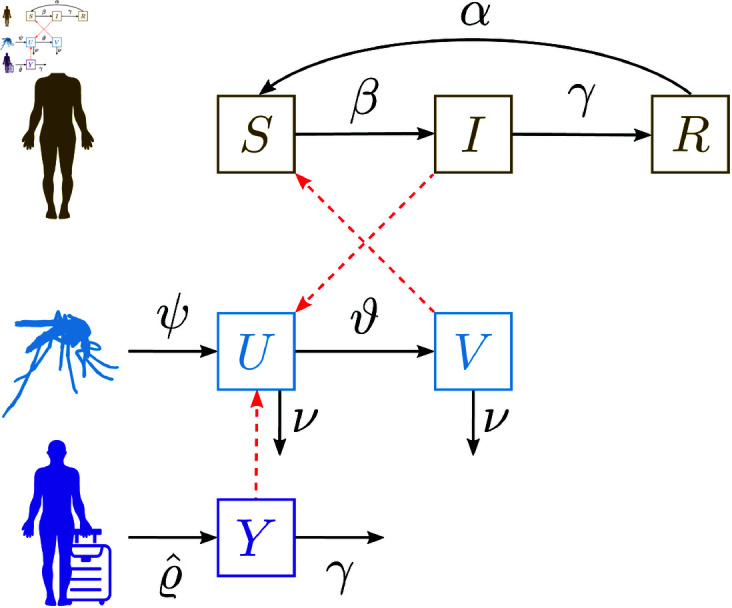
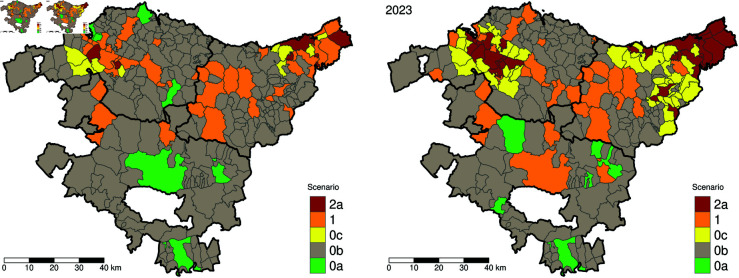
Arboviral diseases represent a growing global health challenge. While dengue cases surge in endemic regions, non-endemic areas in southern Europe are seeing a rise in imported cases of dengue, Zika, and chikungunya, along with the first autochthonous dengue transmissions. The expanding Aedes mosquito populations, influenced by climate change, and increased international travel introducing viremic cases further elevate the risk of outbreaks. These trends emphasize the urgent need for effective risk assessment and timely intervention strategies. We present a data-driven methodology to assess the spatio-temporal risk of Aedes-borne arboviral diseases in non-endemic settings, addressing key limitations of models developed primarily for endemic regions and challenges related to limited data availability. Our approach builds on the SIRUVY human-vector compartmental model and incorporates stochastic formulations to capture variability in imported cases and mosquito density - two critical drivers of autochthonous transmission and outbreak emergence. This framework improves risk estimation and offers insights into transmission dynamics in regions where outbreaks are rare and unpredictable, shaped by sporadic case importations and a non-persistent vector presence. Using data from the Basque Country (2019-2023), including Aedes mosquito egg counts as a proxy for vector abundance and records of imported cases, we mapped the monthly risk of local transmission at the municipal level and conducted a scenario-based risk assessment aligned with Spain's entomological classification. Our findings indicate a growing presence of Aedes mosquitoes and an increasing transmission risk in urban and peri-urban areas of the Basque Country, revealing shifting hotspots of possible arboviral disease transmission. These results highlight the importance of sustained surveillance to identify high-risk locations and prioritize targeted public health interventions to prevent potential outbreaks.


Conflict of interest statement

The authors have declared that no competing interests exist.

Figures

Fig 1
Fig 1. Empirical data from the Basque Country used in this study.
Imported cases of mosquito-borne diseases (dengue, Zika, or chikungunya) and egg counts from mosquito ovitraps (Aedes albopictus and Aedes japonicus). In panel (a), the monthly time series of reported cases by province is shown. Panel (b) presents the average egg counts per ovitrap stick. The light purple-highlighted period corresponds to the COVID-19 lockdown, during which the number of imported cases was significantly reduced. Maps in panels (c) and (d) illustrate data aggregated by municipality for August 2022 and October 2023, the months with the highest recorded epidemiological activity. These maps focus on municipalities with reported imported cases or where vector surveillance was conducted. Ovitrap locations are marked with squares, with color indicating the highest egg count at each site. Gray areas represent municipalities with no reported cases, and gray triangles indicate ovitraps with negative results. Thicker lines represent the administrative boundaries of the Basque Country’s provinces: Gipuzkoa (Northeast), Bizkaia (Northwest), and Araba (South). Monthly maps for 2019, 2022 and 2023 are available in S1 Fig. Base map layer from the Basque Government (Eusko Jaurlaritza / Gobierno Vasco) resource https://www.euskadi.eus/limites-administrativos-del-pais-vasco/web01-ejeduki/es/, under CC BY 4.0 https://creativecommons.org/licenses/by/4.0/.
Fig 2
Fig 2. Flow diagram for the SIRUVY model.
Colors represent different compartment classes and transitions: brown for local transmission in human hosts (susceptible, infected, and recovered), cyan for uninfected and infected disease vectors, and violet for the influx of confirmed imported human cases Y. Red dashed arrows indicate pathogen transmission pathways, while black arrows represent the flow of individuals between compartments, with the corresponding flow rates denoted by Greek letters. Icons were sourced from https://www.svgrepo.com/svg/76394/standing-human-body-silhouette, https://www.svgrepo.com/svg/95482/mosquito, https://www.svgrepo.com/svg/490438/travel-luggage, all under CC0/Public Domain license https://www.svgrepo.com/page/licensing/.
Fig 3
Fig 3. Disease dynamics in non-endemic settings as a function of relative mosquito abundance k, with Y=0.1.
Stochastic realizations (purple) are compared with the corresponding deterministic ODE solution (green). (a) At low k, small clusters may form despite I1. (b) At high k (and I0 = 10), outbreaks can re-emerge after seeming extinction (see magenta oval). (c) In absence of initial imported cases, index cases trigger medium-to-large outbreaks, occurring earlier or later than predicted by the deterministic solution. (d–f) Near the critical value (kc = 0.694), I(t) at the initial stage: for k<kc, it quickly stabilizes at its stationary value; when kkc, it grows linearly with time; and for k>kc, it exhibits exponential growth.
Fig 4
Fig 4. Risk estimation of the expected number of autochthonous cases at the municipal level, based on the SIRUVY model.
Risk is computed using the formulas from Table 2. Only points that deviate from the provincial estimate are shown, with horizontal lines representing the annual baseline level for each province. Colors indicate the corresponding province, and the top four highest-risk municipalities each year are labeled. The period highlighted in light purple corresponds to the COVID-19 lockdown period.
Fig 5
Fig 5. Maps for August 2022 showing relative mosquito abundance k (blue), expected number of imported viremic cases Y (purple), and the resulting risk map (red).
Data are aggregated at the municipal and monthly level; where data is missing, provincial and yearly averages are used to fill gaps. Monthly maps of relative Aedes mosquito abundance and expected imported viremic cases at the municipal level in the Basque Country for 2019, 2022, and 2023 are available in S2 Fig and S3 Fig. Base map layer from the Basque Government (Eusko Jaurlaritza / Gobierno Vasco) resource https://www.euskadi.eus/limites-administrativos-del-pais-vasco/web01-ejeduki/es/, under CC BY 4.0 https://creativecommons.org/licenses/by/4.0/.
Fig 6
Fig 6. Risk maps at the municipal level for the warm seasons of 2019, 2022, and 2023.
A consistent color scale is applied across all maps to facilitate comparison. Base map layer from the Basque Government (Eusko Jaurlaritza / Gobierno Vasco) resource https://www.euskadi.eus/limites-administrativos-del-pais-vasco/web01-ejeduki/es/, under CC BY 4.0 https://creativecommons.org/licenses/by/4.0/.
Fig 7
Fig 7. Scenario-based risk maps for 2022 and 2023, based on the entomological classification proposed by the Spanish Ministry of Public Health (Table 5), considering Aedes species in general, including Aedes albopictus and Aedes japonicus.
The map for 2019 is available in the S5 Fig. Categories 2b and 2c were excluded as they do not apply to a non-endemic setting without autochthonous cases. Base map layer from the Basque Government (Eusko Jaurlaritza / Gobierno Vasco) resource https://www.euskadi.eus/limites-administrativos-del-pais-vasco/web01-ejeduki/es/, under CC BY 4.0 https://creativecommons.org/licenses/by/4.0/.
Fig 8
Fig 8. Alternative scenario-based maps for each proposed classification.
Monthly scenario A-, B-, and C-based Aedes-borne disease risk maps in the Basque Country, based on the entomological classification proposed by the Spanish Ministry of Public Health for August 2023. Maps for the remaining months and years are available in S6 Fig, S7 Fig, and S8 Fig. Base map layer from the Basque Government (Eusko Jaurlaritza / Gobierno Vasco) resource https://www.euskadi.eus/limites-administrativos-del-pais-vasco/web01-ejeduki/es/, under CC BY 4.0 https://creativecommons.org/licenses/by/4.0/.

Similar articles

References

    1. Semenza JC, Lindgren E, Balkanyi L, Espinosa L, Almqvist MS, Penttinen P, et al. Determinants and drivers of infectious disease threat events in Europe. Emerg Infect Dis. 2016;22(4):581–9. doi: 10.3201/eid2204.151073 - DOI - PMC - PubMed
    1. Metcalf CJE, Walter KS, Wesolowski A, Buckee CO, Shevliakova E, Tatem AJ, et al. Identifying climate drivers of infectious disease dynamics: recent advances and challenges ahead. Proc Biol Sci. 2017;284(1860):20170901. doi: 10.1098/rspb.2017.0901 - DOI - PMC - PubMed
    1. Rocklöv J, Dubrow R. Climate change: an enduring challenge for vector-borne disease prevention and control. Nat Immunol. 2020;21(5):479–83. doi: 10.1038/s41590-020-0648-y - DOI - PMC - PubMed
    1. Watts N, Amann M, Arnell N, Ayeb-Karlsson S, Beagley J, Belesova K, et al. The 2020 report of The Lancet Countdown on health and climate change: responding to converging crises. Lancet. 2021;397(10269):129–70. doi: 10.1016/S0140-6736(20)32290-X - DOI - PMC - PubMed
    1. Paz S. Climate change: a driver of increasing vector-borne disease transmission in non-endemic areas. PLoS Med. 2024;21(4):e1004382. doi: 10.1371/journal.pmed.1004382 - DOI - PMC - PubMed

MeSH terms

LinkOut - more resources