. 2025 Jul 28;21(7):e1012779.
doi: 10.1371/journal.ppat.1012779. eCollection 2025 Jul.

The plasmepsin-piperaquine paradox persists in Plasmodium falciparum

Affiliations

The plasmepsin-piperaquine paradox persists in Plasmodium falciparum

Breanna Walsh et al. PLoS Pathog. .

Abstract

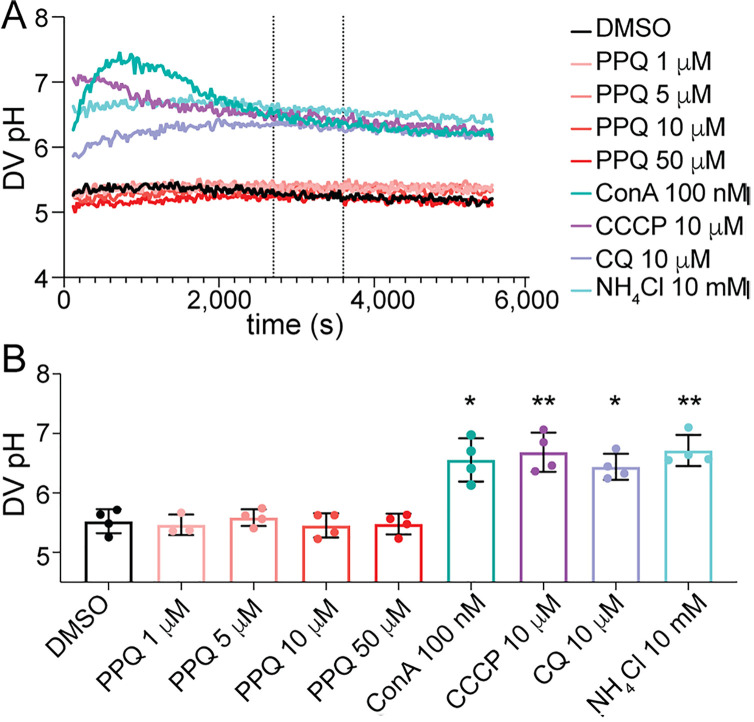
Malaria remains a pressing global health challenge, with rising drug resistance threatening current treatment strategies. Partial resistance to dihydroartemisinin-piperaquine (DHA-PPQ) has emerged in Southeast Asia, particularly in Plasmodium falciparum strains from Cambodia. While artemisinin partial resistance is associated with mutations in kelch13, reduced PPQ sensitivity has been linked to increased copy numbers of the aspartic protease genes plasmepsin II and III and mutations in the chloroquine resistance transporter. In this study, we demonstrate the effective use of CRISPR-Cas9 technology to generate single knockouts (KO) of plasmepsin II and plasmepsin III, as well as a double KO of both genes, in two isogenic Cambodian parasites with varying numbers of plasmepsin gene copies. The deletion of plasmepsin II and/or III increased parasite sensitivity to PPQ. We explored several hypotheses to understand how an increased plasmepsin gene copy number might influence parasite survival under high PPQ pressure. Our findings indicate that protease inhibitors have a minimal impact on parasite susceptibility to PPQ. Additionally, parasites with higher plasmepsin gene copy numbers did not exhibit significantly increased hemoglobin digestion, differences in peptide composition, nor did they produce different amounts of free heme following PPQ treatment compared to wildtype (single copy) parasites. Interestingly, hemoglobin digestion was slowed in parasites with plasmepsin II deletions. We also found that culturing parasites with different plasmepsin II and III copies in amino acid-limited media had little impact on parasite sensitivity to high-dose PPQ. By treating parasites with modulators of digestive vacuole (DV) homeostasis, we found that changes in DV pH potentially affect their response to PPQ. Our research highlights the crucial role of increased plasmepsin II and III gene copy numbers in modulating response to PPQ and begins to uncover the molecular and physiological mechanisms underlying the contribution of plasmepsin II and III amplification to PPQ resistance in Cambodian parasites.


Conflict of interest statement

The authors have declared that no competing interests exist.

Figures

Fig 1
Fig 1. Correct disruption of the duplicated plasmepsin locus by KO constructs.
(A) Schema of the single and duplicated plasmepsin loci predicted by Amato et al. [16]. (B) Schema of duplicated locus, edited loci and homology plasmids used for integration into the locus. Restriction enzyme sites and expected band sizes for Southern blots are indicated in the schema. gDNA was digested [AflII (A) and NciI (N)], run on a gel, transferred to a membrane, and hybridized with three different probes indicated by colored bars (orange: plasmepsin II, blue: plasmepsin III, and purple: hdhfr cassette). Arrows indicate expected band sizes. Southern blots for additional clones and the single locus parasites (KH001_053G10) are shown in S1–S3 Figs.
Fig 2
Fig 2. Disruption of plasmepsin loci leads to loss of AUC.
Parasites were exposed to increasing levels of PPQ for 84 h and survival was measured by increased DNA content. Shown is an example of three biologically independent experiments run in triplicate for the KH001_053G8 parental locus (A) and parasites with disruption of either plasmepsin II (G8PM II_KO, B), plasmepsin III (G8PM III_KO, C), or a double KO of plasmepsin II/III (G8PM II/III_KO, D). The areas under the curve (AUC) between the local minima were calculated and the average and SD are shown in for KH00_053G10 and KH001_053G8 parents as well as KOs (E). Statistics show one-way ANOVA with Tukey post-test: *p < 0.05; **p < 0.01; ***p < 0.001; ****p < 0.0001. Standard EC50 values for the PPQ partner drug DHA (F) and three PPQ analogs (mefloquine (G), chloroquine (H), and amodiaquine (I)) are shown as the average and SD for at least three biological replicates run in triplicate. The two parental lines and their relative plasmepsin KO lines are shown. No statistically significant differences were detected between the lines.
Fig 3
Fig 3. Heme fractionation of PPQ-treated and untreated parasites with variable plasmepsin copy numbers.
Different heme species were extracted from parasites by subsequent cellular fractionation steps. (A-C): Tightly synchronized KH001_053G10 (grey) and KH001_053G8 (black) ring stage parasites were exposed to various PPQ concentrations for 32 h. Average and SD of percentage of hemozoin Fe (A), hemoglobin (B), and free heme Fe (C) are shown for three independent experiments run in quadruplicate. Statistical comparisons of the drug-treated lines to their untreated controls were performed using two-tailed unpaired Student’s t-tests *p < 0.05; **p < 0.01. (D-F): KH001_053G10 and KH001_053G8 parental lines as well as G8PMII_KO, G8PMIII_KO, and G8PMII/III_KO were incubated with 2 μM PPQ from 24 to 36 h post-synchronization and harvested at 36 h. Statistical comparisons of treated to untreated parasites at the 36 h timepoint from three independent biological replicates were performed using two-tailed unpaired Student’s t-tests *p < 0.05; **p < 0.01; ***p < 0.001.
Fig 4
Fig 4. Plasmepsin KO parasites have slowed hemoglobin metabolism.
Tightly synchronized parasites were harvested at different time-points throughout the life cycle. The average and SD of percentage of hemozoin Fe (A), hemoglobin (B), and free heme Fe (C) are shown for three independent experiments for parasites with a single plasmepsin locus (KH001_053G10, grey), duplicated plasmepsin locus (KH001_053G8, black), G8PMII_KO (orange), G8PMIII_KO (blue), or G8PMII/III_KO (red). Statistical comparisons at each time point were performed between the single copy KH001_053G10 line and all other lines using two-tailed unpaired Student’s t-tests *p < 0.05; **p < 0.01. (D) Cell cycle progression was measured by the number of nuclei present per cell using flow cytometry and SYBRGreen staining of DNA. Parasites were defined as trophozoites when they had at least three nuclei and had started DNA replication. Shown is the percentage of trophozoites at each time point (24 h, 36 h and 42 h post-invasion). Statistical comparisons were performed between the single copy KH001_053G10 line and all other lines at the same time point using two-tailed unpaired Student’s t-tests *p < 0.05; ***p < 0.001; ****p < 0.0001.
Fig 5
Fig 5. Low amino acid conditions do not markedly impact the PPQ resistance phenotype.
Parasites were exposed to increasing levels of PPQ in regular (dots and solid lines) or amino acid-limited media (circles and dotted lines) for 84 h and survival was measured by increased DNA content. Shown is an example of at least four biologically independent experiments run in triplicate for the single copy plasmepsin clone KH001_053G10 (A), the duplicated plasmepsin locus clone KH001_053G8 (B), the double KO of plasmepsin II/III (G8PMII/III_KO, C), and the multicopy plasmepsin locus clone KH004_057 (D). The area under the curve (AUC) between the local minima was calculated and the average and SD is shown in (E). Statistics show two-way ANOVA with Šidák correction: *p < 0.05; **p < 0.01; ***p < 0.001; ns: not significant.
Fig 6
Fig 6. Effect of pH on PPQ AUC.
A-D: Parasites were exposed to increasing levels of PPQ for 84 h in acidic (pH = 6.74), normal (pH = 7.5) or basic (pH = 8.24) media. Shown is an example of three biologically independent experiments run in triplicate for KH001_053G10 (A), KH001_053G8 (B) or KH004_057 (C), as well as the average and SD of the AUC for all three biological replicates (D). There were no statistically significant differences detected. (E-L): Parasites were exposed to increasing levels of PPQ in the presence of DMSO or E-H) CCCP at either 5 μM or 15 μM concentrations or I-L) concanamycin A (ConA) at either 0.1 nM or 0.2 nM. Shown is one example of three biologically independent experiments run in triplicate for KH001_53G10 (E, I), KH001_53G8 (F, J), and KH004_057 (G, K). The area under the curve (AUC) between the local minima was calculated and the average and SD are shown for CCCP (H) and ConA (L). Statistical comparisons of the drug-treated lines and DMSO-treated controls were performed using one-way ANOVA with Dunnett’s post-test: *p < 0.05 and **p < 0.01.
Fig 7
Fig 7. Digestive vacuole pH remains unchanged with exposure to various concentrations of PPQ.
(A) DV pH traces of Dd2 parasites exposed to PPQ and control treatments of concanamycin A (ConA, 100 nM), CCCP (10 µM), CQ (10 µM) and NH4Cl (10 mM). Shown are the averaged results of internal technical duplicates from a representative experiment. DV pH was quantified for each treatment as an average of the measurements taken between 45 and 60 mins of compound exposure (dashed vertical lines), (B) average DV pH measurements following 45 to 60 mins of exposure to PPQ at 1, 5, 10 or 50 µM and to known DV pH modulators ConA, CQ, CCCP and NH4Cl. The data are the average and SD of three to four independent experiments (performed with blood from different donors). The asterisks denote a significant difference from the DMSO solvent control: *p <0.05; **p <0.01, (one-way ANOVA). Raw data are provided in S10 Table.

References

    1. Organization WH. World malaria report 2023. 2023.
    1. van der Pluijm RW, Imwong M, Chau NH, Hoa NT, Thuy-Nhien NT, Thanh NV, et al. Determinants of dihydroartemisinin-piperaquine treatment failure in Plasmodium falciparum malaria in Cambodia, Thailand, and Vietnam: a prospective clinical, pharmacological, and genetic study. Lancet Infect Dis. 2019. Epub 2019 Jul 28. 10.1016/s1473-3099(19)30391-3 - DOI - PMC - PubMed
    1. Leang R, Barrette A, Bouth DM, Menard D, Abdur R, Duong S, et al. Efficacy of dihydroartemisinin-piperaquine for treatment of uncomplicated Plasmodium falciparum and Plasmodium vivax in Cambodia, 2008 to 2010. Antimicrob Agents Chemother. 2013;57(2):818–26. doi: 10.1128/AAC.00686-12 - DOI - PMC - PubMed
    1. Leang R, Taylor WRJ, Bouth DM, Song L, Tarning J, Char MC, et al. Evidence of Plasmodium falciparum malaria multidrug resistance to artemisinin and piperaquine in Western Cambodia: Dihydroartemisinin-piperaquine open-label multicenter clinical assessment. Antimicrob Agents Chemother. 2015;59(8):4719–26. doi: 10.1128/AAC.00835-15 - DOI - PMC - PubMed
    1. Duru V, Khim N, Leang R, Kim S, Domergue A, Kloeung N, et al. Plasmodium falciparum dihydroartemisinin-piperaquine failures in Cambodia are associated with mutant K13 parasites presenting high survival rates in novel piperaquine in vitro assays: retrospective and prospective investigations. BMC Med. 2015;13:305. doi: 10.1186/s12916-015-0539-5 - DOI - PMC - PubMed

MeSH terms

LinkOut - more resources