. 2025 Jul 28;21(7):e1013381.
doi: 10.1371/journal.ppat.1013381. eCollection 2025 Jul.

Splicing-dependent restriction of the HBZ gene by Tax underlies biphasic HTLV-1 infection

Affiliations

Splicing-dependent restriction of the HBZ gene by Tax underlies biphasic HTLV-1 infection

Yi Liang et al. PLoS Pathog. .

Abstract

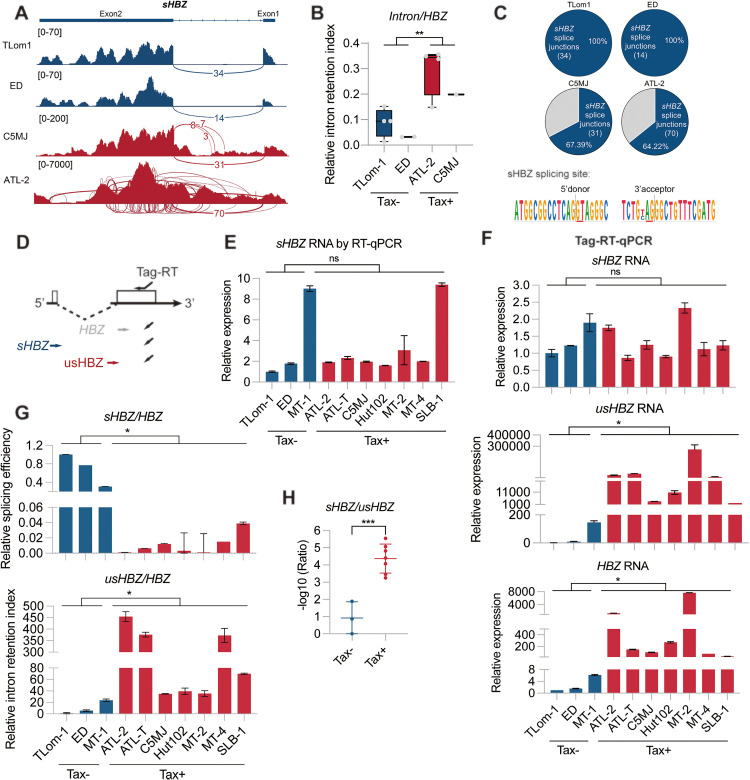
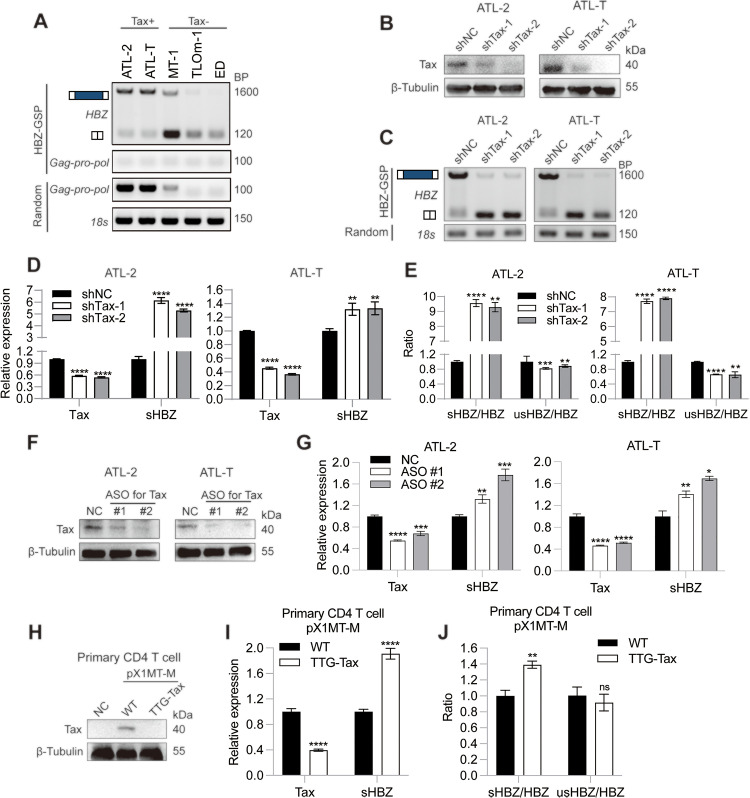
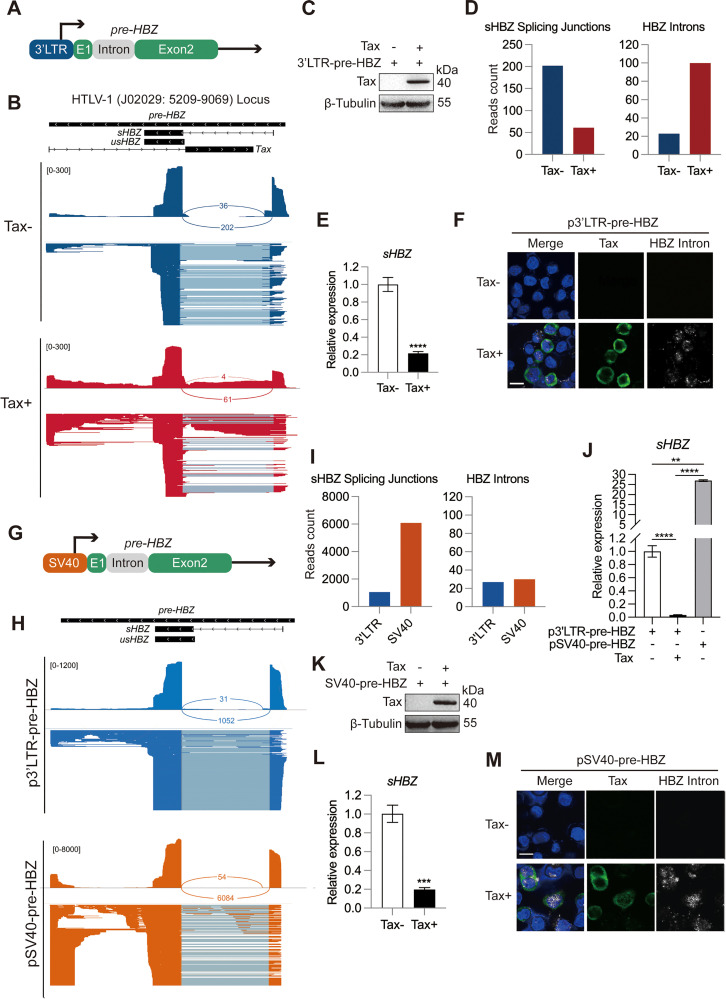
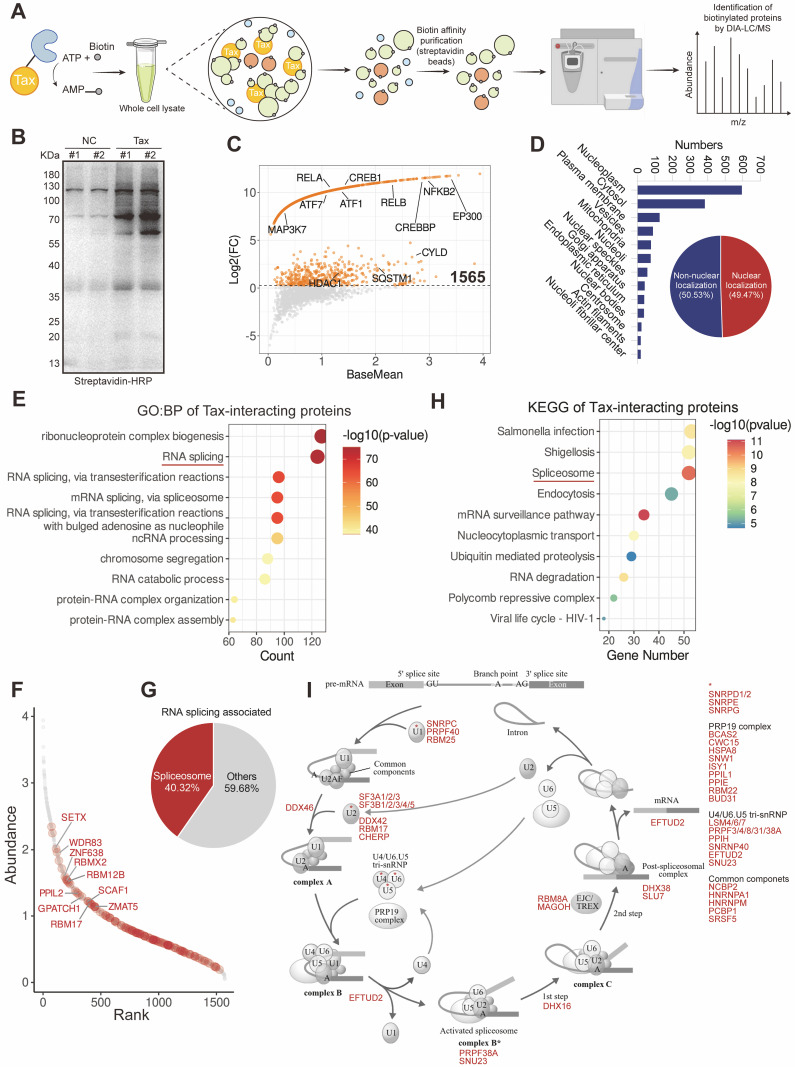
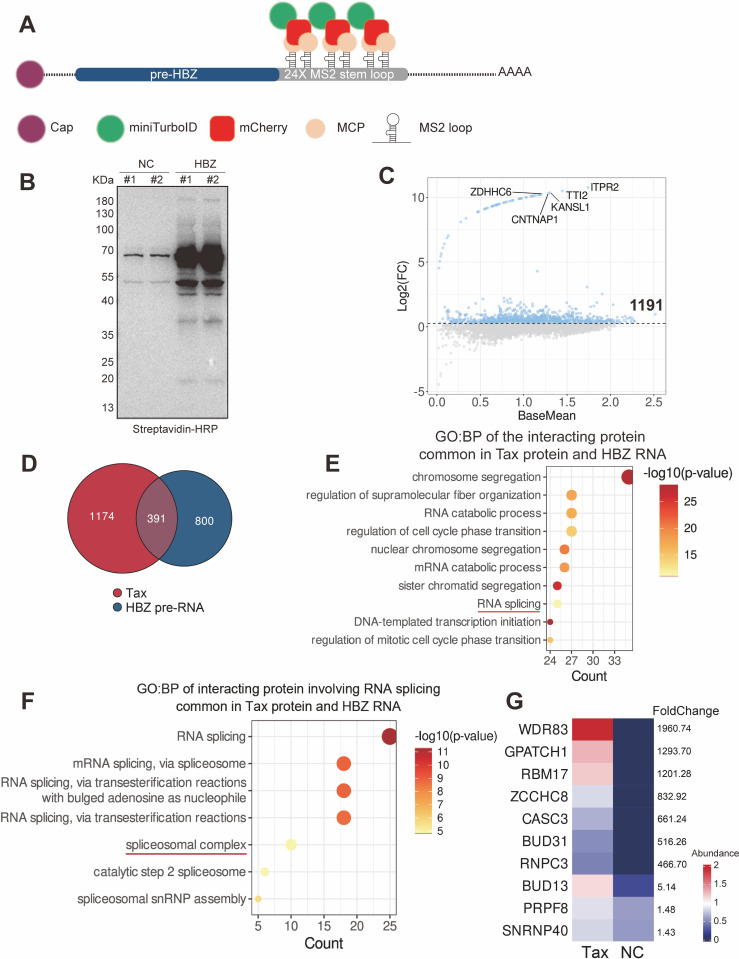
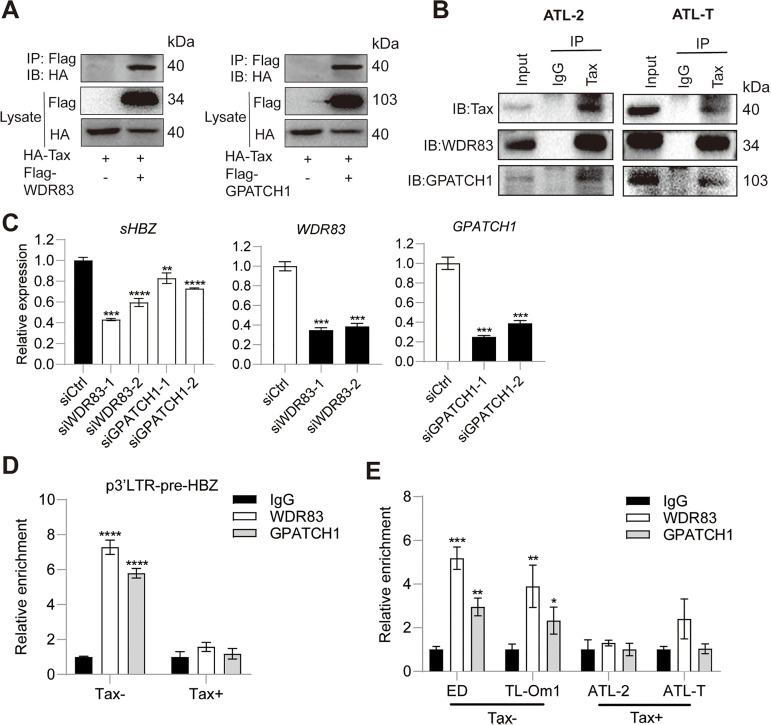
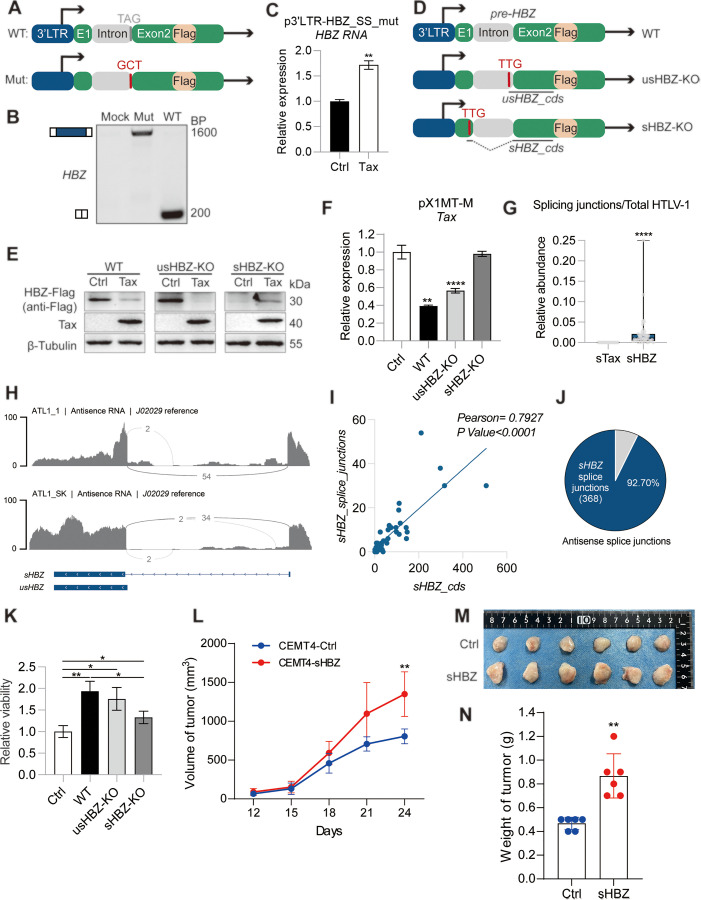
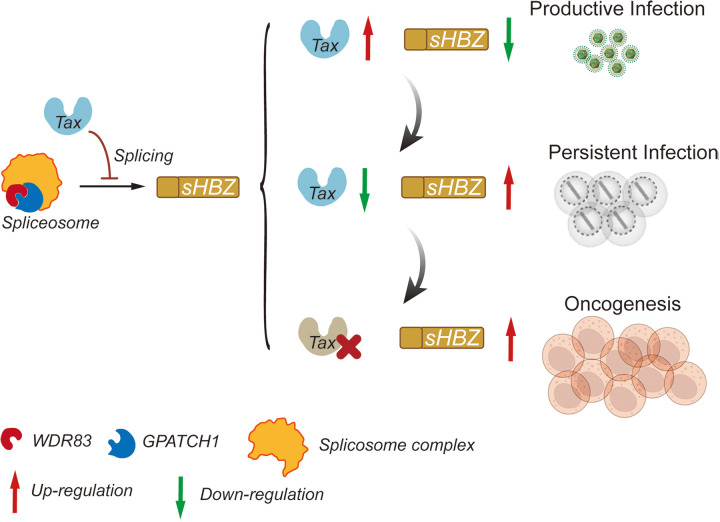
HTLV-1 is an oncovirus that encodes a transactivator Tax and a regulatory gene HBZ. HTLV-1 early or infectious replication depends on Tax; during HTLV-1 late infection, HBZ plays a crucial role in driving the proliferation of infected cells and maintaining viral persistence. The biphasic replication pattern of HTLV-1 dictated by Tax and HBZ represents a result of viral host adaptation, but how HTLV-1 coordinates Tax and HBZ expression to facilitate early and late infection remains elusive. Here we reveal that HBZ RNA splicing exhibits distinct patterns in Tax+ and Tax- HTLV-1 infected cells. We demonstrate that Tax interacts with the host spliceosome and inhibits HBZ splicing by competitively binding splicing factors including WDR83 and GPATCH1. As a result, Tax confers a natural constraint on HBZ, counterbalancing its anti-replication effect at HTLV-1 early infection, while unleashing HBZ to drive HTLV-1 mitotic propagation during late infection. The splicing-dependent restriction of HBZ by Tax thus represents a critical interplay central to HTLV-1 persistence.


Conflict of interest statement

The authors have declared that no competing interests exist.

Figures

Fig 1
Fig 1. HBZ exhibits distinct splicing patterns in Tax + and Tax- HTLV-1 infected cells.
(A) Sashimi plot of mapped HBZ RNA reads in representative HTLV-1 infected T cell lines, including Tax-negative TL-Om1 and ED, and Tax-positive C5MJ and ATL-2. RNA-seq data were obtained from the ENA database (https://www.ebi.ac.uk/ena). Sample accession IDs are included in S6 Table. (B) The relative HBZ intron retention index in HTLV-1 infected T cells, calculated by normalizing the number of HBZ intron reads to total HBZ reads. (C) (Upper) Pie chart showing the percentages of sHBZ splice junctions (SJ) and others in total HBZ SJs. (Bottom) The Logo plot indicates the sHBZ splice site is conserved in 134 HTLV-1 strains. (D) Schematic diagram of locations of primers for Tag-RT-qPCR. (E) Relative expression of sHBZ in HTLV-1 infected T cells assessed by RT-qPCR. ACTB was used as the internal control for normalization. (F) Relative expression of (Upper) sHBZ, (Middle) usHBZ, and (Bottom) HBZ in HTLV-1 infected T cells assessed by Tag-RT-qPCR. ACTB was used as the internal control for normalization. (G) (Upper) Relative splicing efficiency (sHBZ/HBZ) and (Bottom) relative intron retention index (usHBZ/HBZ) of HBZ in HTLV-1 infected T cells. (H) Ratio of relative expression of sHBZ to usHBZ in Tax- (Blue) and Tax+ (Red) HTLV-1-infected T cells. P value was calculated using a two-tailed Student’s t-test. ns, not significant; *P < 0.05, **P < 0.01, ***P < 0.001. The results are representatives of two independent experiments.
Fig 2
Fig 2. Endogenous Tax suppresses HBZ RNA splicing in HTLV-1 infected cells.
(A) RT-PCR of target genes from the HBZ-gene specific primer (GSP) library and random primer library in HTLV-1 infected T cells. (B) Immunoblot result verifying the shRNA-mediated knockdown of Tax in ATL-2 and ATL-T. (C) RT-PCR analysis of HBZ RNA splicing following shRNA-mediated knockdown of Tax. (D) qPCR analysis of Tax and sHBZ expression levels following shRNA-mediated knockdown of Tax. (E) Tag-RT-qPCR analysis of the ratios of sHBZ/HBZ and usHBZ/HBZ following shRNA-mediated knockdown of Tax. (F) Immunoblot result verifying the ASO-mediated knockdown of Tax. (G) qPCR analysis of Tax and sHBZ expression levels following ASO-mediated knockdown of Tax. (H) Immunoblot analysis of Tax protein expression in primary CD4 T cells de novo infected with HTLV-1 infectious clones pX1MT-M-WT or pX1MT-M-TTG-Tax. (I) qPCR analysis of Tax and sHBZ expression levels in infected primary CD4 T cells. (J) Tag-RT-qPCR analysis of the ratios of sHBZ/HBZ and usHBZ/HBZ in infected primary CD4 T cells. P value was calculated using a two-tailed unpaired Student’s t-test. ns, not significant; *P < 0.05, **P < 0.01, ***P < 0.001, ****P < 0.0001. The results are representatives of three independent experiments.
Fig 3
Fig 3. Tax directly inhibits HBZ RNA splicing in a transactivation-independent manner.
(A) Schematic diagram of the plasmid p3’LTR-pre-HBZ. (B) Sashimi plot of HBZ expressed by p3’LTR-pre-HBZ in HeLa S3 cells under Tax- or Tax+ conditions, generated by ONT cDNA-seq. (C) Immunoblot result showing the expression of Tax. (D) Bar chart statistics of (Left) sHBZ SJs and (Right) HBZ introns reads in (B). (E) qPCR result showing relative abundance of sHBZ expressed by p3’LTR-pre-HBZ, in the presence or absence of Tax. (F) RNA-FISH result showing the expression of Tax (green) and HBZ intron (white). Scale bar, 10 μm. (G) Diagram of the plasmid composition of pSV40-pre-HBZ. (H) Examination of the effect of SV40 promoter on HBZ pre-RNA splicing using ONT cDNA-seq. For (B) and (H), the upward alignment represents the coverage and splicing junctions, while the downward alignment shows the distribution of reads. (I) Bar chart statistics of (Left) sHBZ SJs and (Right) HBZ introns reads in (H). (J) qPCR analysis of the relative levels of sHBZ expressed by HBZ pre-RNA in different experimental settings. (K) Immunoblot result showing Tax expression. (L) qPCR analysis of the effect of Tax on sHBZ expression in SV40-pre-HBZ. (M) RNA-FISH images showing the expression levels of Tax and HBZ intron (scale bar, 10 μm). P value was calculated using a two-tailed unpaired Student’s t-test. **P < 0.01, ***P < 0.001, ****P < 0.0001. The results are representatives of three independent experiments.
Fig 4
Fig 4. Proximity labelling identifies HTLV-1 Tax interacts with the host spliceosome.
(A) Schematic depicting the miniTurboID workflow for identifying Tax interacting proteins. The diagram was drawn by hand using Adobe Illustrator (https://www.adobe.com/products/illustrator.html). (B) Immunoblot analysis demonstrating the biotinylated proteins pulled down from the samples. (C) Scatter plots showing the fold change (FC) (log2-FC) and signal intensity (BaseMean) of proximity-labeled proteins, with a FC greater than 1.2 considered positive interaction. Known Tax-interacting proteins are marked. n = 2 biological replicates for Tax-miniTurboID and NC-miniTurboID samples. The scores of proteins that were not detected in the NC group (hence 0) were set to 0.001 to facilitate FC calculation. The proteins concentrated in the upper curve in the figure represent those with high specificity for binding to Tax. (D) The subcellular localization of Tax-interacting proteins in the Cell Atlas database [47] (https://www.proteinatlas.org/). (Upper) The bar chart showing all subcellular localizations. (Bottom) The pie chart displaying the percentages of non-nuclear and nuclear proteins. (E) The top 10 entries for GO:BP enrichment analysis of Tax-interacting proteins. (F) Abundance ranking of Tax-interacting proteins, with red dots indicating RNA splicing-related proteins. The top 10 proteins based on FC are highlighted. (G) Pie chart displaying the proportion of spliceosome components among RNA splicing-related proteins in (E). (H) The top 10 entries for KEGG enrichment analysis of Tax-interacting proteins. (I) Tax interacting proteins (marked in red) are components of the spliceosome, as revealed by the KEGG spliceosome pathway (map03040).
Fig 5
Fig 5. Tax targets spliceosomal proteins that interact with HBZ pre-RNA.
(A) Diagram illustrating the principle of the RNA-bioID method [48]. (B) Immunoblot result demonstrating the biotinylated proteins pulled down from the samples. (C) Scatter plots showing the FC (log2-FC) and signal intensity (BaseMean) of proximity-labeled proteins. FC > 1.2 is considered positive (in blue). The names of top 5 proteins based on FC are marked. n = 2 biological replicates for HBZ pre-RNA and NC samples. The scores of proteins that were not detected in the NC group (hence 0) were set to 0.001 to facilitate FC calculation. The proteins concentrated in the upper curve in the figure represent those with high specificity for binding to HBZ RNA. (D) Intersection of Tax and HBZ pre-RNA interacting proteins. (E) Top 10 entries from the GO: BP enrichment analysis of the 391 intersected proteins. (F) GO: BP enrichment analysis of the common interacting proteins of Tax and HBZ pre-RNA enriched by the RNA splicing entry. (G) The abundance and FC of proteins in the spliceosomal complex shown in (F).
Fig 6
Fig 6. Tax impairs HBZ RNA splicing via binding WDR83 and GPATCH1.
(A) Co-IP results of HA-Tax with Flag-WDR83 or Flag-GPATCH1 in HeLa S3 cells. (B) Co-IP results of Tax with WDR83 or GPATCH1 at endogenous levels in ATL-2 and ATL-T. (C) qPCR analysis of the impact of WDR83 and GPATCH1 knockdown on sHBZ expressed by p3’LTR-pre-HBZ in HeLa S3. (D) RIP-qPCR result demonstrating Tax impairs the binding of WDR83 or GPATCH1 with HBZ RNA in HeLa S3. (E) RIP-qPCR analysis demonstrating impaired binding of WDR83 or GPATCH1 with HBZ RNA in Tax+ but not Tax- HTLV-1 infected T cells. P value was calculated using a two-tailed unpaired Student’s t-test. *P < 0.05, **P < 0.01, ***P < 0.001, ****P < 0.0001. The results are representatives of three independent experiments.
Fig 7
Fig 7. Tax mediated sHBZ restriction impacts HTLV-1 infection and persistence.
(A) Schematic diagrams of wild-type (WT) and the 3’ acceptor splice site mutant (Mut) of p3’LTR-pre-HBZ. (B) RT-PCR analysis demonstrates that HBZ RNA fails to undergo splicing following mutation of the 3’ splice site. (C) qPCR analysis indicates Tax enhances the transcription of HBZ RNA expressed by the p3’LTR-pre-HBZ 3’ acceptor splice site mutant. (D) Schematic diagrams of the p3’LTR-pre-HBZ-Flag plasmids with the native HBZ sequence (WT) or having usHBZ or sHBZ start codons mutated to TTG to knock out usHBZ or sHBZ protein, respectively. (E) Immunoblot result showing the effect of Tax on the expression of Flag-HBZ proteins. (F) qPCR analysis of the effect of WT, sHBZ-KO, or usHBZ-KO p3’LTR-pre-HBZ on the expression of Tax in HeLa S3 cells transfected with the HTLV-1 infectious clone pX1MT-M. (G) Relative abundances of sTax (spliced Tax) and sHBZ by normalizing respective splice junction reads to total HTLV-1 reads in ATL patients (PRJEB19394). (H) Sashimi plot of HBZ RNA of representative ATL patients. (I) The correlation between sHBZ CDS and splice junction reads in ATL patients analyzed using Pearson’s method. (J) sHBZ is the dominant isoform of HBZ in ATL patients. (K) Effects of WT, sHBZ-KO, or usHBZ-KO p3’LTR-pre-HBZ on the proliferation of CEMT4 cells. (L) Tumor growth curve of xenograft mice established by injecting CEMT lines stably expressing sHBZ or empty control. (M) Images of tumors derived from CEMT4-Ctrl or CEMT4-sHBZ injected xenograft mice, photographed by us. n = 6. (N) Tumor weights in (M). P value was calculated using a two-tailed Student’s t-test. *P < 0.05, **P < 0.01, ****P < 0.0001. The results (except xenograft) are representatives of three independent experiments.
Fig 8
Fig 8. A proposed model for HTLV-1 biphasic replication based on the splicing-dependent restriction of the HBZ gene by Tax.
The diagram was drawn by hand using Adobe Illustrator (https://www.adobe.com/products/illustrator.html).

Similar articles

References

    1. Mui UN, Haley CT, Tyring SK. Viral Oncology: Molecular Biology and Pathogenesis. J Clin Med. 2017;6(12):111. doi: 10.3390/jcm6120111 - DOI - PMC - PubMed
    1. Marusawa H, Uemoto S, Hijikata M, Ueda Y, Tanaka K, Shimotohno K, et al. Latent hepatitis B virus infection in healthy individuals with antibodies to hepatitis B core antigen. Hepatology. 2000;31(2):488–95. doi: 10.1002/hep.510310232 - DOI - PubMed
    1. Revill PA, Locarnini SA. New perspectives on the hepatitis B virus life cycle in the human liver. J Clin Invest. 2016;126(3):833–6. doi: 10.1172/JCI86650 - DOI - PMC - PubMed
    1. Indolfi G, Mangone G, Bartolini E, Moriondo M, Azzari C, Resti M. Hepatitis C viraemia after apparent spontaneous clearance in a vertically infected child. Lancet. 2016;387(10031):1967–8. doi: 10.1016/S0140-6736(16)00085-4 - DOI - PubMed
    1. Yu Y, Wang SE, Hayward GS. The KSHV immediate-early transcription factor RTA encodes ubiquitin E3 ligase activity that targets IRF7 for proteosome-mediated degradation. Immunity. 2005;22(1):59–70. doi: 10.1016/j.immuni.2004.11.011 - DOI - PubMed

MeSH terms

Substances