. 2025 Aug 5;122(31):e2410946122.
doi: 10.1073/pnas.2410946122. Epub 2025 Jul 28.

Translocations contribute to population rescue in an imperiled woodpecker

Affiliations

Translocations contribute to population rescue in an imperiled woodpecker

Alexander L Lewanski et al. Proc Natl Acad Sci U S A. .

Abstract

Anthropogenic destruction and fragmentation of habitat restrict many species to small, isolated populations, which often experience high extirpation risk. Restoring connectivity through translocations is one approach for mitigating the demographic and genetic perils faced by small populations. However, translocation interventions often lack substantial postrelease monitoring, and thus important information including the performance of translocated individuals, the long-term impacts on the recipient population, and the extent to which management objectives are fulfilled over time are often poorly known. Here, we examined the establishment dynamics and long-term outcomes of translocations from multiple donor populations into an intensively monitored population of the federally threatened red-cockaded woodpecker. We found evidence that translocations contributed to population growth and led to genetic admixture within the population. The translocated birds provided direct demographic benefits through high rates of establishment, breeding, and survival. We found that the survival and lifetime reproductive success of individuals were positively related to their amount of translocation ancestry, indicating that demographic benefits extended beyond the direct performances of the translocated birds. The translocations diversified the population's genetic composition with the ancestry of most individuals in the latter years of the study deriving from multiple translocation donor populations. We found marked heterogeneity in the genetic contributions of translocated individuals and cohorts, leading to disproportionate representation of certain lineages. Encouragingly, despite some accumulation of inbreeding during the study, the translocations thus far have not substantially contributed to inbreeding. Our findings illustrate in precise detail how translocations can be an effective approach for managing imperiled taxa.

Keywords: conservation; demographic rescue; pedigrees; translocations.


Conflict of interest statement

Competing interests statement:The authors declare no competing interest.

Figures

Fig. 1.
Fig. 1.
Establishment and reproductive activities of translocated birds. (A) Establishment outcomes for translocated birds organized by translocation year. The horizontal axis is year, and the vertical axis is diverging with counts of successfully established birds (i.e., recorded in at least one population census) above the horizontal axis and the birds that failed to establish shown below. (B) Network visualization of breeding pairs involving a translocated bird. Nodes represent individuals and are colored by source population (nontranslocated mates are shown in light gray). Edges indicate breeding pairs with thickness scaling with the number of fledglings produced across all nesting events involving the breeding pair. Dotted edges indicate breeding pairs that failed to produce fledglings. (C) Establishment outcomes of translocated birds organized by source population. The horizontal axis is diverging with the count of successful establishments shown on the left side of the vertical axis and failed establishments on the right. (D) Estimates with 95% CI of apparent survival for males and females that are translocated and nontranslocated with no translocation ancestry. (E) Lifetime reproductive success (total fledged offspring) of translocated vs. nontranslocated birds with no translocation ancestry. The points are the observed values, and gray distributions represent 500 expected values drawn from the posterior predictive distribution of a model examining differences in lifetime reproductive success between the translocated and nontranslocated birds. (F) Stacked barplot showing the total years that translocated birds were in the population. Each bird is represented by a bar and the color scheme matches panel B. Panel G is identical to panel F except that it shows the number of years that each translocated bird nested.
Fig. 2.
Fig. 2.
Summary of pedigree inbreeding (FP), expected ancestry, and number of individuals and potential breeding groups in the population. All plots involve a shared horizontal axis representing year. (A) Plot of expected inbreeding values of each year’s population. The light gray points are the inbreeding values of individuals. The larger, hollow points are the mean inbreeding values and are colored based on whether the mean inbreeding showed no change (dark gray), increased (magenta), or decreased (blue) from the previous year’s mean. The intervals represent the 10th and 90th percentiles of inbreeding values. (B) Barplots showing the number of potential breeding groups each year and whether they are composed of only translocated birds (only transloc.), only nontranslocated birds (no transloc.), or a combination of both (combined). (C) Barplots showing the proportion of ancestry that individuals are expected to inherit from each pedigree founder group (i.e., each translocation donor population and the nontranslocated founders). Each individual is represented as a thin, horizontal bar. The plot also indicates the total size of the population each year. The numbers above the bars indicate the year, cohort size, and donor population of translocation events. The legend to the plot’s right specifies the color corresponding to each pedigree founder group and also the proportion of founders in each group. The number next to each name indicates the count of individuals in that group. (D) Barplots showing the expected proportions of ancestry in the population (summarized across all individuals) from each pedigree founder group.
Fig. 3.
Fig. 3.
Estimated relationships between the proportion of ancestry that a locally hatched individual is expected to inherit from translocated individuals (translocation ancestry) and a series of fitness measures: apparent annual survival (A), total nesting years (B), and lifetime reproductive success (C). Each plot shows translocation ancestry along the horizontal axis and the fitness metric along the vertical axis. (A) The estimated apparent survival for each sex is shown as a line with the lighter bands representing the 95% CI. (B and C) In each plot, the bold, solid line shows the mean predicted relationship and the dashed lines represent the 95% credible interval. The lighter lines represent the predicted relationships based on 500 draws from the model’s posterior distribution. The models in panels B and C were based on locally hatched breeders and are plotted alongside the raw data (purple points).
Fig. 4.
Fig. 4.
The genetic and inbreeding contributions of pedigree founders to the population. All plots involve a shared horizontal axis representing year. (A) and (B) share a color scheme with translocated individuals uniquely colored based on source population and shade. All nontranslocated founders are shown in light gray. (A) The expected genetic contribution of each pedigree founder in the population. Each individual’s contributions across years are connected by a line. (B) Stacked barplots showing, across all individuals in a year’s population, the total amount of pedigree inbreeding that can be attributed to each pedigree founder (each bar in the stack represents the contribution of an individual). When a translocated bird contributes to inbreeding across >1 y, its contributions are connected by a line. The inbreeding values are scaled by the number of individuals in the population. The contribution value for a particular pedigree founder can thus be interpreted as the probability that the two alleles at a randomly chosen loci in a randomly chosen individual are identical by descent due to alleles inherited from the founder. (C) A summary of panel B showing the proportion of pedigree inbreeding that can be attributed to translocated birds (dark gray) and nontranslocated pedigree founders (light gray). Panels A and B include labels for the five translocated birds that contribute to inbreeding in the final monitoring year.
Fig. 5.
Fig. 5.
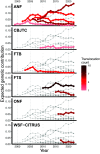
Expected genetic contributions of translocation cohorts (vertical axis) to the population through time (horizontal axis). Each series of connected points represents the contributions of a single cohort (i.e., the set of individuals translocated in a single year). A plot is included for each of the six donor populations. In each donor population’s plot, the contributions of cohorts sourced from the corresponding population are colored based on the number of individuals included in the cohort (darker red corresponds to more individuals). The contributions of cohorts originating from a nonfocal donor population are shown in light gray.

Similar articles

Cited by

References

    1. Scott J. M., et al. , Recovery of imperiled species under the endangered species act: The need for a new approach. Front. Ecol. Environ. 3, 383–389 (2005).
    1. Scott J. M., Goble D. D., Haines A. M., Wiens J. A., Neel M. C., Conservation-reliant species and the future of conservation. Conserv. Lett. 3, 91–97 (2010).
    1. Goble D. D., Wiens J. A., Scott J. M., Male T. D., Hall J. A., Conservation-reliant species. BioScience 62, 869–873 (2012).
    1. Wilcove D. S., Rothstein D., Dubow J., Phillips A., Losos E., Quantifying threats to imperiled species in the united states assessing the relative importance of habitat destruction, alien species, pollution, overexploitation, and disease. BioScience 48, 607–615 (1998).
    1. Haddad N. M., et al. , Habitat fragmentation and its lasting impact on Earth’s ecosystems. Sci. Adv. 1, e1500052 (2015). - PMC - PubMed

LinkOut - more resources