. 2025 Aug 5;122(31):e2502724122.
doi: 10.1073/pnas.2502724122. Epub 2025 Jul 28.

SARS-CoV-2 uptake and inflammatory response in senescent endothelial cells are regulated by the BSG/VEGFR2 pathway

Affiliations

SARS-CoV-2 uptake and inflammatory response in senescent endothelial cells are regulated by the BSG/VEGFR2 pathway

Yuya Sakurai et al. Proc Natl Acad Sci U S A. .

Abstract

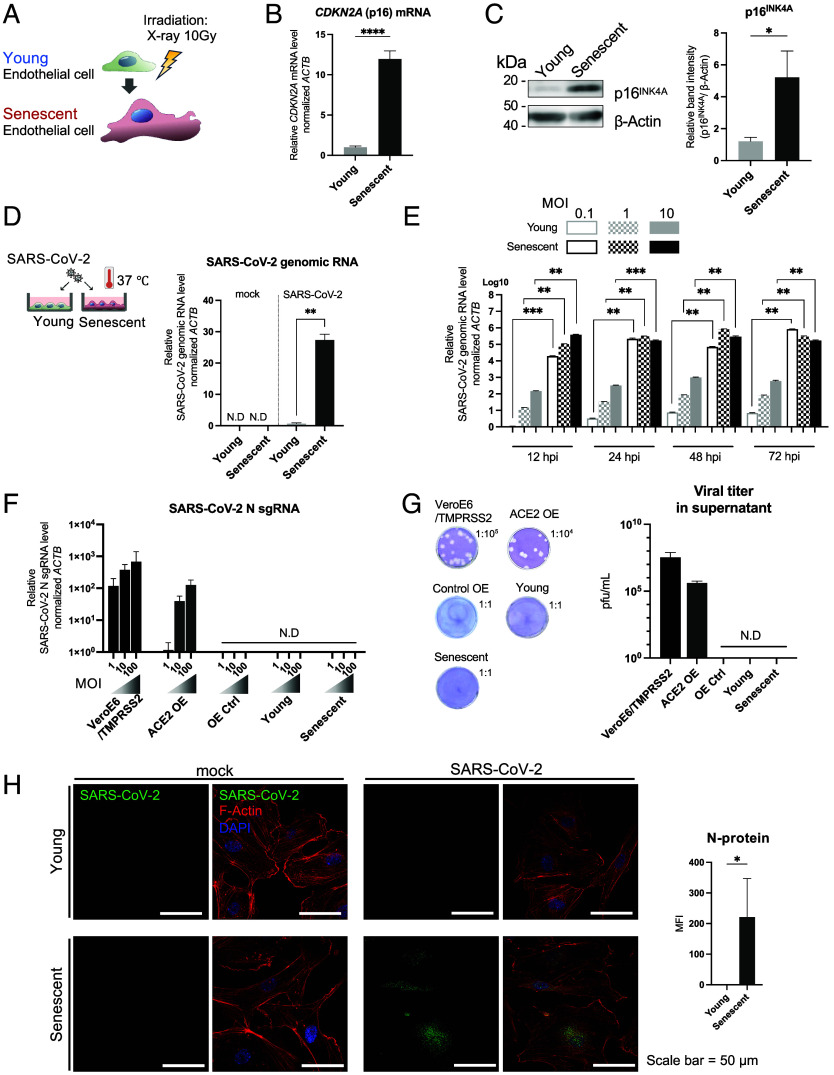
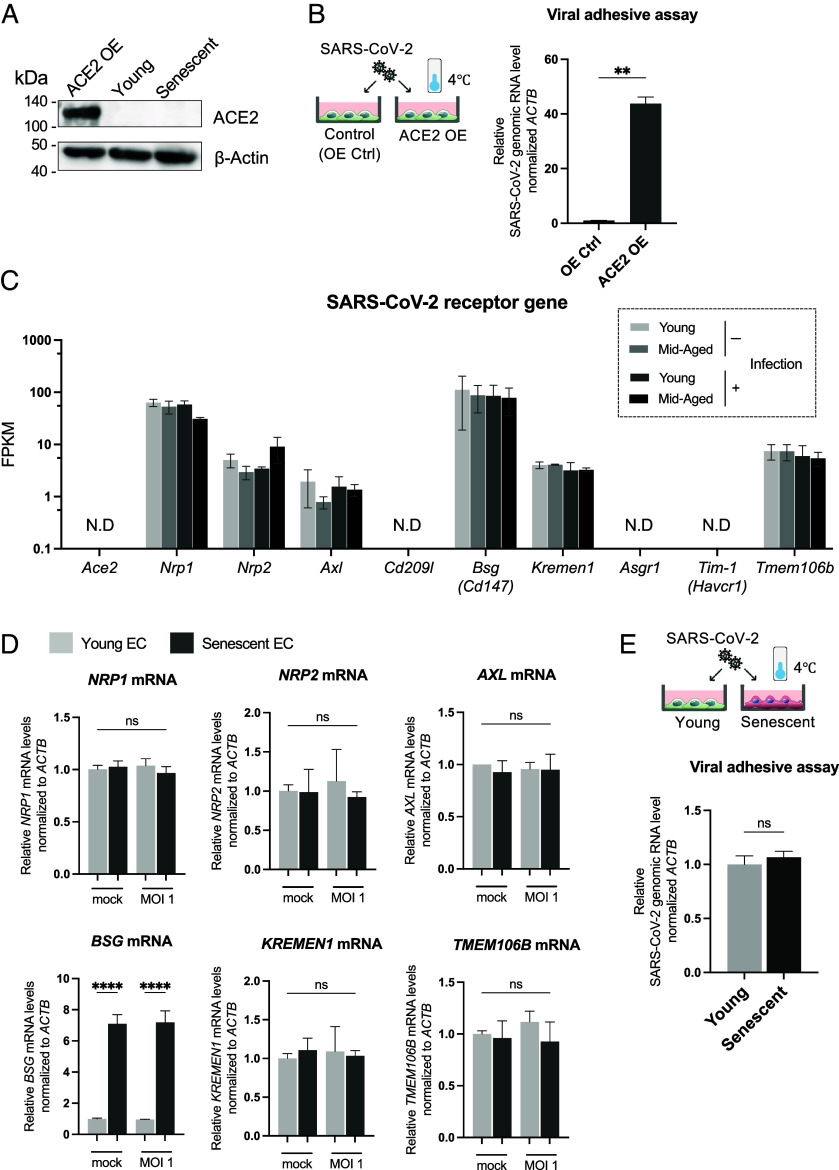
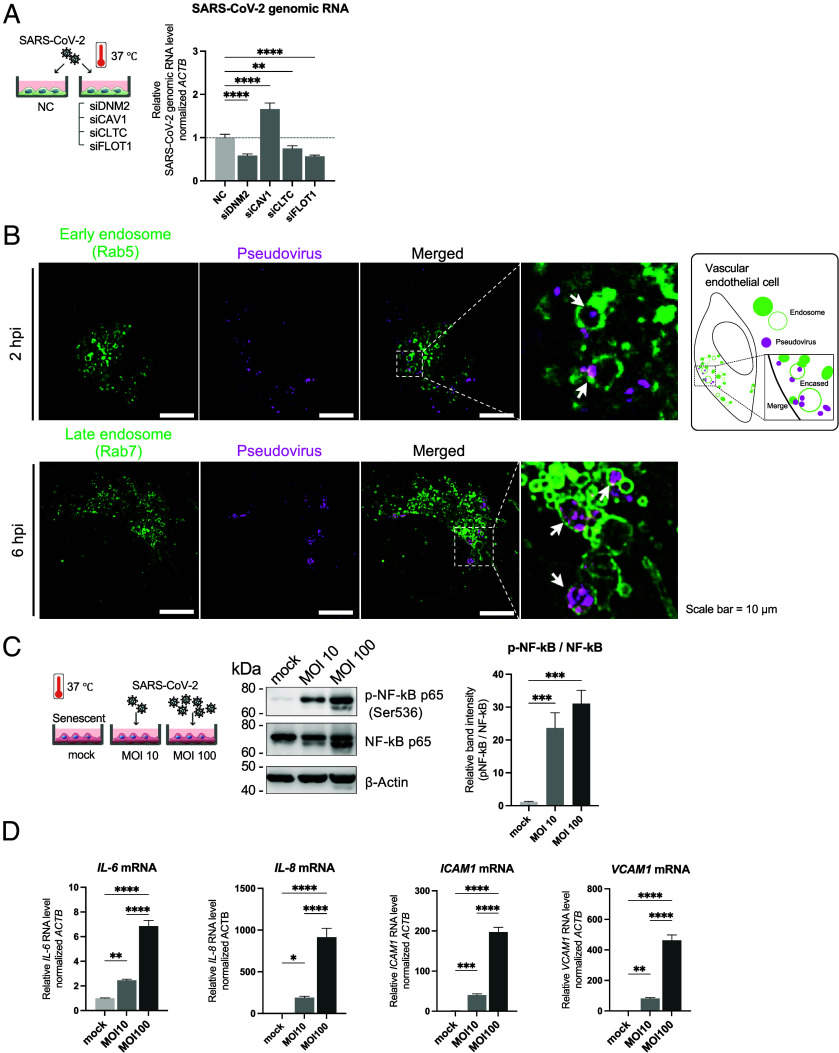
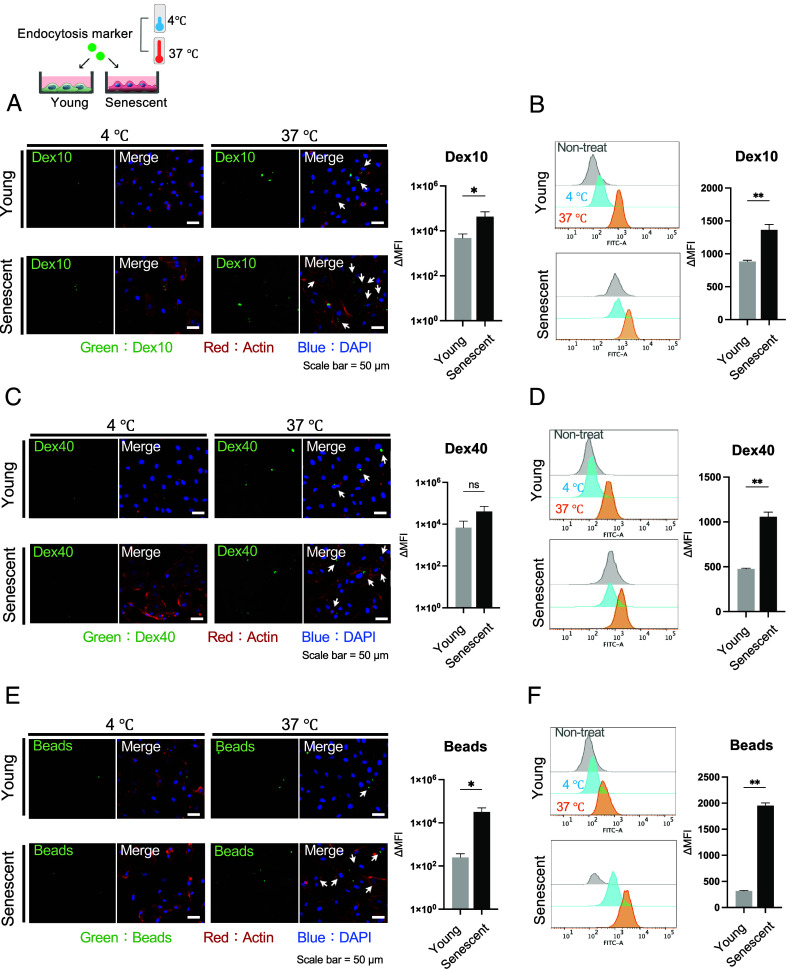
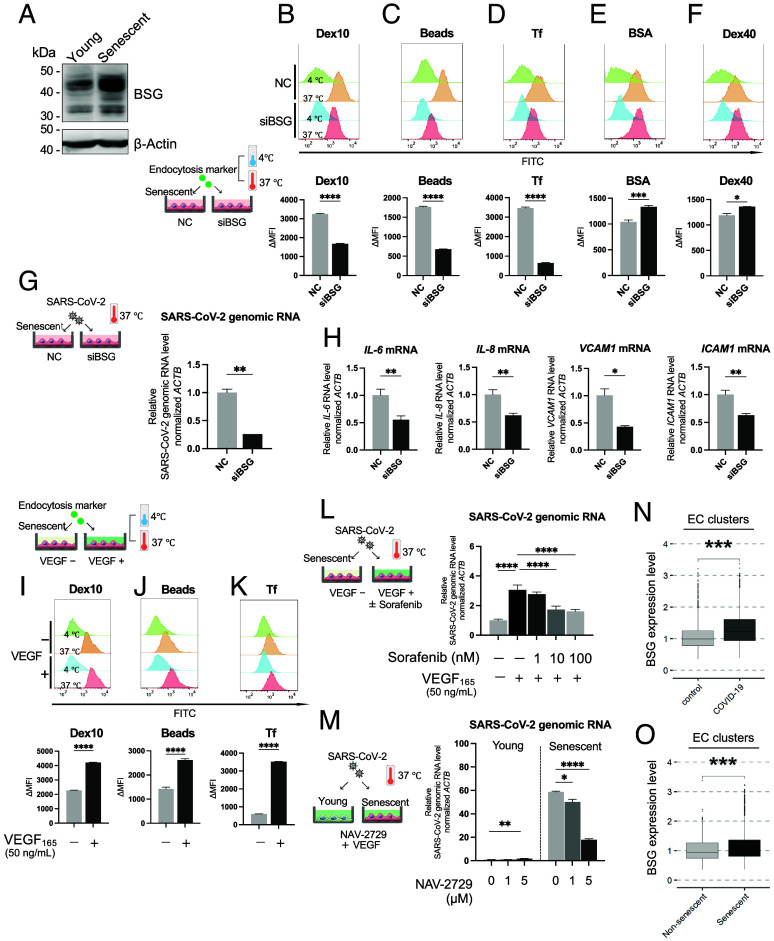
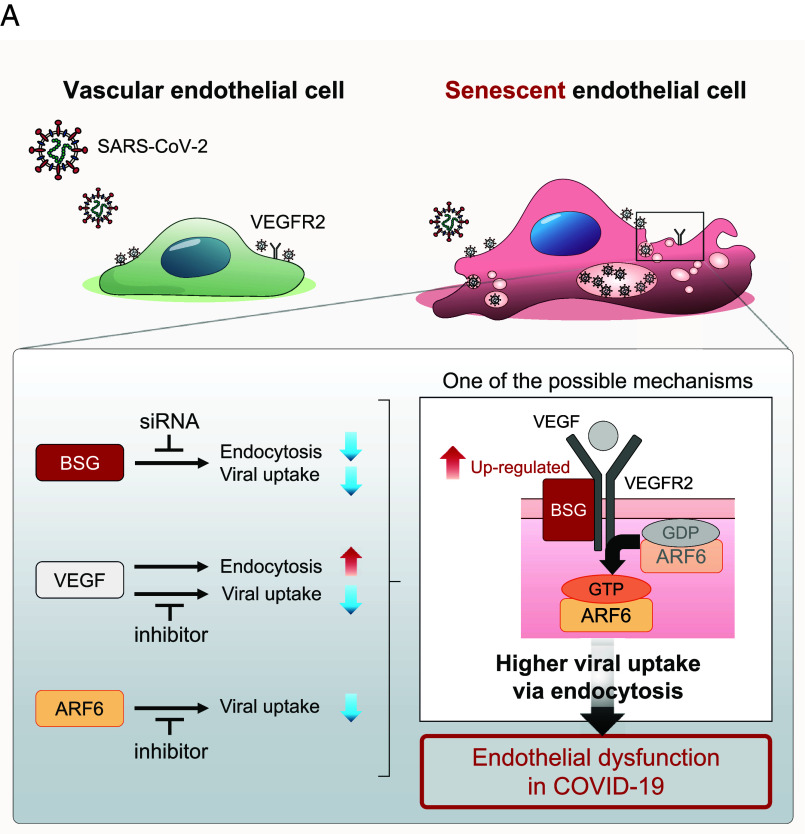
Aging is a risk factor for severe COVID-19, characterized by vascular endothelial dysfunction. Although possible susceptibility of vascular endothelial cells (ECs) to SARS-CoV-2 infection has been suggested, the details of entry into cells have not been clarified. Previously, we reported that in an aged mouse model of severe COVID-19, ECs show a massive viral uptake and inflammatory response. Here, we focused on the endocytic capacity of senescent ECs. We found that the senescent ECs showed high endocytic capacity and SARS-CoV-2 virus uptake. This triggers an nuclear factor-kappa B (NF-κB) pathway-mediated inflammatory response. Further, Basigin enhanced endocytosis in the senescent ECs by activating the intracellular vascular endothelial growth factor signaling. Thus, EC senescence is associated with enhanced SARS-CoV-2 endocytosis and subsequent vascular endothelial dysfunction. This could prove a potential target for treating severe COVID-19 in older adults.

Keywords: BSG; COVID-19; SARS-CoV-2; senescence; vascular endothelial cell.


Conflict of interest statement

Competing interests statement:The authors declare no competing interest.

Figures

Fig. 1.
Fig. 1.
SARS-CoV-2 uptake is increased in senescent ECs. (A) Schematic diagram of the irradiation method used to derive senescent ECs; (B) Transcription level of CDKN2A in Young ECs and Senescent ECs, evaluated using qPCR; (C) Protein levels of p16INK4A in Young ECs and Senescent ECs, evaluated using immunoblot analysis. Representative band images of the immunoblot using total protein and band intensity normalized using β-Actin are shown. β-Actin was visualized as a loading control; (D) SARS-CoV-2 genomic RNA level evaluated using qRT-PCR in the viral uptake assay. Genomic RNA levels in Young ECs and Senescent ECs treated without (mock) or with SARS-CoV-2 (MOI = 1; 37 °C; 48 hpi) are represented; (E) SARS-CoV-2 genomic RNA levels at different timepoints evaluated using qRT-PCR in the viral uptake assay. Genomic RNA levels in Young ECs and Senescent ECs at 12, 24, 48, or 72 hpi after treatment with SARS-CoV-2 (MOI = 0.1, 1, or 10) at 37 °C are represented; (F) SARS-CoV-2 N sgRNA levels evaluated using qPCR in Young ECs and Senescent ECs at 24 hpi after treatment with SARS-CoV-2 (MOI = 1, 10, or 100) at 37 °C; (G) Representative images and viral titer levels observed in the plaque assay conducted using supernatants of the indicated cells treated with SARS-CoV-2 (MOI = 1; 37 °C). Each representative image is labeled with the dilution ratio of the supernatant used for the plaque assay; (H) ICC representative images of SARS-CoV-2 N-protein in Young ECs and Senescent ECs treated without (mock) or with SARS-CoV-2 (MOI = 10; 37 °C; 6 hpi) and the quantification of the MFI values. Images were taken using a superresolution microscope (Scale bar, 10 μm.) [All data are presented as mean ± SD. Statistical analysis was conducted using (BE) unpaired t test or (H) Mann–Whitney test; ns, not significant; *P < 0.05; **P < 0.01; ***P < 0.001; ****P < 0.0001. N.D, not detected]
Fig. 2.
Fig. 2.
Senescence of ECs does not affect SARS-CoV-2 adhesion. (A) Protein levels of ACE2 in ACE2-OE ECs, Young ECs, and Senescent ECs, evaluated using immunoblot analysis. Representative band images of the immunoblot using total protein are shown. β-Actin was visualized as a loading control; (B) SARS-CoV-2 genomic RNA levels evaluated using qRT-PCR in the viral adhesion assay (MOI = 1; 4 °C; 2 hpi). The genomic RNA levels in ACE2-OE ECs and ECs transfected with a control vector (OE-Ctrl) are shown. Viral internalization was inhibited by incubating ECs with the virus at 4 °C, and the level of viral adhesion to the cell surface was evaluated; (C) Fragments Per Kilobase of transcript per Million mapped reads (FPKM) values of known SARS-CoV-2 receptor genes in mouse-adapted SARS-CoV-2 strain MA-P10-infected mice pulmonary ECs visualized using the RNA-seq data (GSE230022); (D) Transcription levels of NRP1, NRP2, AXL, BSG, KREMEN1, and TMEM106B in Young ECs and Senescent ECs, treated without (mock) or with SARS-CoV-2 (MOI = 1; 37 °C; 24 hpi), evaluated using qPCR; (E) SARS-CoV-2 genomic RNA levels in the viral adhesion assay, evaluated using qRT-PCR. RNA levels in Young ECs and Senescent ECs treated with SARS-CoV-2 (MOI = 1; 4 °C; 1 hpi) are shown; [All data are presented as mean ± SD; Statistical analysis was conducted using (B and E) unpaired t test or (D) one-way ANOVA followed by Tukey’s test. ns, not significant; **P < 0.01; ****P < 0.0001. N.D, not detected]
Fig. 3.
Fig. 3.
SARS-CoV-2 endocytosis and inflammatory response in ECs. (A) SARS-CoV-2 genomic RNA levels in ECs transfected with nontarget control siRNA (NC) or siRNA against DNM2 (siDNM2), CAV1 (siCAV1), CLTC (siCLTC), and FLOT1 (siFLOT1) and treated with SARS-CoV-2 (MOI = 1; 37 °C; 12 hpi), evaluated using qRT-PCR. Each gene was confirmed to be knocked down with high efficiency (SI Appendix, Fig. S2); (B) Representative superresolution microscopic images showing the uptake of pseudovirus (DiI-labeled VSV-SARS-CoV-2-S-protein) in ECs, which were visualized as early endosome (Rab5) with GFP and late endosome (Rab7) with GFP. White arrows indicate colocalization or internalization of the pseudovirus and endosomes (Scale bar, 10 μm); (C) Expression levels of p-NF-κB p65 (Ser536) and NF-κB p65 proteins in Senescent ECs treated with mock and SARS-CoV-2 (MOI = 10 or 100; 37 °C; 24 hpi), evaluated using immunoblot analysis. Representative images of the immunoblot bands (using the total protein) and the images with band intensity normalized using NF-κB p65 band intensity are shown. β-Actin was visualized as a loading control; (D) Transcription levels of the proinflammatory genes IL-6, IL-8, ICAM1, and VCAM1 in Senescent ECs treated without (mock) or with SARS-CoV-2 (MOI = 10 or 100; 37 °C; 24 hpi); [All data are presented as mean ± SD. Statistical analysis was conducted using (A) one-way ANOVA followed by Dunnett’s multiple comparison test and (C and D) one-way ANOVA followed by Tukey test. *P < 0.05; **P < 0.01; ***P < 0.001; ****P < 0.0001].
Fig. 4.
Fig. 4.
Senescence of ECs increases their endocytic capacity. (AF) Representative fluorescence microscopy images and flow cytometry analysis of Young ECs and Senescent ECs treated with the fluorescent-labeled endocytosis marker. The samples treated with 10 kDa dextran (Dex10) are shown in (A and B); those treated with 40 kDa dextran (Dex40) in (C and D); and those treated with 100 nm diameter fluorescent beads (Beads) in (E and F). White arrows in the fluorescence microscope image indicate the uptake of the endocytosis marker into the cell. The mean fluorescence intensity (MFI) of the endocytosis-marker signal in the F-actin-positive areas per cell in the fluorescence microscopy images taken at 4 °C and 37 °C were measured. ΔMFI was defined as the difference in the MFI of the endocytosis-marker-positive signal in the F-actin-positive areas per cell measured using the images taken at 37 °C and the average MFI measured from images taken at 4 °C. The fluorescence signal of the endocytosis marker in the flow cytometry analysis was obtained in the fluorescein isothiocyanate (FITC) channel; ΔMFI was calculated by subtracting the fluorescence signal from cells incubated with markers at 4 °C from that obtained from cells incubated with markers at 37 °C. [The data represent mean ± SD. Statistical analysis was conducted using the Mann–Whitney test. (Scale bar, 50 μm.) *P < 0.05; **P < 0.01].
Fig. 5.
Fig. 5.
Knockdown of BSG expression in senescent ECs reduces viral uptake. (A) Protein level of BSG evaluated using immunoblot analysis in Young ECs and Senescent ECs. Representative band images of the immunoblot using total protein are shown. β-Actin was visualized as a loading control; (BF) Flow cytometry analysis of Senescent ECs transfected with nontarget control siRNA (NC) or siRNA against BSG (siBSG) treated with a fluorescent-labeled endocytosis marker. The samples treated with 10 kDa dextran (Dex10) are shown in (B); treated with 100 nm diameter fluorescent beads (Beads) in (C); treated with transferrin (Tf) in (D); treated with bovine serum albumin (BSA) in (E); and treated with 40 kDa dextran (Dex40) in (F); Endocytosis-marker fluorescence signals were acquired in the FITC channel, and the ΔMFI is the MFI in the 37 °C sample minus the average of MFI in the 4 °C sample. BSG was confirmed to be highly and efficiently knocked down (SI Appendix, Fig. S4); (G and H) SARS-CoV-2 genomic RNA levels evaluated using qRT-PCR (G) and transcription levels of the proinflammatory genes IL-6, IL-8, ICAM1, and VCAM1 (H) in the viral uptake assay. The SARS-CoV-2 genomic RNA levels in Senescent ECs transfected with nontarget control siRNA (NC) and siRNA against BSG (siBSG) are shown. Cells were treated with SARS-CoV-2 (MOI = 1; 37 °C; 12 hpi) 72 h after siRNA transfection; (IK) Flow cytometry analysis of Senescent ECs treated with fluorescent-labeled endocytosis markers in VEGF-free (VEGF−) or VEGF containing (VEGF+) media. Endocytosis marker fluorescence signals were acquired in the FITC channel, and the ΔMFI is the MFI in the 37 °C sample minus the average MFI in the 4 °C sample; (L) SARS-CoV-2 genomic RNA levels evaluated using qRT–PCR in the viral uptake assay. Senescent ECs were treated with VEGF-free (VEGF−), VEGF containing (VEGF+), and Sorafenib (1, 10, or 100 nM) containing media followed by SARS-CoV-2 (MOI = 1; 37 °C; 12 hpi); (M) SARS-CoV-2 genomic RNA levels evaluated using qRT–PCR in the viral uptake assay. Young ECs and Senescent ECs were treated with NAV-2729 (0, 1, or 5 μM) and VEGF containing media followed by SARS-CoV-2 (MOI = 1; 37 °C; 12 hpi); (N and O) BSG transcriptional expression levels in human vascular EC assessed by reanalysis of deposited single-nucleus RNAseq data (GSE159585). BSG expression levels of vascular EC in autopsy lungs of patients who died of COVID-19 and autopsy lungs of patients who died of causes other than lung disease (control) are shown in N. Senescent vascular EC (Senescent) were subset as CDKN2A-positive and compared with other vascular EC (nonsenescent) (O); [All data are presented as mean ± SD. Statistical analysis was conducted using (BF and IK) Mann–Whitney test, (G and H) unpaired t test, (L) one-way ANOVA followed by Tukey’s test, (M) one-way ANOVA followed by Dunnett’s multiple comparison test, and (N and O) Wilcoxon test. *P < 0.05; **P < 0.01; ***P < 0.001; ****P < 0.0001].
Fig. 6.
Fig. 6.
Graphical abstract. (A) Schematic of a possible mechanism (revealed in this study) through which severe COVID-19 is caused by aging EC pathology. Increased SARS-CoV-2 endocytosis induced by enhanced VEGF-VEGFR2 signaling, which is induced by upregulated BSG expression in aged ECs, causes an excessive inflammatory response in vascular ECs, resulting in vascular dysfunction.

Similar articles

References

    1. Zhou P., et al. , A pneumonia outbreak associated with a new coronavirus of probable bat origin. Nature 579, 270–273 (2020). - PMC - PubMed
    1. WHO, World Health Organization 2023 data.who.int, WHO Coronavirus (COVID-19) dashboard. https://data.who.int/dashboards/covid19/. Accessed 24 October 2024.
    1. Tao C., et al. , Clinical characteristics of 113 deceased patients with coronavirus disease 2019: Retrospective study. BMJ. 368, m1091 (2020). - PMC - PubMed
    1. Verity R., et al. , Estimates of the severity of coronavirus disease 2019: A model-based analysis. Lancet Infect. Dis. 20, 669 (2020). - PMC - PubMed
    1. COVID-19 Forecasting Team, Variation in the COVID-19 infection–fatality ratio by age, time, and geography during the pre-vaccine era: A systematic analysis. Lancet 399, 1469 (2022). - PMC - PubMed

LinkOut - more resources