. 2025 Aug 5;122(31):e2424459122.
doi: 10.1073/pnas.2424459122. Epub 2025 Jul 28.

Micro magnetic resonance spectroscopy for noninvasive metabolic screening of mammalian embryos and oocytes

Affiliations

Micro magnetic resonance spectroscopy for noninvasive metabolic screening of mammalian embryos and oocytes

Giulia Sivelli et al. Proc Natl Acad Sci U S A. .

Abstract

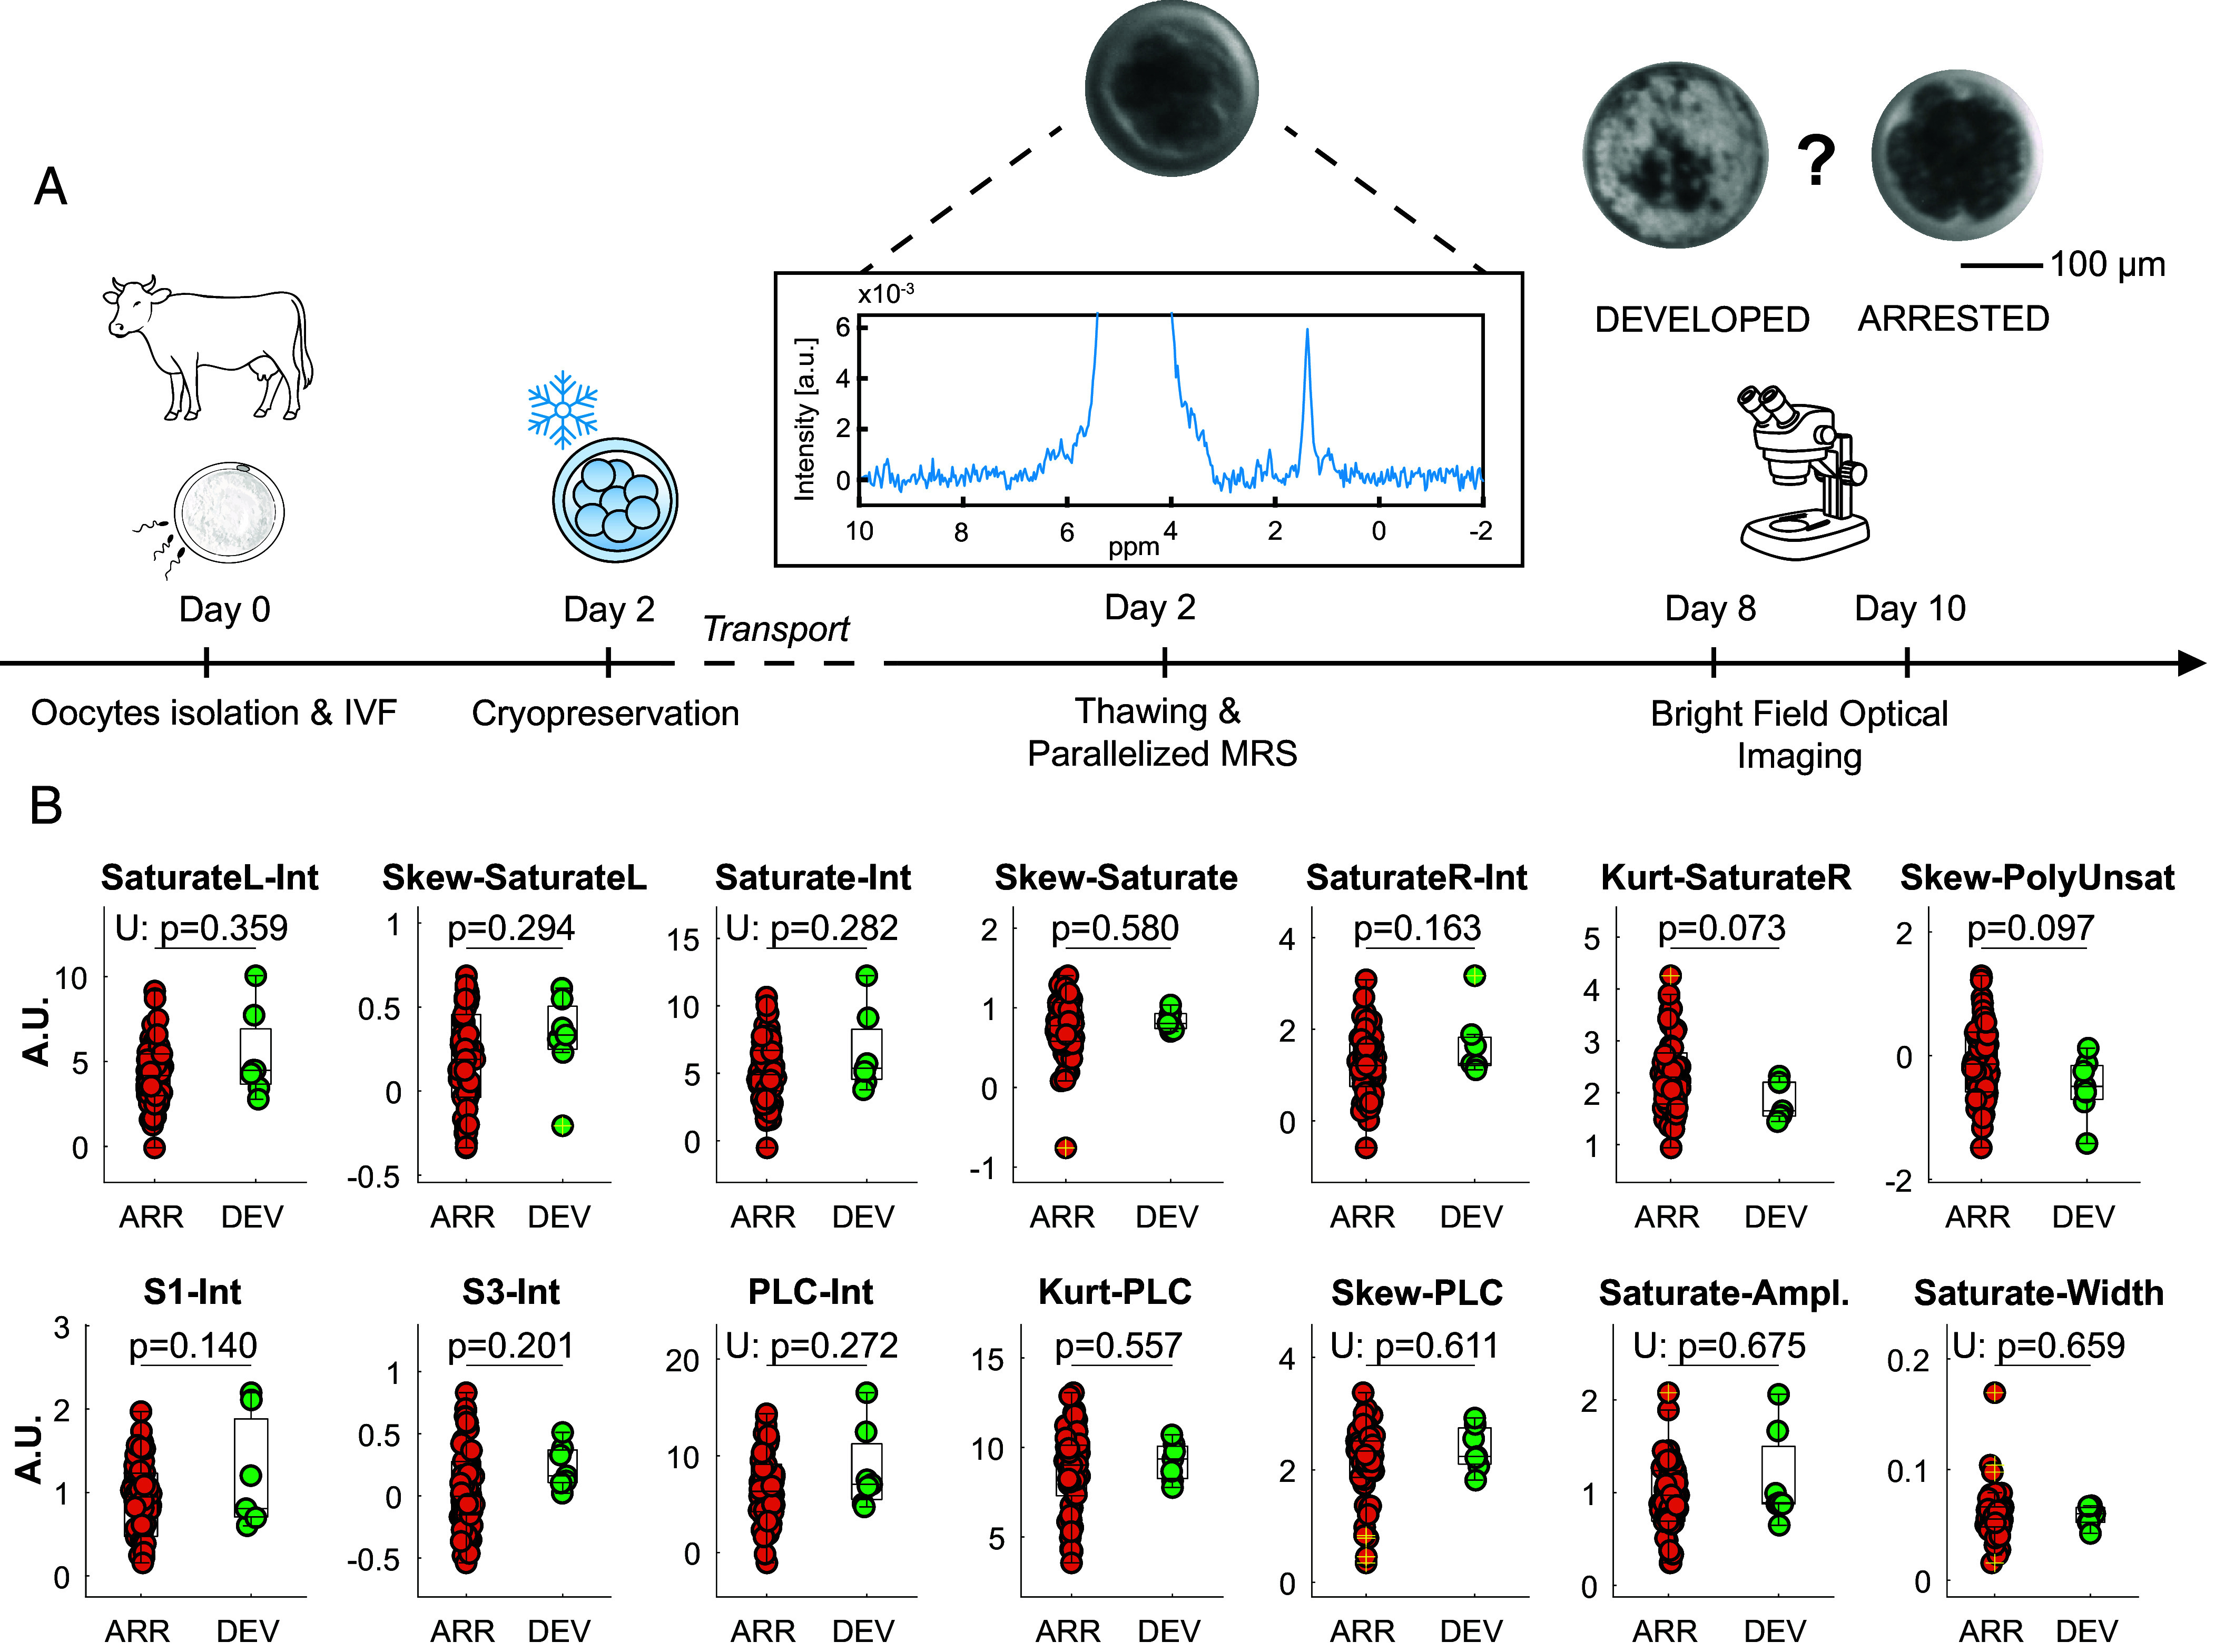
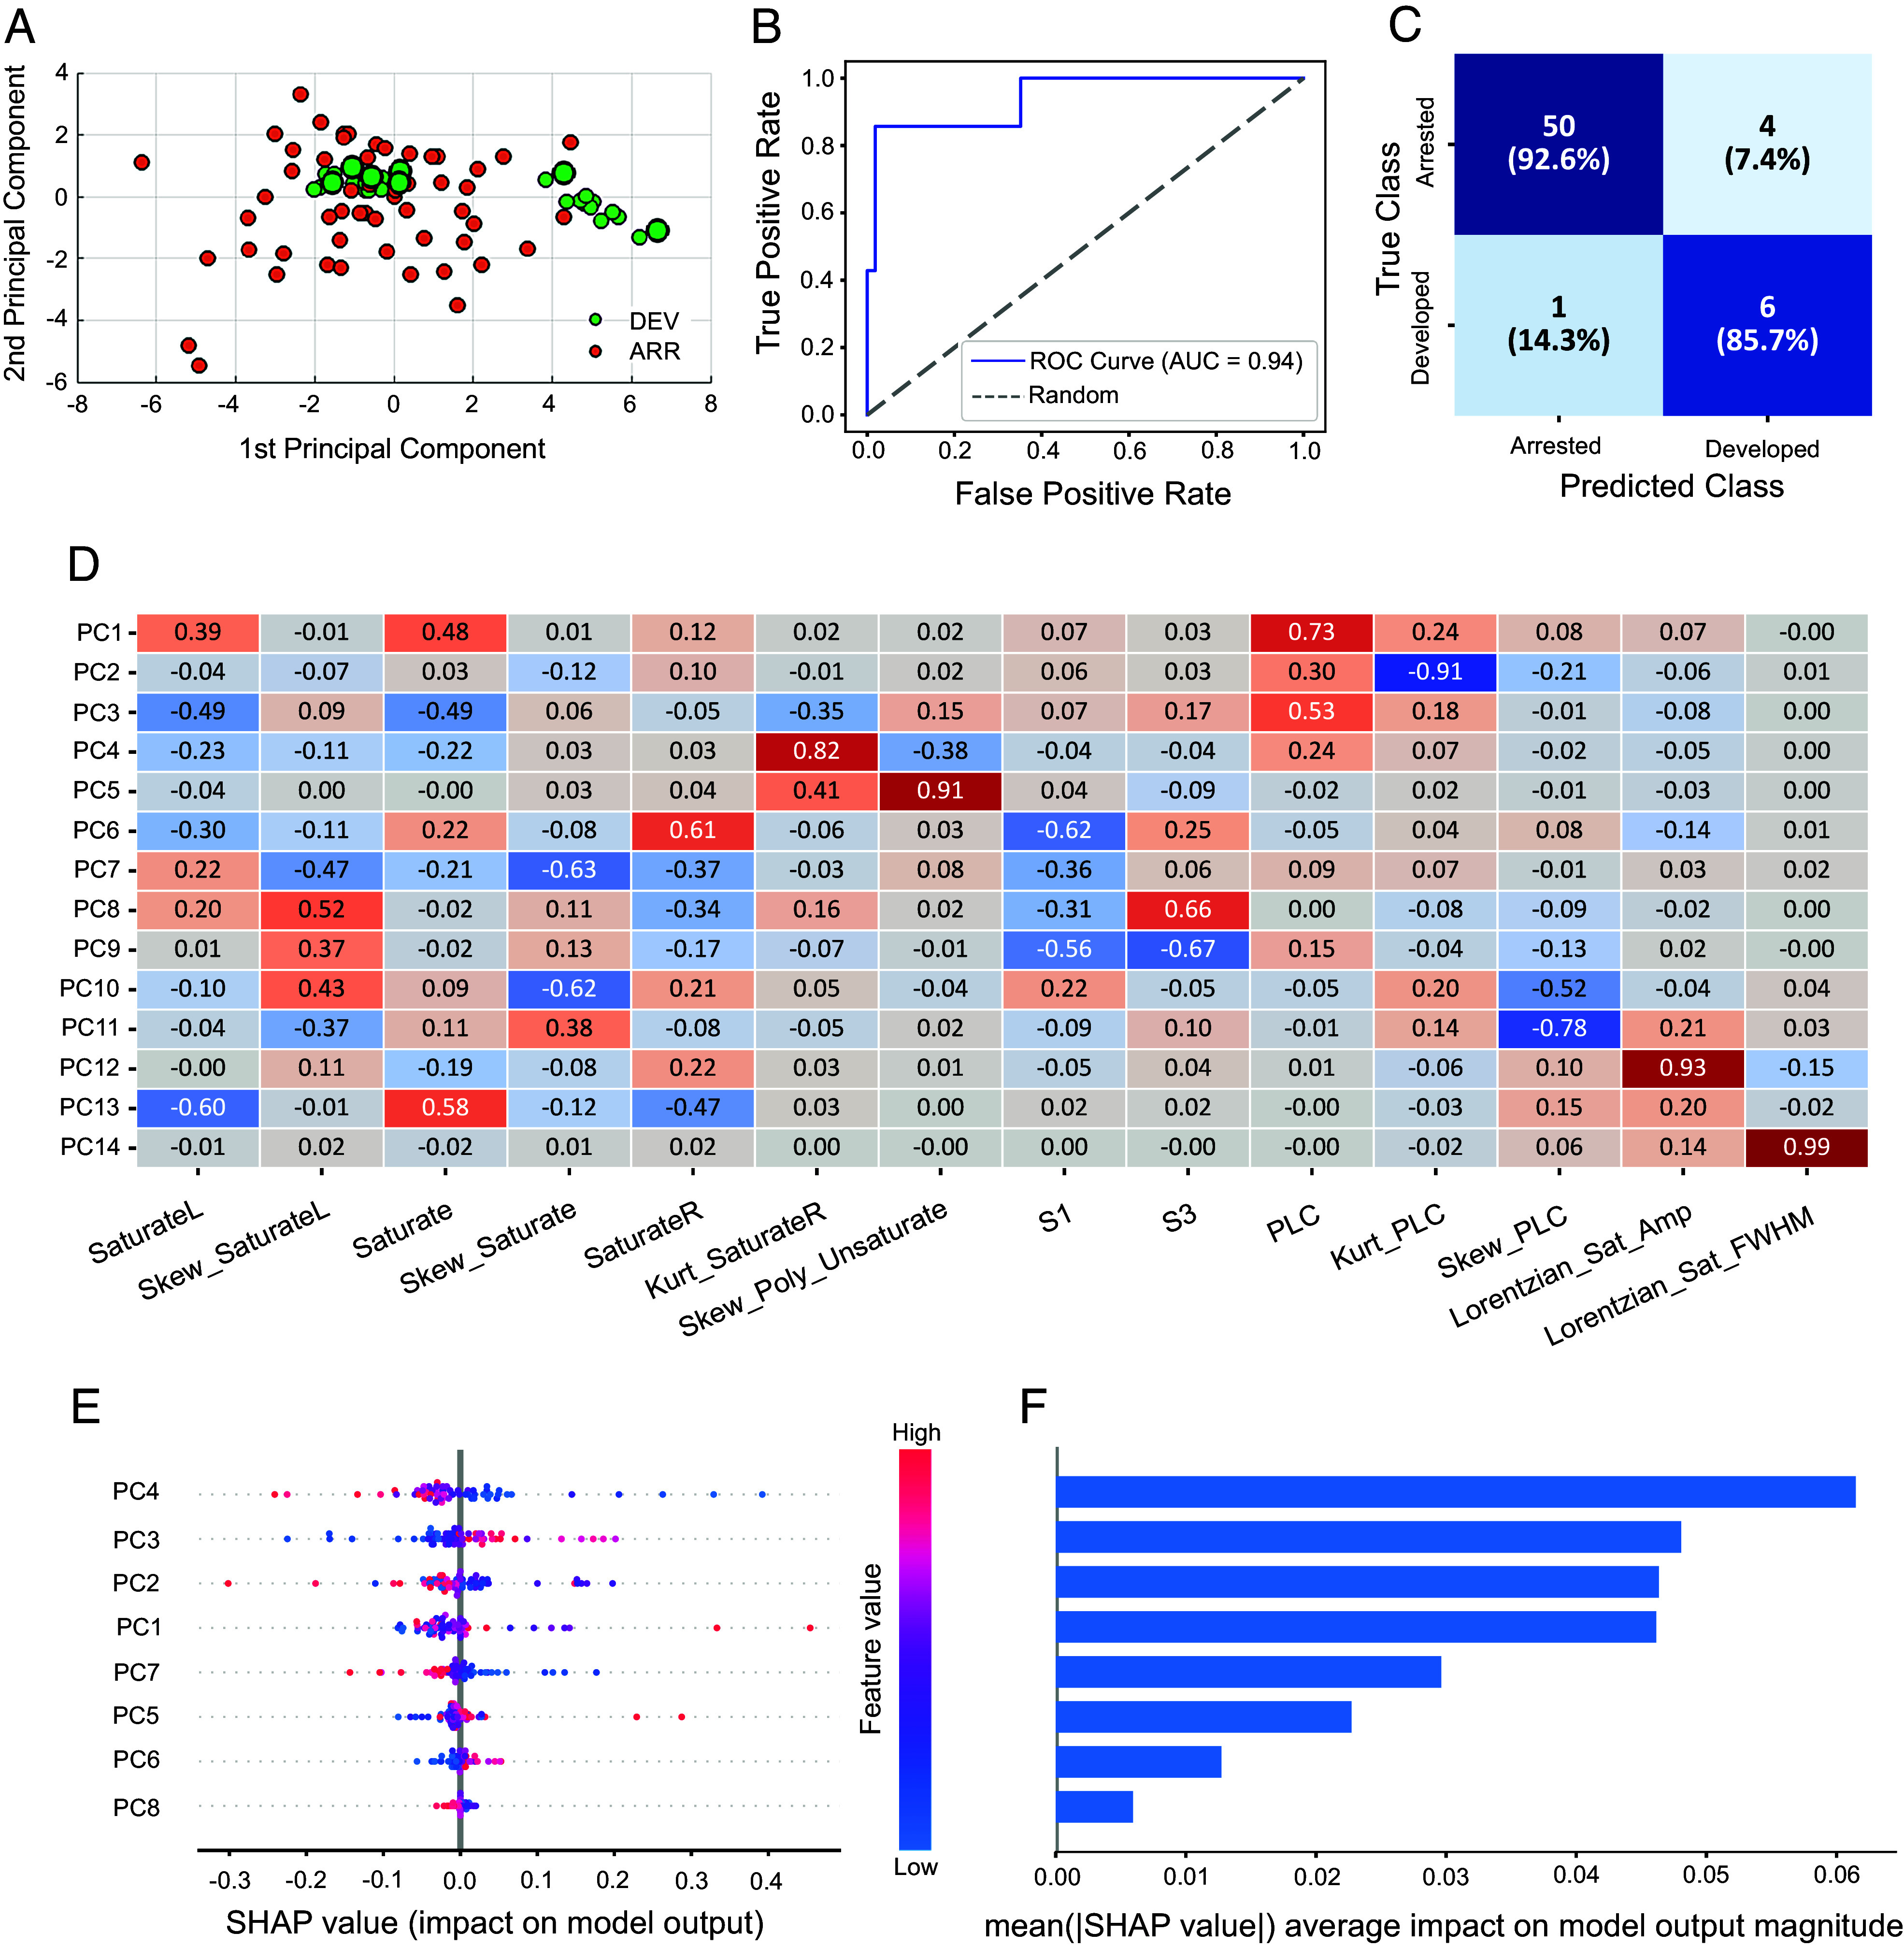
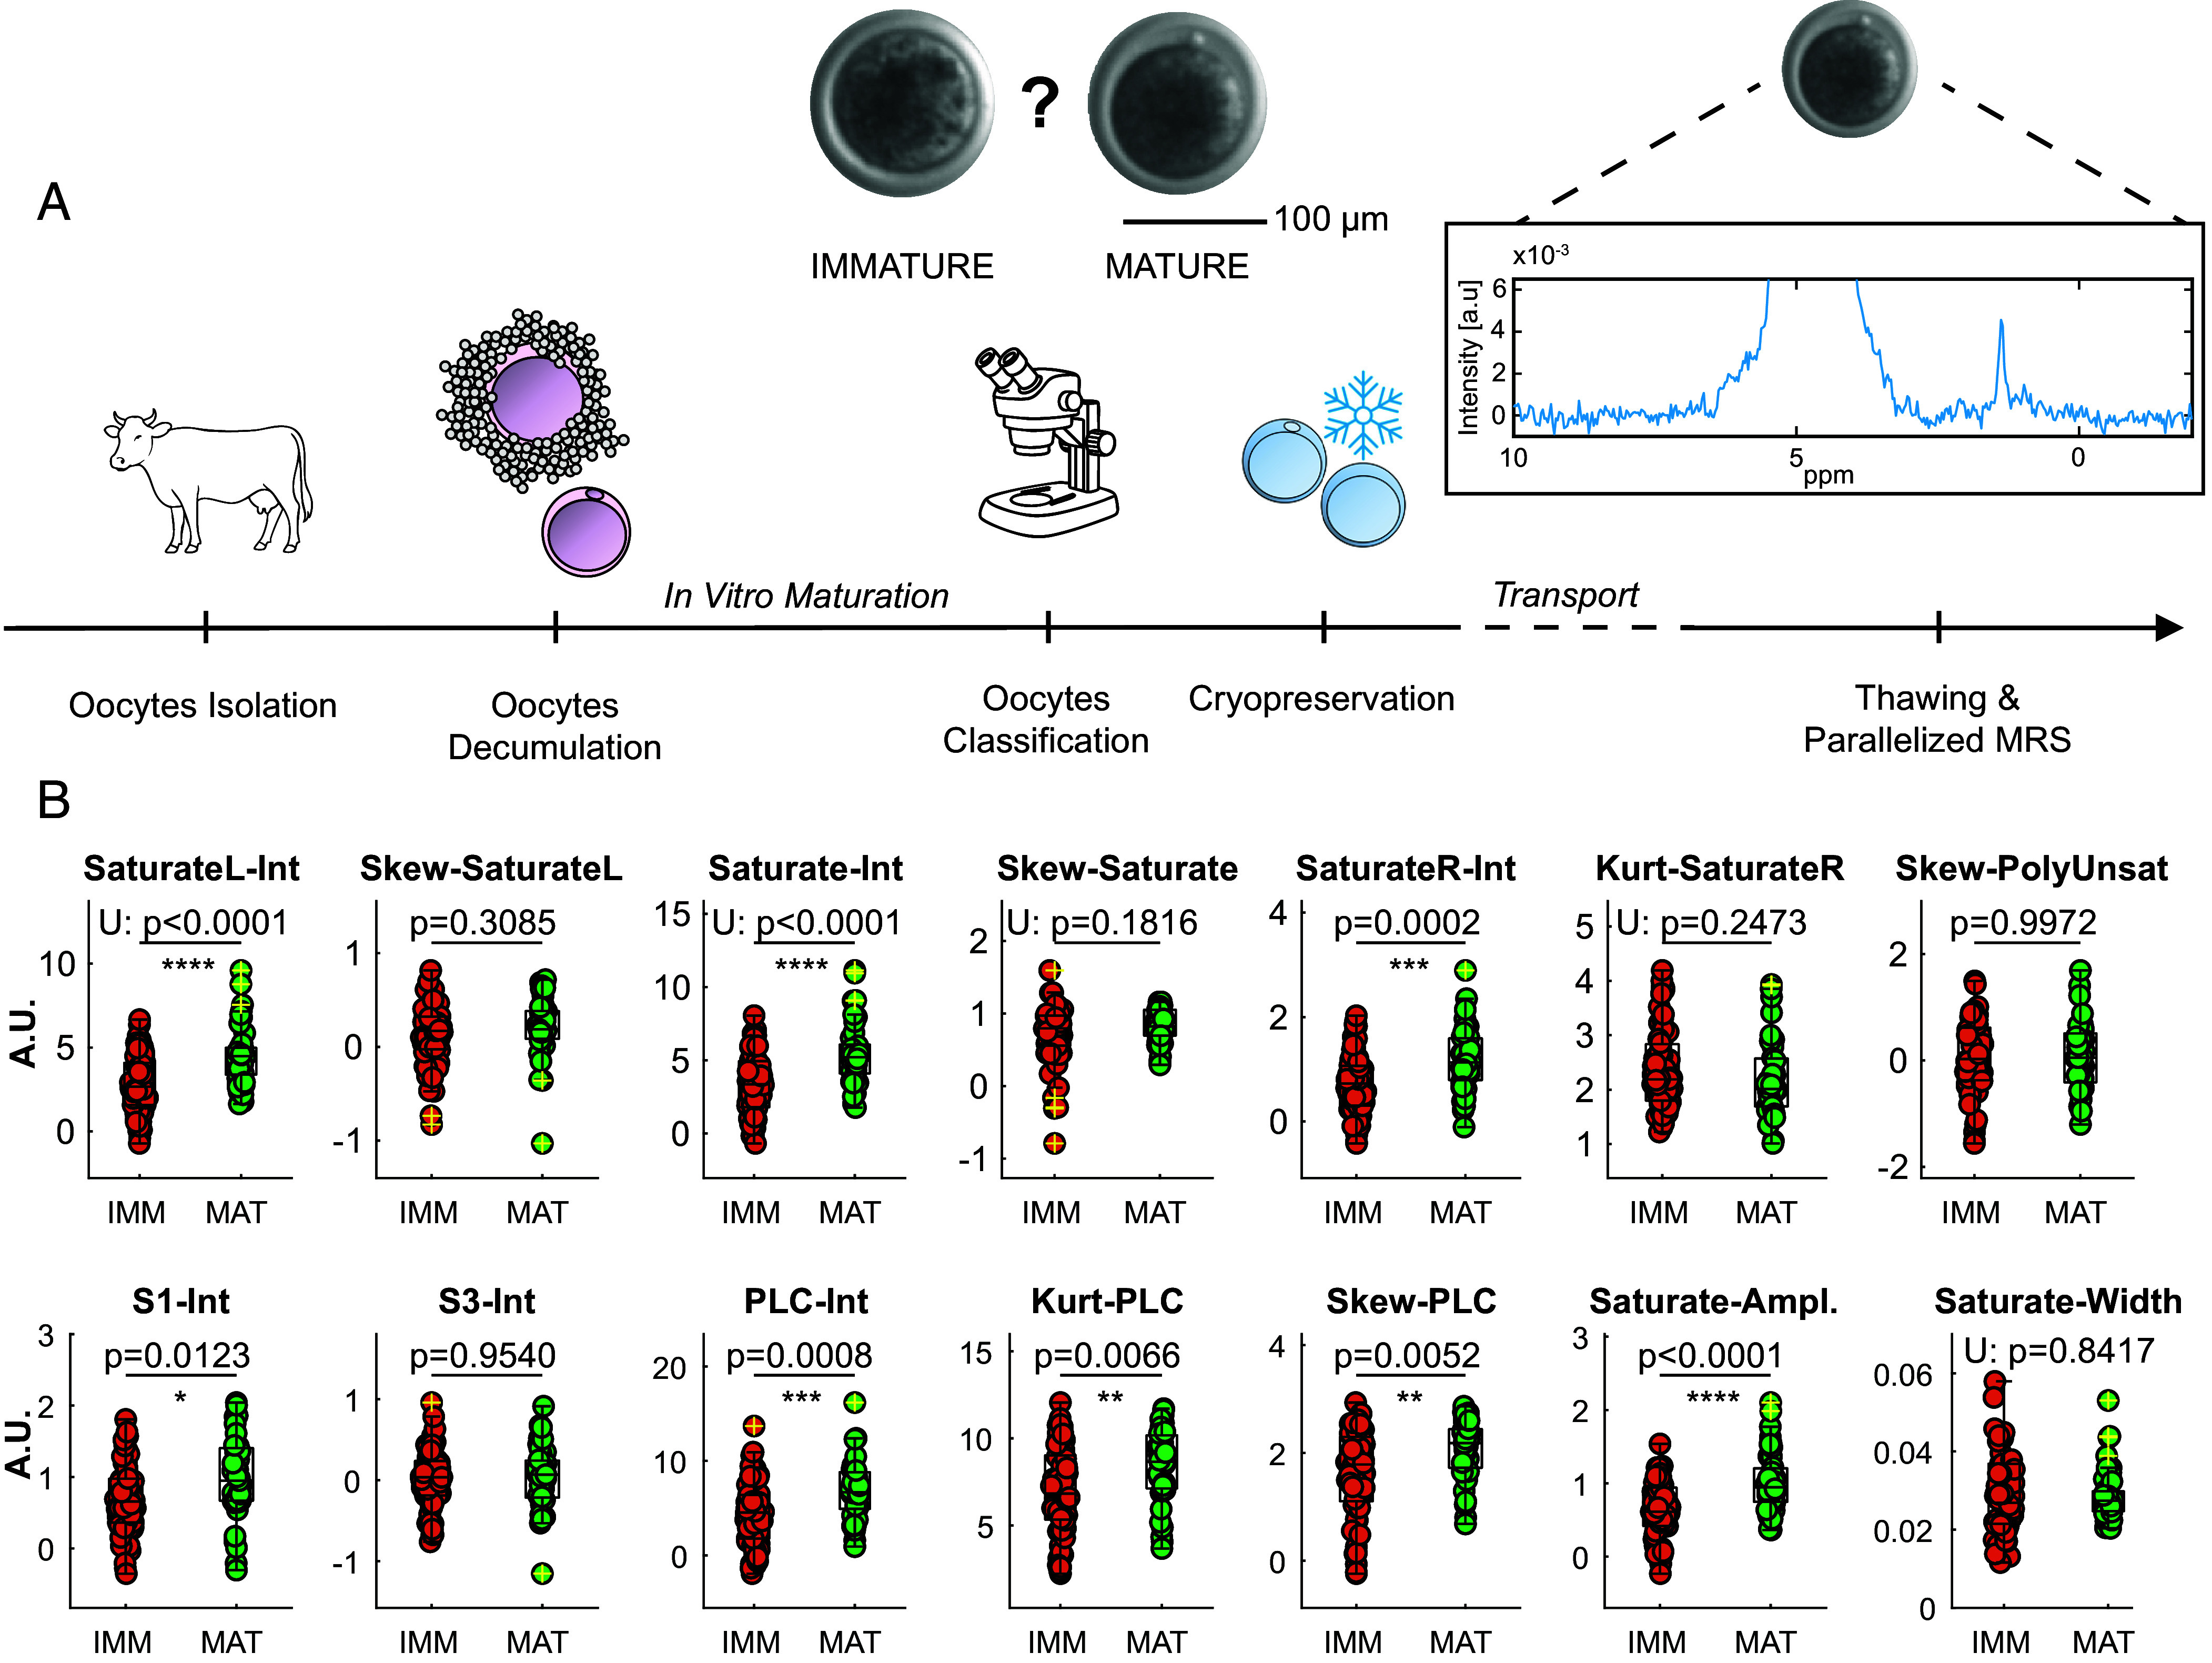
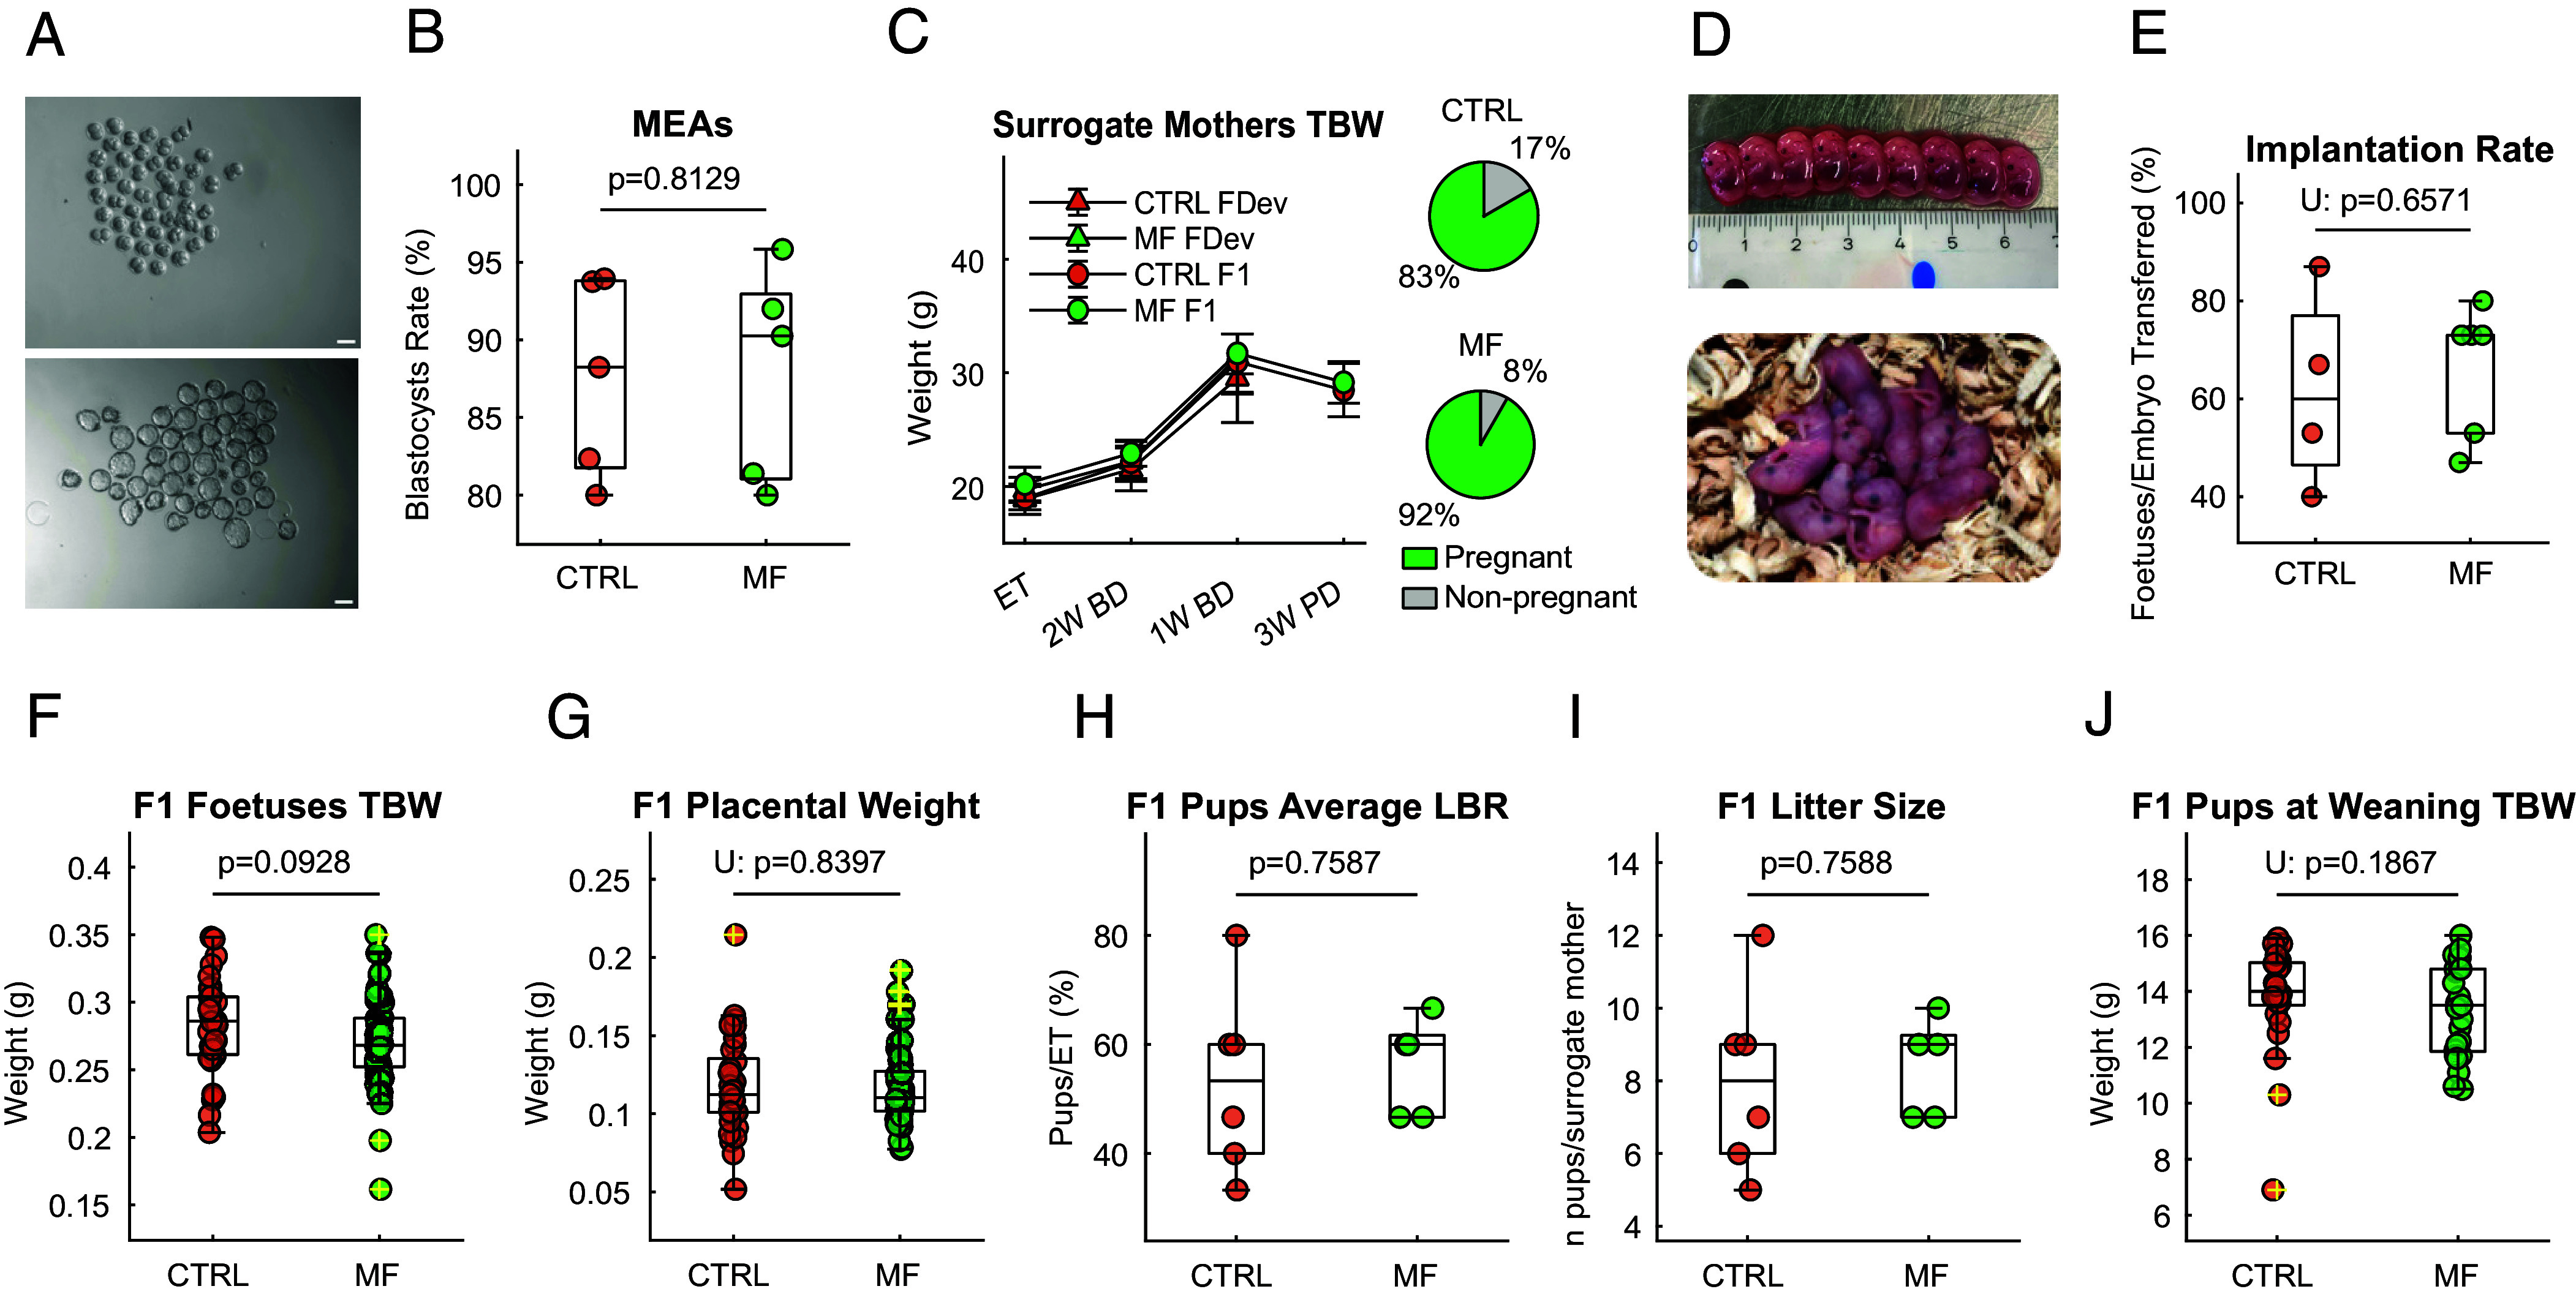
Analyzing cellular health and metabolism without compromising cell integrity is a major challenge. We present a noninvasive technique using micro magnetic resonance spectroscopy (micro MRS) for nondestructive metabolic fingerprinting at the single-cell scale. This is an application of micro MRS to bovine preimplantation embryos (~8 cells) and oocytes (single cell), with measurements performed on a total of over 150 samples. Among various applications, this method holds significant potential for assisted reproductive technologies (ART), where metabolic assessments of preimplantation embryos could improve treatment outcomes. Early results indicate that classification models using micro MRS data effectively distinguish embryos with high developmental potential and show correlation with oocytes maturity. Furthermore, a multigenerational safety study in a mouse model revealed no adverse effects from embryo exposure to static magnetic field. These findings indicate that micro MRS is a promising, safe tool for assessing embryo metabolism, potentially improving the efficiency and outcomes of ART.

Keywords: Magnetic Resonance Spectroscopy; metabolic fingerprinting; micro MRS; non-invasive embryo screening; single-cell MRS.


Conflict of interest statement

Competing interests statement:Marco Grisi has relevant ownership in Annaida as he is the Founder. Marco Grisi is inventor of a patent related to this work (2018, PCT/IB2018/057348).

Figures

Fig. 1.
Fig. 1.
Correlation of MR spectra with developmental outcome in Day 2 (~8-cell) embryos. (A) Procedure overview: collection of oocytes and sperm, embryo production via IVF (Day 0), cryopreservation at the 8-cell stage (Day 2), thawing and MRS measurement, and subsequent incubation. Development is assessed on Day 8 and Day 10 by bright field microscopy to categorize embryos as expanded blastocysts (Developed, DEV) or developmentally arrested (Arrested, ARR). (Scale bar, 100 μm.) (B) Biomarker quantification for ARR (n = 54) and DEV (n = 7) groups. Normality was assessed with the Lilliefors test, with significance determined by the t test or Mann–Whitney U test (U). Biomarkers include intensity (-Int), skewness (-Skew), and kurtosis (-Kurt) within specific chemical shift regions of the spectrum: PLC [0.83 to 2.8], Saturate [1.1 to 1.5], S1 [0.83 to 1.03], S3 [2.23 to 2.36], SaturateL [1.3 to 1.5], and SaturateR [1.1 to 1.3]. Saturate-Ampl and Saturate-Width are derived from Lorentzian fit parameters in the Saturate region. See SI Appendix, Tables S1 and S2 for additional information on biomarkers definition.
Fig. 2.
Fig. 2.
Classification of developmental potential based on 8-cell embryos MRS biomarkers. (A) Typical first and second principal components [A.U] observed after applying SMOTE (Synthetic Minority Over-sampling Technique) on the whole dataset to balance it (NTOT = 61, NARR = 54, NDEV = 7). Red: arrested embryos; big green: original developed embryos; small green: synthetic developed embryos. (B) ROC curve with AUC comparison between a dummy classifier (predicting the most frequent class) and our SVM model, both evaluated using a CVLOO strategy. (C) Confusion matrix aggregated from the CVLOO predictions of the SVM model. SMOTE was applied exclusively to the training data in each fold to address class imbalance, ensuring no data leakage into the validation set. (D) PCA loadings showing the contribution of each original feature to the principal components. PCA was performed on the training data prior to SMOTE application. (E and F) SHAP summary and bar plots illustrating the first 8 most influential principal components in the model and their effect on prediction outcomes.
Fig. 3.
Fig. 3.
Magnetic Resonance analysis of oocytes maturation. (A) Procedure overview: ovaries are aspirated, oocytes denuded of cumulus cells and incubated for In Vitro Maturation (IVM). Maturation is assessed by the presence of a polar body under a bright field microscope, categorizing oocytes as immature (IMM) or mature (MAT). The oocytes are cryo-preserved post-assessment, transported to our laboratory, thawed, and measured with parallelized single-oocyte Magnetic Resonance Spectroscopy (MRS). (Scale bar, 100 μm.) (B) Biomarkers quantification for immature (IMM, n = 63) and mature (MAT, n = 39) oocytes. Normality assessed with Lilliefors test, with significance determined by unpaired t test or Mann-Whitney U Test (U). Biomarkers include Intensity (-Int), Skewness (-Skew), and Kurtosis (-Kurt) within specific chemical shift regions of the spectrum: PLC [0.83 to 2.8], Saturate [1.1 to 1.5], S1 [0.83 to 1.03], S3 [2.23 to 2.36], SaturateL [1.3 to 1.5], SaturateR [1.1 to 1.3]. Saturate-Ampl and Saturate-Width are derived from Lorentzian fit parameters in the Saturate region.Saturate-Ampl and Saturate-Width are derived from Lorentzian fit parameters in the Saturate region. See SI Appendix, Tables S1 and S2 for additional information on biomarkers definition.
Fig. 4.
Fig. 4.
Main IVF outcomes of Static Magnetic Field (MF) exposure on 2-cell embryos. Bars represent SD with statistical significance set at P < 0.05, indicated on top of each comparison. Normality was assessed with the Kolmogorov-Smirnov test, and significance was determined by an unpaired t test or Mann-Whitney U Test (indicated with U:). (A) Representative images of 2-cell embryos exposed to Static MF developing to blastocyst. (B) Mouse Embryo Assay (MEA) comparing blastocyst rates, showing no significant difference (P = 0.1930) between embryos exposed to a 9.4 Tesla static MF versus CTRL; n = 187 CTRL, n = 227 MF embryos, across 5 experiments. (C) Left: body weight progression of surrogate mothers at embryo transfer, during pregnancy, and 3 wk post-delivery. F0-Fdev = mothers killed before delivery to assess implantation (n = 12); F0-F1 = mothers kept alive until delivery to assess LBR (n = 12). Right: pregnancy rates of surrogate mothers (n = 24, 12 MF, 12 CTRL) as a percentage post-embryo transfer. (D) Top: representative image of ED14 fetuses from the Static MF exposure group. Bottom: Representative image of F1 pups from the Static MF exposure group. (E) Implantation rate as the percentage of fetuses at embryonic day (ED) 14 against the number of transferred embryos (n = 15 embryos transferred per surrogate mother). No significant difference observed (P = 0.6571, n = 10 surrogate mothers, 4 CTRL, 6 MF; n = 37 fetuses in CTRL, n = 59 fetuses in MF). (F) Average foetal TBW at ED14 (n = 96, 37 CTRL, 59 MF). No significant difference observed (P = 0.0928). (G) Average placental weight at ED14 (n = 95, 37 CTRL, 58 MF). No significant difference observed (P = 0.8397). (H) F1 pups’ average LBR as the percentage of live F1 pups relative to the number of transferred embryos (n = 15 embryos transferred per surrogate mother) and (I) Number of F1 pups at delivery from surrogate mothers post-embryo transfer (ET). No significant difference observed (P = 0.7587, n = 11 surrogate mothers, 6 CTRL, 5 MF; n = 48 CTRL F1 pups, n = 42 MF F1 pups). (J) Average TBW of F1 pups at delivery from surrogate mothers post-ET. No significant difference observed (P = 0.1867, n = 11 surrogate mothers, 6 CTRL, 5 MF).

Similar articles

References

    1. De Geyter C., et al. , 20 years of the European IVF-monitoring consortium registry: What have we learned? A comparison with registries from two other regions. Hum. Reprod. 35, 2832–2849 (2020). - PMC - PubMed
    1. Sunderam S., et al. , Assisted reproductive technology surveillance - United States, 2016. MMWR Surveill. Summ. 68, 1–23 (2019). - PMC - PubMed
    1. Weinerman R., In vitro fertilization (IVF): Where are we now? Birth Defects Res. 110, 623–624 (2018). - PubMed
    1. Smeenk J., et al. , ART in Europe, 2019: Results generated from European registries by ESHRE†. Hum. Reprod. 38, 2321–2338 (2023). - PMC - PubMed
    1. SART, S.f.A.R.T. Final National Summary Report for 2021. (2024), https://sartcorsonline.com/CSR/PublicSnapshotReport?ClinicPKID=0&reporti.... Accessed 28 June 2025.