. 2025 Jul 28;15(1):27496.
doi: 10.1038/s41598-025-13495-1.

The unfolded protein response influences therapy outcome and disease progression in chronic lymphocytic leukaemia

Affiliations

The unfolded protein response influences therapy outcome and disease progression in chronic lymphocytic leukaemia

Umair Tahir Khan et al. Sci Rep. .

Abstract

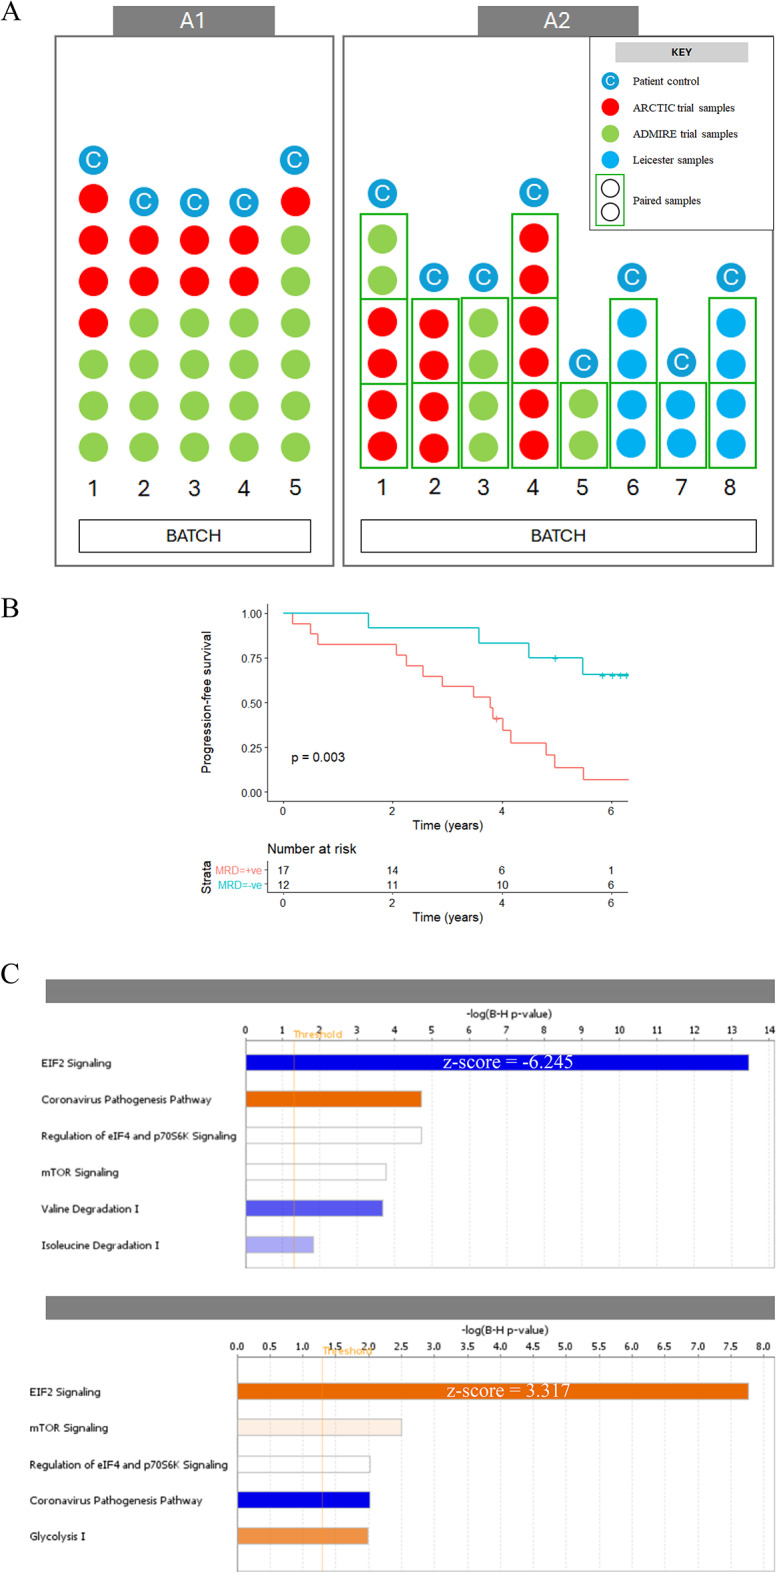
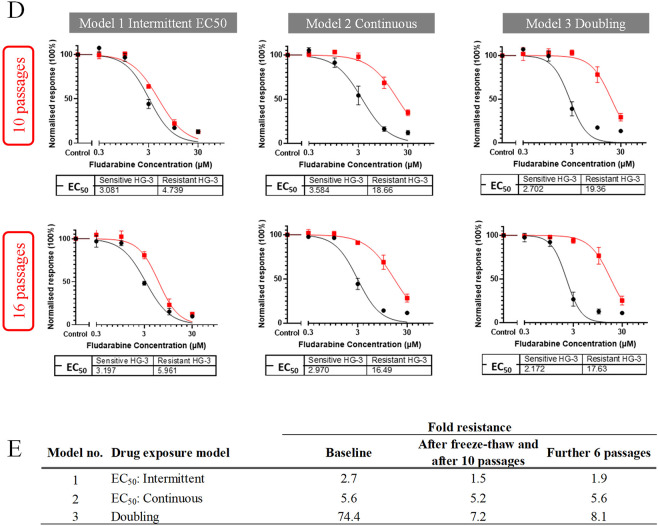
Since genomics, epigenomics and transcriptomics have provided only a partial explanation of chronic lymphocytic leukaemia (CLL) heterogeneity, and since concordance between mRNA and protein expression is incomplete, we related the CLL proteome to clinical outcome. CLL samples from patients who received fludarabine-containing chemoimmunotherapy were analysed by mass spectrometry (SWATH-MS). One dataset compared pre-treatment samples associated with an optimal versus suboptimal response, while another compared paired samples collected before treatment and at disease progression. eIF2 signalling (pivotal to the unfolded protein response (UPR)), was identified as the most enriched pathway in both datasets (respective z-scores: - 6.245 and 3.317; p < 0.0001), as well as in a fludarabine-resistant CLL cell line established from HG3 cells (z-score: - 2.121; p < 0.0001). Western blotting revealed that fludarabine-resistant HG3 cells expressed higher levels of PERK, which phosphorylates the regulatory eIF2α subunit, and lower levels of BiP, an HSP70 molecular chaperone that inactivates PERK but preferentially binds to misfolded proteins during ER stress. The PERK inhibitor, GSK2606414, sensitised resistant, but not sensitive, HG-3 cells to fludarabine without affecting background cell viability or cytotoxicity induced by the BCL-2 inhibitor venetoclax. These findings identify the UPR as a novel determinant of therapy outcome and disease progression in CLL.

Keywords: CLL cells; Drug resistance and disease progression; PERK linked to resistant phenotype; Proteomics; eIF2 signalling.


Conflict of interest statement

Declarations. Competing interests: UTK held a Fellowship that was partly funded by Eli Lilly, Novartis, Roche and UCB Pharma.AP has received research support/funding from Celgene/BMS, Gilead, GSK/Novartis, Napp, Roche. All the remaining authors declare no conflict of interest.

Figures

Fig. 1
Fig. 1
Characterisation of CLL patient cohorts. A Experimental design used to generate the A1 and A2 datasets. The 32 CLL samples used for the A1 dataset were tested in five batches (left panel) whereas the 32 paired CLL samples from 16 patients were tested in eight batches (right panel). Pairs of samples (pre-treatment and disease progression, denoted by rectangle around two samples) from individual patients were processed together in the same batch. Samples labelled as ‘C’ represent control sample from the same patient. The samples have been coloured coded to represent samples from different trials. B Kaplan-Meier plot comparing the progression-free survival (PFS; time to progression or death) of patients who achieved optimal (MRD–; blue line) or suboptimal (MRD+; red line) responses in the A1 dataset. C Ingenuity Pathway Analysis of the A1 and A2 datasets revealed EIF2 signalling as the most enriched pathway in both. A Benjamini-Hochberg correction was applied to the pathways identified to control for false discovery.
Fig. 2
Fig. 2
Selection of a cell line model to investigate fludarabine resistance. A Summary of cell line characteristics for HG-3, MEC-1 and MAVER-1. The information has been summarised from multiple sources, including DSMZ (https://www.dsmz.de/) and Cellosaurus (https://www.cellosaurus.org/). B Fludarabine dose-response curves for the three parental cell lines. Fludarabine at 0, 0.3, 1, 3, 10 and 30µM was added to HG-3, MEC-1 and MAVER-1 cells. Viability was measured at 24, 48 and 72 h and normalised relative to that of untreated control cells at the same timepoint. C Representative scatterplot showing the flow cytometry gating strategy used to measure cell viability. Forward and side scatter characteristics were used to identify intact cells (left panel). Cells were separated by quadrants into live (annexin–/7-AAD–), early apoptotic (annexin+, 7-AAD–) and late apoptotic (annexin+/7-AAD+) (right panel). (D) Representative scatter plot showing the correlation in total protein expression between HG3 v HG3 cells, patient sample v patient sample and HG3 cells v patient sample.
Fig. 3
Fig. 3
Drug exposure models to develop a cell line model of fludarabine resistance. A Graphical representations of the different drug induction models used to generate fludarabine-resistant HG-3 cell lines. For each model, cells were exposed to fludarabine or 0.1% DMSO (vehicle control) in parallel. Resistance was achieved in 100 to 120 days in most models except number 5 which remained fully sensitive. B Fludarabine dose-response curves for HG-3 cells resulting from different drug exposure strategies. Curves for cells exposed to fludarabine and DMSO are shown as red and black, respectively. Cell viability was measured using the annexin V/7-AAD assay after incubating the derived cell lines with fludarabine or 0.1% DMSO for 72 h. Viability was normalised relative to the DMSO control and EC50 (72 h) values (in µM) calculated for each model. C Fold resistance values for different drug exposure models. Values were calculated by dividing the fludarabine EC50 (72 h) of drug-exposed HG-3 with the fludarabine EC50 (72 h) of the corresponding DMSO-exposed (control) cells. D Stability of fludarabine-resistant phenotype in the three selected cell-line models after 10 and 16 passages. Dose-response experiments were performed at baseline, after 10 passages (n = 3) and after six further passages (n = 2). EC50 (72 h) values (in µM) are shown for each set of experiments. Vehicle control HG-3 cells are sensitive (black line), whereas fludarabine-exposed HG-3 are shown to maintain a level of resistance over multiple passages (red line). E Fold-resistance values are shown at baseline and after undergoing either 10 or 16 additional passages in the absence of fludarabine.
Fig. 3
Fig. 3
Drug exposure models to develop a cell line model of fludarabine resistance. A Graphical representations of the different drug induction models used to generate fludarabine-resistant HG-3 cell lines. For each model, cells were exposed to fludarabine or 0.1% DMSO (vehicle control) in parallel. Resistance was achieved in 100 to 120 days in most models except number 5 which remained fully sensitive. B Fludarabine dose-response curves for HG-3 cells resulting from different drug exposure strategies. Curves for cells exposed to fludarabine and DMSO are shown as red and black, respectively. Cell viability was measured using the annexin V/7-AAD assay after incubating the derived cell lines with fludarabine or 0.1% DMSO for 72 h. Viability was normalised relative to the DMSO control and EC50 (72 h) values (in µM) calculated for each model. C Fold resistance values for different drug exposure models. Values were calculated by dividing the fludarabine EC50 (72 h) of drug-exposed HG-3 with the fludarabine EC50 (72 h) of the corresponding DMSO-exposed (control) cells. D Stability of fludarabine-resistant phenotype in the three selected cell-line models after 10 and 16 passages. Dose-response experiments were performed at baseline, after 10 passages (n = 3) and after six further passages (n = 2). EC50 (72 h) values (in µM) are shown for each set of experiments. Vehicle control HG-3 cells are sensitive (black line), whereas fludarabine-exposed HG-3 are shown to maintain a level of resistance over multiple passages (red line). E Fold-resistance values are shown at baseline and after undergoing either 10 or 16 additional passages in the absence of fludarabine.
Fig. 4
Fig. 4
Proteomic analysis of fludarabine-resistant cell-line models (models 1–3). A Sensitive (S) and resistant (R) cells from each model were exposed to 0.1% DMSO (D) or drug (fludarabine, 2.8µM (F)) for 24 h. The viability of the cells measured by Annexin V and 7-AAD was on average  77%. Each group of four samples in each of the three models was tested together in the same batch of 12 samples, and the experiment was replicated over four batches comprising 48 samples in total. B Principal component analysis of proteomic data from all 48 HG-3 samples, with batch-corrected data coded for resistance model and phenotype (left panel) and batch-corrected data coded for treatment with fludarabine or DMSO (control) (right panel). C Canonical pathway analysis in IPA revealed that EIF2 signalling was the most enriched pathway in model 2 (continuous exposure). A Benjamini-Hochberg correction was applied to the pathways identified to reduce the false positive pathways identified.
Fig. 5
Fig. 5
Measurement of key components of eIF2 signalling pathway. A Diagram of the eIF2α signalling pathway. During cellular stress, BiP binds to misfolded proteins and dissociates from PERK leading to PERK autophosphorylation and activation. Phosphorylated PERK (p-PERK) phosphorylates eIF2α resulting in global reduction of protein synthesis and increased translation of ATF4 (both of which alleviate ER stress) and, depending on the context, increased ATF4-dependent transcription of CHOP (which induces apoptosis). B Representative western blot showing levels of BiP, p-PERK, unphosphorylated PERK (uPERK), phosphorylated eIF2α (p-eIF2α), total eIF2α and β-actin in sensitive and resistant model 2 HG-3 cells following 24 h exposure to 3µM fludarabine or DMSO control. Untreated HeLa cells were used as a positive control for BiP, uPERK and total eIF2α and a negative control for p-PERK and p-eIF2α, whereas HeLa cells treated with calyculin A (a phosphatase inhibitor) were used as a positive control for p-PERK and p-eIF2α. The uncropped images are shown in Supplementary Fig. 5. C Bar charts showing levels of BiP and PERK relative to β-actin as measured by densitometry (n = 3). Statistical significance was assessed using the ratio paired t-test. S: sensitive cells; R: resistant cells; D: DMSO treated; F: fludarabine treated.
Fig. 6
Fig. 6
Effect of inhibition of PERK on the drug-induced killing of fludarabine-sensitive and resistant model 2 HG-3 cells. Cells were incubated with 1µM GSK2606414 for six hours before adding fludarabine (3µM), venetoclax (ABT-199, 1µM) or DMSO control (0.1%). Due to the short half-life of GSK2606414, the drug was replenished every 24 h to maintain its inhibitory effect. A Western blot showing the effect of PERK inhibition measured at six hours. UT: untreated (0.1% DMSO). A box was put around UT condition for PERK blot as other concentrations were cropped out. B Fludarabine-induced killing of sensitive and resistant model 2 cells in the presence or absence of GSK2606414 for 72 h (left panel). Venetoclax-induced killing of sensitive model 2 cells in the presence or absence of GSK2606414 for 72 h (right panel). The percentage increase in cell killing of the resistant and sensitive cells lines following PERK inhibition are also shown for fludarabine and Venetoclax (bottom graphs) All experiments were conducted in biological triplicates. Statistical significance was assessed using the paired or unpaired t-test, as appropriate. ns: non-significant.

References

    1. Surveillance, Epidemiology, and End Results (SEER) Program of the National Cancer Institute. Cancer Stat Facts: Leukemia—Chronic Lymphocytic Leukemia (CLL) – 2022, https://seer.cancer.gov/statfacts/html/clyl.html.
    1. Hallek, M. et al. Addition of rituximab to fludarabine and cyclophosphamide in patients with chronic lymphocytic leukaemia: a randomised, open-label, phase 3 trial. Lancet376, 1164–1174. 10.1016/S0140-6736(10)61381-5 (2010). - PubMed
    1. Wierda, W. et al. Chemoimmunotherapy with fludarabine, cyclophosphamide, and rituximab for relapsed and refractory chronic lymphocytic leukemia. J. Clin. Oncol.23, 4070–4078. 10.1200/JCO.2005.12.516 (2005). - PubMed
    1. Brown, J. R. The treatment of relapsed refractory chronic lymphocytic leukemia. Hematol. Am. Soc. Hematol. Educ. Program2011, 110–118 10.1182/asheducation-2011.1.110 (2011). - PubMed
    1. Zenz, T. et al. Detailed analysis of p53 pathway defects in fludarabine-refractory chronic lymphocytic leukemia (CLL): dissecting the contribution of 17p deletion, TP53 mutation, p53-p21 dysfunction, and miR34a in a prospective clinical trial. Blood114, 2589–2597. 10.1182/blood-2009-05-224071 (2009). - PubMed

LinkOut - more resources