. 2025 Aug;57(8):1905-1921.
doi: 10.1038/s41588-025-02266-3. Epub 2025 Jul 28.

Deciphering state-dependent immune features from multi-layer omics data at single-cell resolution

Collaborators, Affiliations

Deciphering state-dependent immune features from multi-layer omics data at single-cell resolution

Ryuya Edahiro et al. Nat Genet. 2025 Aug.

Abstract

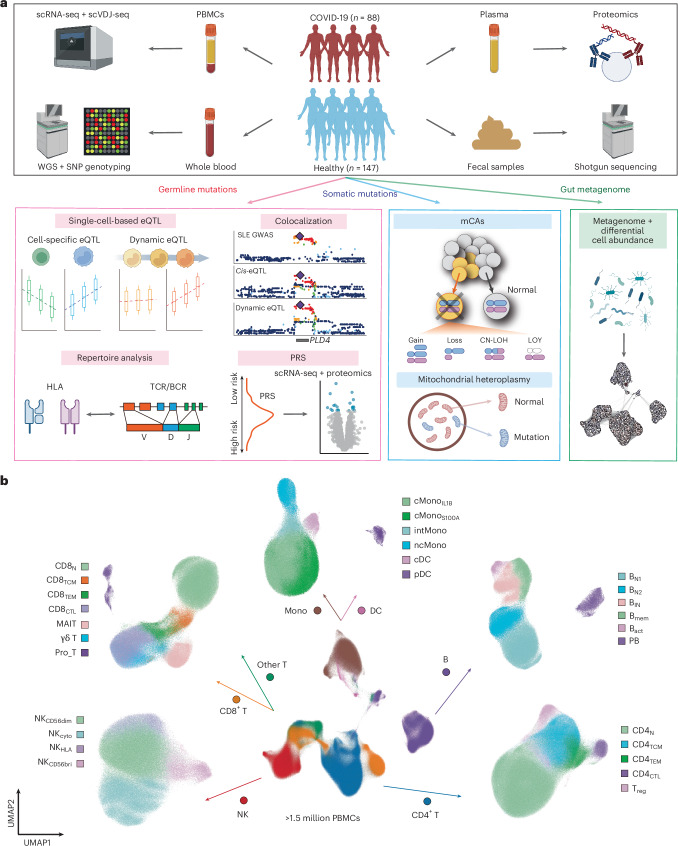
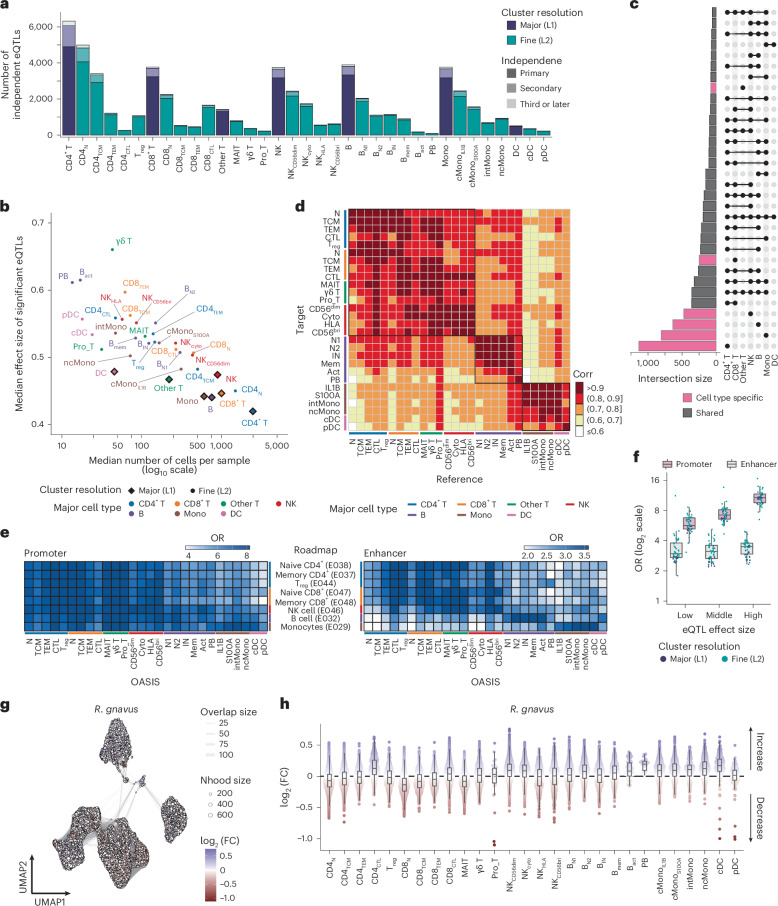
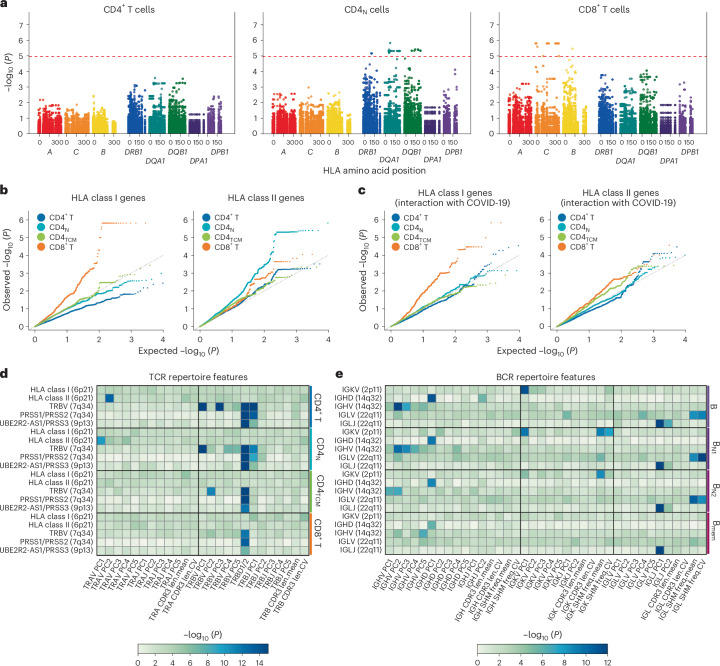
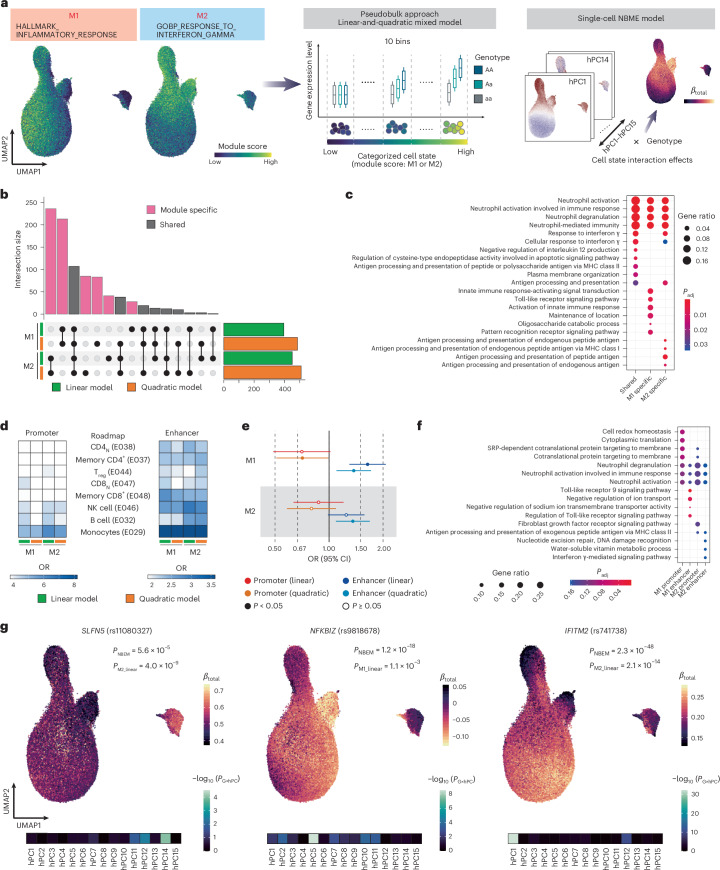
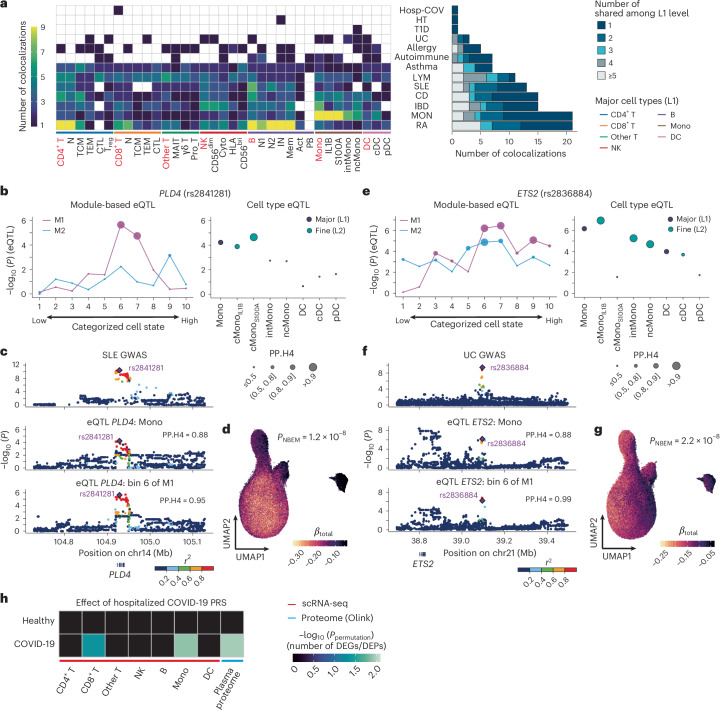
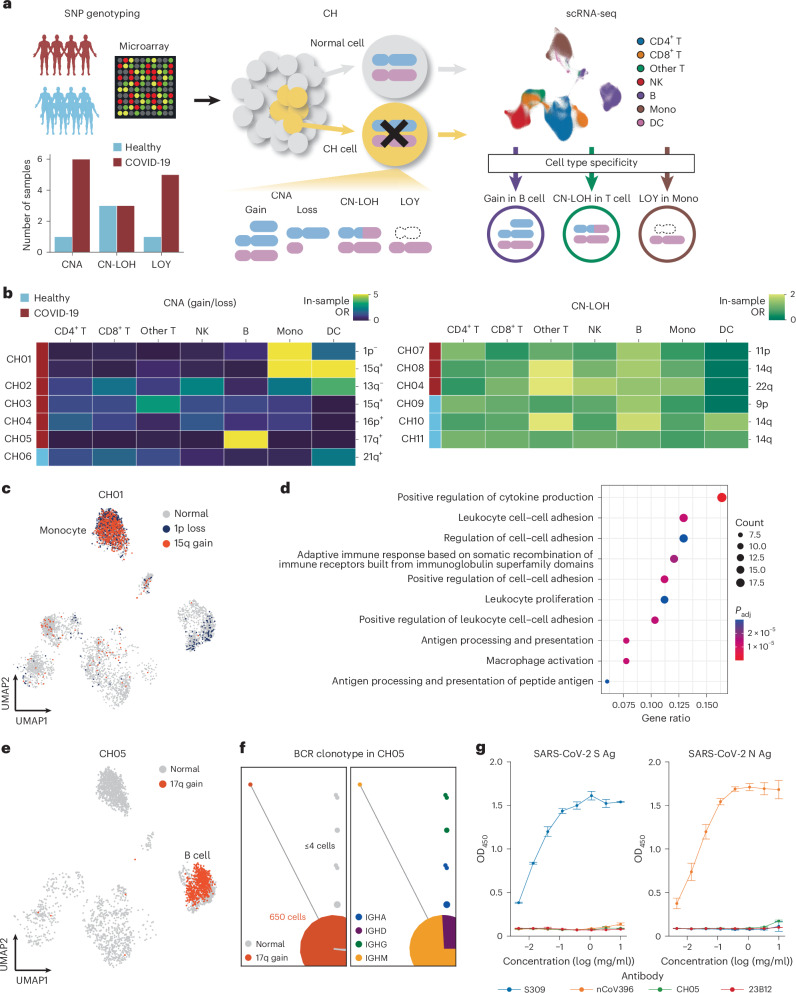
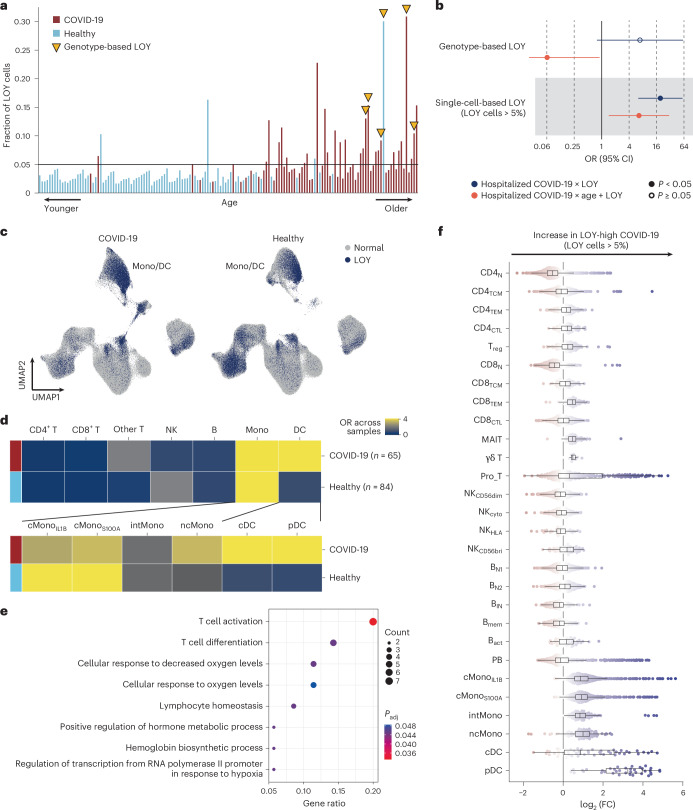
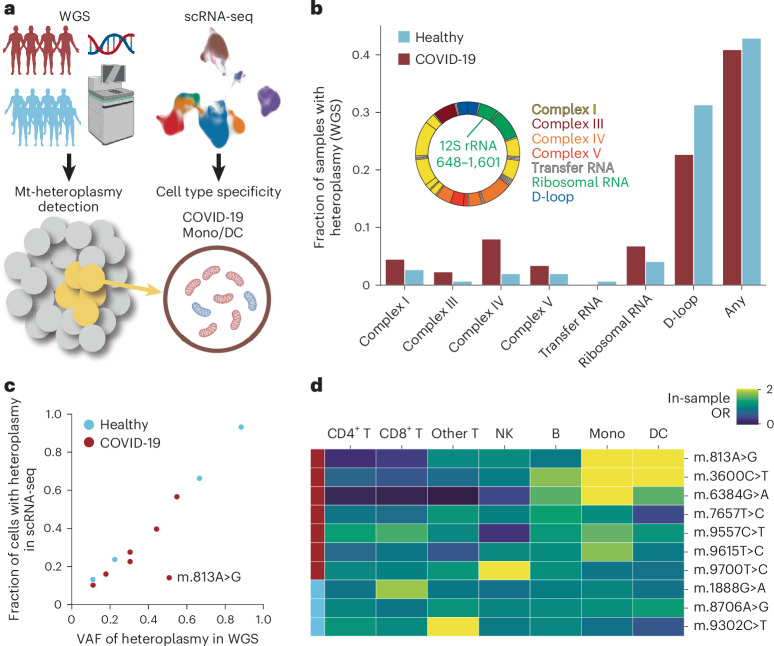
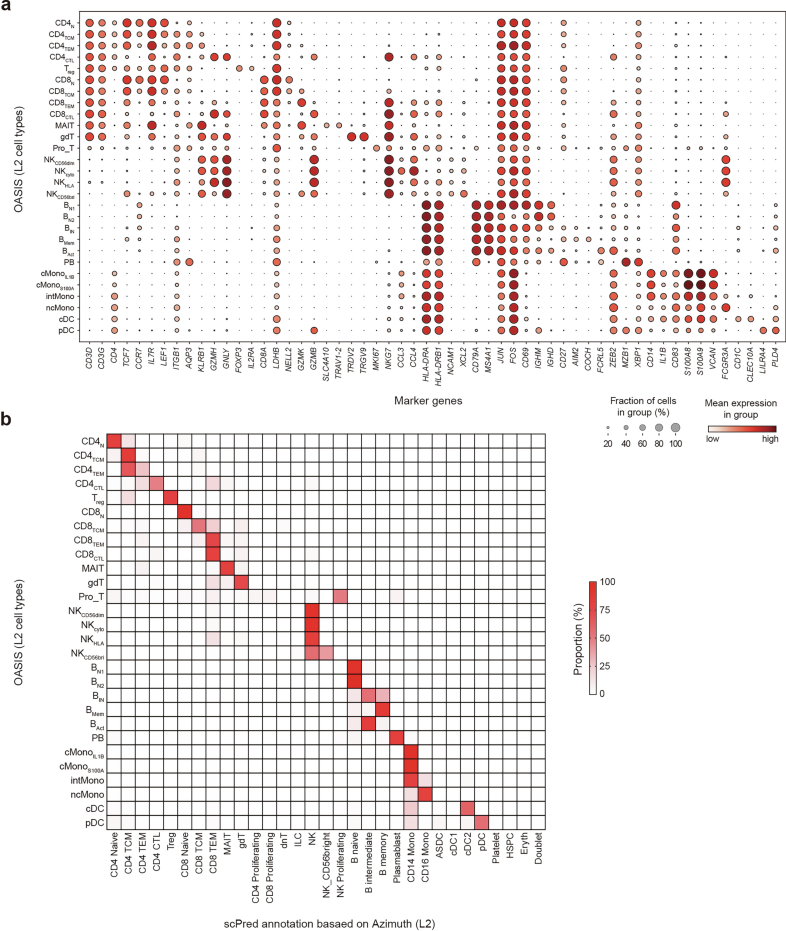
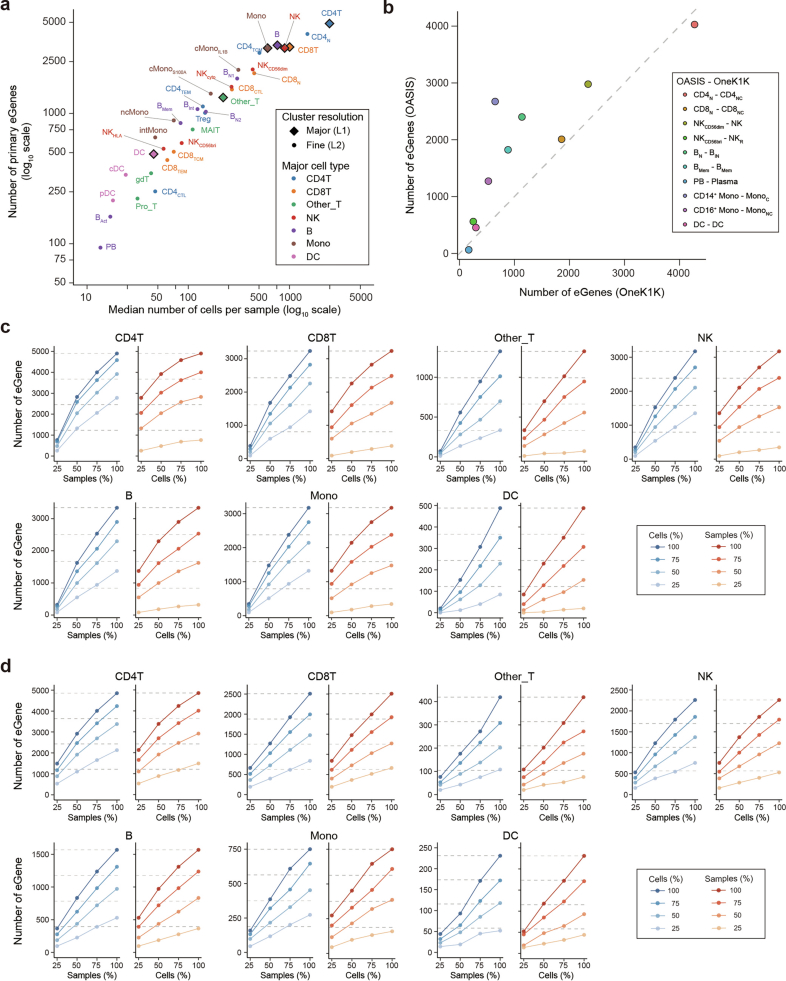
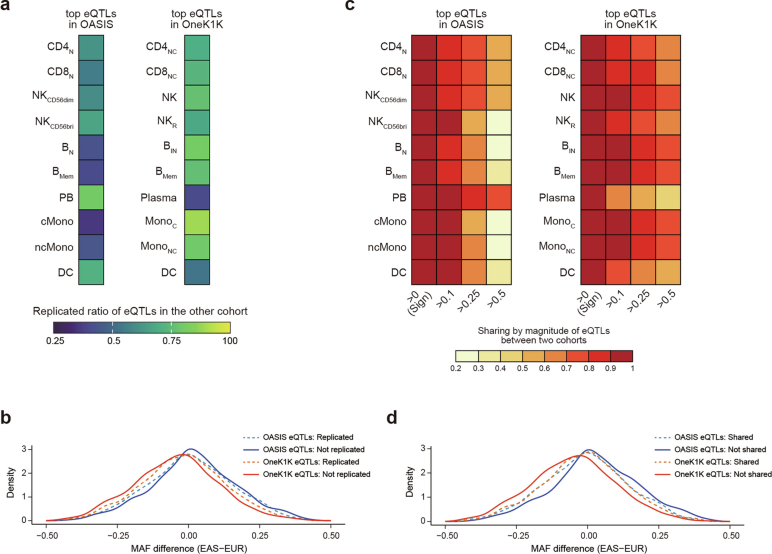
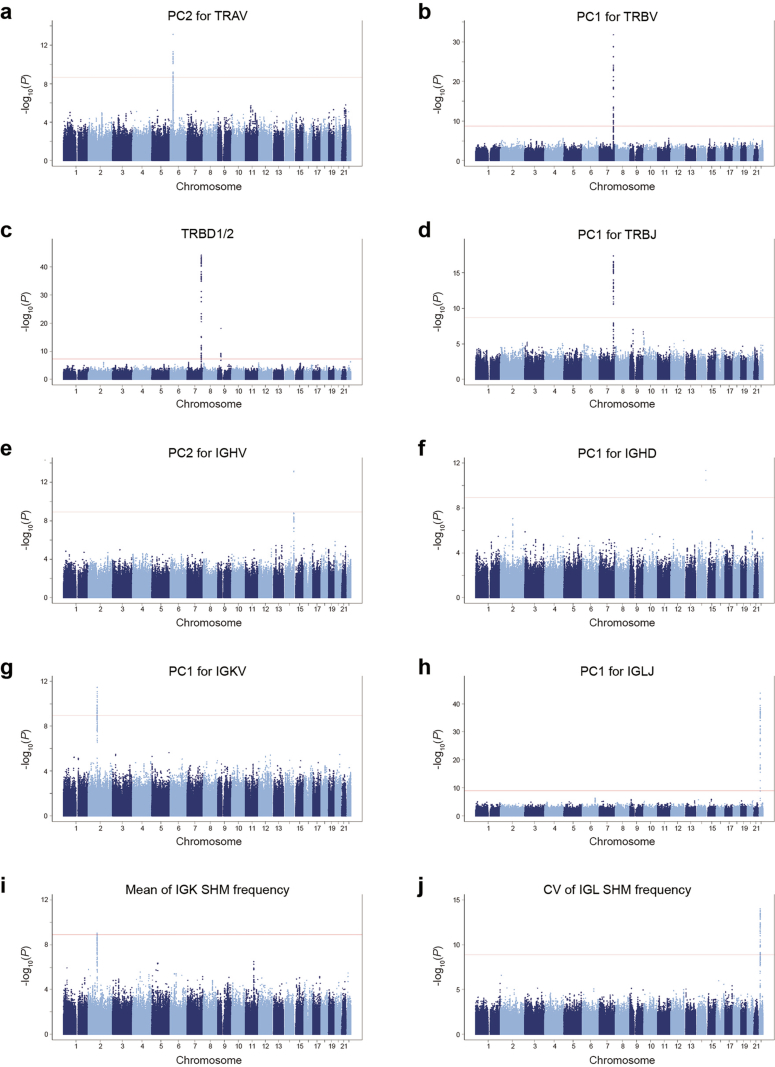
Current molecular quantitative trait locus catalogs are mostly at bulk resolution and centered on Europeans. Here, we constructed an immune cell atlas with single-cell transcriptomics of >1.5 million peripheral blood mononuclear cells, host genetics, plasma proteomics and gut metagenomics from 235 Japanese persons, including patients with coronavirus disease 2019 (COVID-19) and healthy individuals. We mapped germline genetic effects on gene expression within immune cell types and across cell states. We elucidated cell type- and context-specific human leukocyte antigen (HLA) and genome-wide associations with T and B cell receptor repertoires. Colocalization using dynamic genetic regulation provided better understanding of genome-wide association signals. Differential gene and protein expression analyses depicted cell type- and context-specific effects of polygenic risks. Various somatic mutations including mosaic chromosomal alterations, loss of Y chromosome and mitochondrial DNA (mtDNA) heteroplasmy were projected into single-cell resolution. We identified immune features specific to somatically mutated cells. Overall, immune cells are dynamically regulated in a cell state-dependent manner characterized with multiomic profiles.


Conflict of interest statement

Competing interests: The authors declare no competing interests.

Figures

Fig. 1
Fig. 1. Overview and scRNA-seq data of OASIS.
a, Overview of the study design. SLE, systemic lupus erythematosus. b, UMAP embedding of scRNA-seq data for 1,506,953 cells. Seven major cell types and 28 fine cell types were defined by RNA expression of marker genes (Extended Data Fig. 1a). Bact, activated B cell; Bmem, memory B cell; BN1, type 1 naive B cell; BN2, type 2 naive B cell; BIN, intermediate B cell; CD4CTL, CD4+ cytotoxic T celle; CD4TCM, CD4+ central memory T cell; CD4TEM, CD4+ effector memory T cell; CD8CTL, CD8+ cytotoxic T cell; CD8N, naive CD8+ T cell; CD8TCM, CD8+ central memory T cell; CD8TEM, CD8+ effector memory T cell; cDC, conventional dendritic cell; cMono, classical monocyte; cMonoIL1B, IL1B cMono; cMonoS100A, S100A cMono; intMono, intermediate monocyte; MAIT, mucosal-associated invariant T cell; Mono, monocyte; ncMono, non-classical monocyte; NK, natural killer cell; NKcyto, cytokine NK cell; pDC, plasmacytoid dendritic cell; Pro_T, proliferating T cell; Treg, regulatory T cell. Panel a created with BioRender.com.
Fig. 2
Fig. 2. Germline genetic variants and the gut metagenome affect transcriptional and phenotypic profiles of immune cells.
a, Number of significant independent eQTLs in each cell type of L1 and L2 levels. The bars are colored by cluster resolution (L1 or L2 level) and shaded by independence of eQTL mapping. DC, dendritic cell. b, Scatterplot depicting the correlation between median number of cells per sample and median effect size of significant eQTLs in each cell type. The x axis is on a log10 scale. c, Number of significant eGenes shared among cell types in the L1 level. eGenes identified in only one cell type are colored pink, and those in multiple cell types are connected by lines and colored gray. d, Heatmap showing a pairwise comparison of eQTL effect size. Only significant eQTLs in one cell type (reference) that could be evaluated in other cell types (target) were analyzed. e, Heatmap depicting the enrichment of primary significant eQTLs of L2 cell types in promoter or enhancer regions of eight representative immune cells from the Roadmap project. f, Box plot showing the enrichment of primary eQTLs in promoters or enhancers of the corresponding cell types (n = 28) from the Roadmap project, according to effect sizes (Methods). g, Graphical representation of neighborhoods identified by Milo in healthy individuals (n = 131). Nodes are neighborhoods, colored by log2 (fold change (FC)) by the relative abundance of R. gnavus adjusted for age, sex and sequencing groups. Sizes correspond to the number of cells in a neighborhood. Graph edges depict the number of cells shared between adjacent neighborhoods. Nhood, neighborhood. h, Beeswarm plot and box plot showing the distribution of adjusted log2 (FC) in neighborhoods (n = 43,089) by the relative abundance of R. gnavus among L2 cell types. Colors are represented in the same way as in g. Boxes denote the interquartile range (IQR), medians are shown as horizontal bars, and whiskers extend to 1.5 times the IQR in f,h. N, naive; TCM, central memory T cell; TEM, effector memory T cell; CTL, cytotoxic T cell; N1, type 1 naive; N2, type 2 naive; IN, intermediate; Cyto, cytokine; Act, activated; corr, correlation.
Fig. 3
Fig. 3. HLA and genome-wide association analysis with TCR and BCR repertoires.
a, Regional plots for HLA association with TRAV gene usage in CD4+ T (left), CD4N (center) and CD8+ T (right) cells. In each plot, −log10 (P values) for the association tests between amino acid variants of each HLA gene and all tested TRAV gene usages are shown along with the horizontal axis representing amino acid positions. The dashed red horizontal line represents the study-wide P-value significance threshold. b,c, Quantile–quantile plots for the association (b) and interaction (c) tests between HLA amino acid variants and TRAV gene usage in HLA class I (left) and II (right) genes in different cell types. Vertical and horizontal axes indicate the observed and expected –log10 (P values) for the tests. d,e, Heatmaps show the maximum values of −log10 (P values) for the association tests for repertoire features (horizontal axes) within individual loci (vertical axes) for TCR (d) and BCR (e) repertoires. The position range for each locus is determined by the gene body for individual genes and the uppermost and lowermost gene bodies for multiple genes or gene clusters. Only loci that exhibited significant associations with a feature in at least one cell type are displayed. Uncorrected P values from two-sided tests are shown in ae. CV, coefficient of variation; freq, frequency; len, length.
Fig. 4
Fig. 4. Dynamic eQTL analysis in the myeloid cluster.
a, Overview of dynamic eQTL analysis. We calculated the two module scores using a gene set termed ‘HALLMARK_INFLAMMATORY_RESPONSE’ and ‘GOBP_RESPONSE_TO_ INTERFERON_GAMMA’ (GO:0034341), respectively (left). Cells were split into ten windows of equal cell numbers according to each module score (middle). The figure design is based on a previous report. A linear-and-quadratic mixed model was applied to test for an interaction between genotypes and module scores by the pseudobulk approach. The single-cell negative binomial mixed-effect (NBME) model was used to identify cell state-dependent regulatory effects (right). Module 1, M1; module 2, M2. b, Number of eGenes with a significant genotype–module interaction (that is, dynamic eGenes) in a linear or quadratic mixed model for the two modules. c, Top ten biological processes by gene ontology (GO) enriched in dynamic eGenes are shown for each test. MHC, major histocompatibility antigen; Padj, adjusted P value. d, Heatmap depicting the enrichment of dynamic eQTLs in promoter or enhancer regions of eight representative immune cells from the Roadmap project for each combination of module and analysis model. e, Forest plots showing ORs of the overlap of dynamic eQTLs (n = 396–510; Supplementary Table 15) with functional regions in monocytes from Roadmap compared to cis-eQTLs in monocytes at L1 (n = 3,175) for each combination of functional region and analysis model in two modules. Dots represent ORs, and bars represent 95% confidence intervals (CIs). f, Top four biological processes by GO enriched in dynamic eGenes, where dynamic eQTLs, but not cis-eQTLs, are located in functional regions of monocytes from Roadmap, are shown for each module-function combination (four tests in total). g, UMAPs represent the cell state-dependent eQTL strength (βtotal) for each cell calculated as a sum of the effect sizes of genotype and genotype (G) × harmonized PCs (hPCs). Labeled P values are derived from NBME and pseudobulk analysis. Heatmap showing P values for each genotype–hPC interaction in the full model of NBME analysis. Two-sided P values are uncorrected in e,g. Dot color indicates statistical significance of the enrichment (adjusted P values via the Benjamini–Hochberg method), and dot size represents the gene ratio assigned to each term in c,f.
Fig. 5
Fig. 5. Interpretation of GWAS results using OASIS data.
a, Number of GWAS loci significantly colocalized with an eQTL for each cell type–trait combination (left). Cell types of the major cell type (L1) are colored red. Number of GWAS loci colocalized with an eQTL and how many times the colocalization was shared among major cell types for each trait (right). GWAS abbreviations: CD, Crohn’s disease; Hosp-COV, hospitalized COVID-19; HT, hyperthyroidism; IBD, inflammatory bowel diseases; LYM, lymphocyte count; MON, monocyte count; RA, rheumatoid arthritis; T1D, type 1 diabetes; UC, ulcerative colitis. b, Dynamic eQTLs and cis-eQTLs per cell type of rs2841281 for PLD4. Dot size represents PP.H4 of eQTL–GWAS colocalizations. c, Regional association plots of systemic lupus erythematosus GWAS, cis-eQTL of monocytes (L1) and dynamic eQTLs in bin 6 of module 1 for the PLD4 locus. Chr, chromosome. d, UMAP represents cell state-dependent eQTL strength (βtotal) for each cell calculated as a sum of the effect sizes of genotype and genotype × hPCs. Labeled P values are derived from NBME analysis. e, Dynamic eQTLs and cis-eQTLs per cell type of rs2836884 for ETS2. f, Regional association plots of ulcerative colitis GWAS, cis-eQTL of monocytes (L1) and dynamic eQTL in bin 6 of module 1 for the ETS2 locus. g, UMAP represents cell state-dependent eQTL strength (βtotal) for each cell. Uncorrected P values from two-sided tests are shown in bg. h, The effect of hospitalized COVID-19 PRS on transcriptomic and proteomic levels separately in patients with COVID-19 and healthy individuals. One-sided P values were calculated with 1,000 permutations for the number of differentially expressed genes (DEGs) and differentially expressed proteins (DEPs).
Fig. 6
Fig. 6. Single-cell deconvolution of mCAs.
a, Schematic overview of single-cell deconvolution of CH including mCAs and LOY by integrating SNP array and scRNA-seq data. b, Heatmaps showing in-sample ORs of each cell type containing cells with CNAs (left) and CN-LOHs (right). c, UMAP embedding of CH01 scRNA-seq data colored by three clones. d, Top ten enriched biological pathways of upregulated DEGs in monocytes of CH01 with 1p loss. Dot color indicates statistical significance of the enrichment (adjusted P values via the Benjamini–Hochberg method), and dot size represents the gene count assigned to each term. e, UMAP embedding of CH05 scRNA-seq data colored by two clones. f, Network plots showing the similarity of complementarity-determining region 3 (CDR3) amino acid sequences in BCR heavy and light chains of CH05 colored by clone (left) and isotype (right). Clonotype clusters with clonal size >1 are selected. g, Reactivity of antibodies against SARS-CoV-2 antigens (Ag) in enzyme-linked immunosorbent assays. Dots denote mean, and error bars show s.d. measured in triplicate. S309, anti-SARS-CoV-2 S immunoglobulin G (IgG)1; CH05, recombinant antibody derived from the CH05 BCR clonotype with 17q gain; nCoV396, anti-SARS-CoV-2 N IgG1; 23B12, anti-Candida albicans IgG1; OD450, optical density at 450 nm. Panel a created with BioRender.com.
Fig. 7
Fig. 7. Biological effects of mosaic LOY.
a, Fractions of cells with LOY in each male sample sorted by age (x axis). Yellow triangles denote samples with LOY detected using SNP array data. b, Forest plot of associations between LOY and COVID-19 risk. ORs of hospitalized COVID-19 were calculated using univariate logistic regression and multivariate logistic regression to account for the effect of age. Dots represent ORs, and bars represent 95% confidence intervals. We used uncorrected P values from two-sided tests. c, UMAP embeddings of PBMCs from patients with COVID-19 (left) and healthy individuals (right) colored according to the presence of LOY. d, Heatmaps showing ORs across samples of each cell type containing cells with LOY in patients with COVID-19 and healthy individuals. e, Enriched biological pathways of upregulated DEGs in cells with LOY compared to normal cells with cMonoIL1B cells of patients with COVID-19 and healthy individuals. Dot color indicates statistical significance of the enrichment (adjusted P values via the Benjamini–Hochberg method), and dot size represents the gene count assigned to each term. f, Beeswarm plot and box plot describing the distribution of adjusted log2 (fold change (FC)) values between LOY-high and LOY-low samples from patients with COVID-19 in neighborhoods (n = 12,141) from L2 cell types. Nodes are neighborhoods, colored by their log2 (FC) adjusted by age and sequencing group. Boxes denote the IQR, medians are shown as vertical bars, and whiskers extend to 1.5 times the IQR.
Fig. 8
Fig. 8. The landscape of mitochondrial heteroplasmy.
a, Schematic overview of single-cell deconvolution of mt-heteroplasmy by integrating WGS and scRNA-seq data. b, Fractions of samples with mt-heteroplasmy detected using WGS data by mtDNA region. Mitochondrial gene positions are indicated in the Circos plot. rRNA, ribosomal RNA. c, Correlations between the fractions of cells with heteroplasmy in scRNA-seq data and VAFs of heteroplasmy in WGS data. d, Heatmap showing in-sample ORs of each cell type containing cells with mt-heteroplasmy. Panel a created with BioRender.com.
Extended Data Fig. 1
Extended Data Fig. 1. Expression of cell type marker genes and reference-based annotation.
(a) Dotplot showing the RNA expression of marker genes of L2 cell types. (b) Comparison of our manual PBMC annotation (L2 cell types) vs an automated annotation performed by scPred with Azimuth (L2) as a reference.
Extended Data Fig. 2
Extended Data Fig. 2. The effect of sample sizes and cell counts per sample on eQTL discovery in OASIS and OneK1K.
(a) Scatter plot depicting the correlation between median number of cells per sample and number of detected significant eGenes in each cell type of OASIS. Both x-axis and y-axis are on log10 scale. (b) Co-plots of the number of eGenes between OASIS and OneK1K in corresponding cell types. (c,d) The number of eGenes by down-sampling for combinations of sample sizes and cell counts per sample in OASIS (c) and OneK1K (d) at L1 level.
Extended Data Fig. 3
Extended Data Fig. 3. Comparison of cis-eQTLs between OASIS and OneK1K in the corresponding 10 cell type pairs.
(a) The replicated ratio of eQTLs between the two cohorts in the corresponding 10 cell type pairs. (b) Distribution of difference of minor allele frequency (MAF) between East Asian (EAS) and European (EUR) of cis-eQTLs according to with/without cross-population eQTL replication for each cohort in naive CD4+ T cells. (c) Pairwise sharing by magnitude of eQTLs between the two cohorts in the corresponding 10 cell type pairs according to four thresholds of factor. (d) Distribution of difference of MAF between EAS and EUR of cis-eQTLs according to with/without cross-population eQTL sharing for each cohort in naive CD4+ T cells. MAF from both ancestries was calculated from high-coverage 1000 Genome Project phase 3 in (b) and (d).
Extended Data Fig. 4
Extended Data Fig. 4. Genome-wide association analysis for TCR/BCR repertoire features.
Manhattan plots for the representative results for genome-wide association analysis for TCR/BCR repertoire features, including PC2 for TRAV gene usage (a), PC1 for TRBV gene usage (b), TRBD1/2 usage (c), and PC1 for TRBJ gene usage (d) as TCR features in CD4+ T cells and PC2 for IGHV gene usage (e), PC1 for IGHD gene usage (f), PC1 for IGKV PC1 (g), and PC1 for IGLJ gene usage (h) in entire B cells and mean of somatic hypermutation (SHM) in IGK (i) and CV of SHM in IGL (J) in naive1 B cells as BCR features. The red horizontal line indicates the study-wide significance threshold (P = 2.0 × 10⁻⁹ and 1.6 × 10⁻⁹ for TCR and BCR repertoire features, respectively). Uncorrected P values from the GWAS analysis are shown in (a-j).
Extended Data Fig. 5
Extended Data Fig. 5. Properties of dynamic eQTLs and pathways representing cell-state of each PC.
(a) Number of genes with a significant or non-significant genotype-module interaction in a linear or quadratic mixed model for the two gene modules. (b) Distribution of the number of significant dynamic eGenes in 1,000 times permuted data for each combination of modules and analysis models. Pink dotted line represents the number of dynamic eGenes observed. (c) Forest plots showing odds ratios of overlap of dynamic eQTLs with functional regions in Monocytes from Roadmap project compared to cis-eQTLs in L2 cell types of myeloid cluster for each combination of functional region and analysis model. Dots represent the odds ratios and bars represent the 95% confidence intervals. Two-sided P values are uncorrected. (d) The top 3 enriched pathways of the genes which were correlated with each PCs ( > 0.1 absolute value). Dot color indicates the statistical significance of the enrichment (adjusted P values via the Benjamini–Hochberg method), and dot size represents gene ratio annotated to each term.
Extended Data Fig. 6
Extended Data Fig. 6. Colocalizations of GWASs in East Asian population and cis-eQTLs in OASIS.
(a) Number of colocalizing eGenes shared among different autoimmune and blood-related traits. Bar plots indicating the number of genes in each set. eGenes colocalizing in only one trait are colored by pink, and those in multiple traits are connected by lines and colored by gray. (b) Colocalizations of GWAS variants in East Asian population and cis-eQTLs in OASIS for 6 traits with more than 10 colocalizations. Heatmap depicting PP.H4 from coloc. Cell types of major cell type (L1) are colored by red. GWAS abbreviations: CD, Crohn’s disease; Hosp-COV, hospitalized COVID-19; HT, hyperthyroidism; IBD, inflammatory bowel diseases; LYM, lymphocyte count; MON, monocyte count; RA, rheumatoid arthritis; SLE, systemic lupus erythematosus; T1D, type 1 diabetes; UC, ulcerative colitis.
Extended Data Fig. 7
Extended Data Fig. 7. The effects of polygenic risk score on transcriptome and proteome.
(a) The differential gene expression analysis with 4 quantiles of hospitalized COVID-19 polygenic risk score (PRS) in monocytes separately for COVID-19 patients and healthy subjects. Differentially expressed genes (DEGs; FDR < 0.1) are colored in light blue and labeled by gene symbols if P values < 1×10⁻⁴. (b) The differential protein expression analysis with 4 quantiles of hospitalized COVID-19 PRS in plasma proteome separately for COVID-19 patients and healthy subjects. Differentially expressed proteins (DEPs; FDR < 0.1) are colored in light blue. (c) The differential gene expression analysis with 4 quantiles of hospitalized COVID-19 PRS in monocytes for all samples. DEGs between patients and healthy controls (FDR < 0.05 and absolute fold change (FC) > 2) are colored in red. (d) The differential protein expression analysis with 4 quantiles of hospitalized COVID-19 PRS in plasma proteome for all samples. Top 250 significant DEPs between patients and healthy controls (FDR < 4.0×10⁻²²) are colored in red. Uncorrected P values are shown in (a-d). (e) The effect of PRS for 7 autoimmune and blood-related traits on transcriptomics and proteomics levels separately in patients with COVID-19 and healthy subjects. One-sided P values were calculated with 1,000 permutations for number of DEGs and DEPs. GWAS abbreviations: CD, Crohn’s disease; IBD, inflammatory bowel diseases; LYM, lymphocyte count; MON, monocyte count; RA, rheumatoid arthritis; SLE, systemic lupus erythematosus; UC, ulcerative colitis.
Extended Data Fig. 8
Extended Data Fig. 8. Characterization of the cells carrying mCAs.
(a) Fractions of the mutant cells carrying each copy number alterations (CNA) event (left) and those of the mutant cells carrying each copy-neutral loss of heterozygosity (CN-LOH) event colored by setting of sequencing (right). (b) Heatmaps showing the in-sample odds ratios of each subcluster (L2) containing the CNA cells in CH01 (top) and CH05 (bottom). (c) Differential gene expression (DEG) analysis between the somatically mutant and normal cells for 1p_Loss monocytes (left), 15q_Gain monocytes (middle), and 17q_Gain B cells (right). DEGs are colored in light blue (downregulated) or pink (upregulated), and DEGs on the corresponding chromosomal regions are colored in navy or red. DEGs were significant if they satisfied FDR (adjusted P values via the Benjamini-Hochberg method) < 0.05 and log2 fold change > 0.25 (in CH01) or 0.5 (in CH05). (d-g) Top ten enriched biological pathways of the downregulated DEGs in 1p_Loss monocytes (d), the downregulated DEGs in 15q_Gain monocytes (e), the downregulated DEGs in 17q_Gain B cells (f), and the upregulated DEGs in 17q_Gain B cells (g). Dot color indicates the statistical significance of the enrichment (adjusted P values via the Benjamini-Hochberg method), and dot size represents gene count annotated to each term.
Extended Data Fig. 9
Extended Data Fig. 9. BCR clonotype of the somatically mutant cells in CH05.
(a) Network plots showing the similarity of CDR3 amino acid sequence in BCR heavy and light chain from all the samples (n = 235), colored by sample (left), cell type (middle), and isotype (right). The somatically mutated CH05 clonotype was surrounded by a plink dotted line. Clonotype clusters with clonal size ≥ 10 are selected. (b) Reactivity of antibodies against SARS-CoV-2 antigens in ELISA. The dots denote the mean and error bars do standard deviation measured in triplicate. S309, anti-SARS-CoV-2 S IgG1; CH05, recombinant antibody derived from the CH05 BCR clone; nCoV396, anti-SARS-CoV-2 N IgG1; 23B12, anti-Candida albicans IgG1.
Extended Data Fig. 10
Extended Data Fig. 10. Characterization of the LOY cells.
(a) Differential expression gene (DEG) analysis between the loss of the Y chromosome (LOY) and normal cMonoIL1B. DEGs were significant if they satisfied FDR (adjusted P values via the Benjamini-Hochberg method) < 0.01 and beta > 0.25 and colored in light blue (downregulated) or pink (upregulated). (b) Beeswarm plot and box plot describing the distribution of adjusted log2 fold change between the LOY high and LOY low healthy controls in neighborhoods from 28 cell types (L2). Nodes are neighborhoods, colored by their log2 fold change adjusted by age and sequencing group. (c) Box plots showing the proportions of each cell type in the LOY high and LOY low COVID-19 patients. Wilcoxon two-sided uncorrected P values are shown if they satisfied < 0.05. The boxes denote the interquartile range (IQR), the median is shown as the vertical bars, and the whiskers extend to 1.5 times the IQR in (b,c).

Similar articles

References

    1. Aguet, F. et al. Molecular quantitative trait loci. Nat. Rev. Methods Primers3, 5 (2023).
    1. Aguet, F. et al. Genetic effects on gene expression across human tissues. Nature550, 204–213 (2017). - PMC - PubMed
    1. Strober, B. J. et al. The GTEx Consortium atlas of genetic regulatory effects across human tissues. Science18, 1318–1330 (2020). - PMC - PubMed
    1. Sun, B. B. et al. Plasma proteomic associations with genetics and health in the UK Biobank. Nature622, 329–338 (2023). - PMC - PubMed
    1. Qin, Y. et al. Combined effects of host genetics and diet on human gut microbiota and incident disease in a single population cohort. Nat. Genet.54, 134–142 (2022). - PMC - PubMed