. 2025 Jul 28;16(1):6923.
doi: 10.1038/s41467-025-61897-6.

Inhibition of HDAC6 alters fumarate hydratase activity and mitochondrial structure

Affiliations

Inhibition of HDAC6 alters fumarate hydratase activity and mitochondrial structure

Andrew Roe et al. Nat Commun. .

Abstract

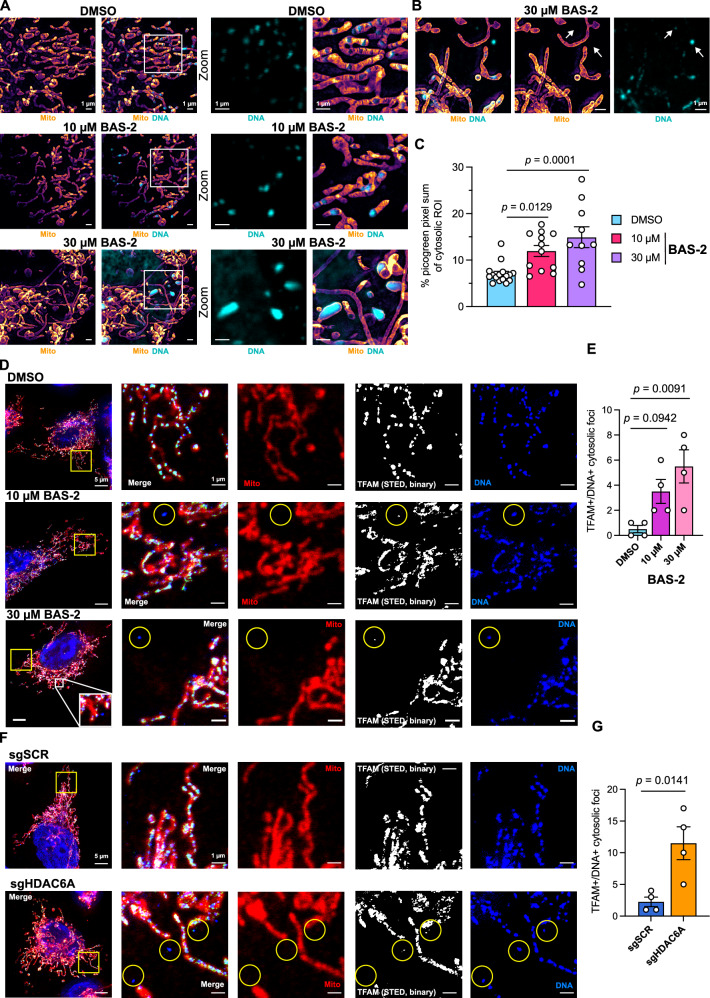
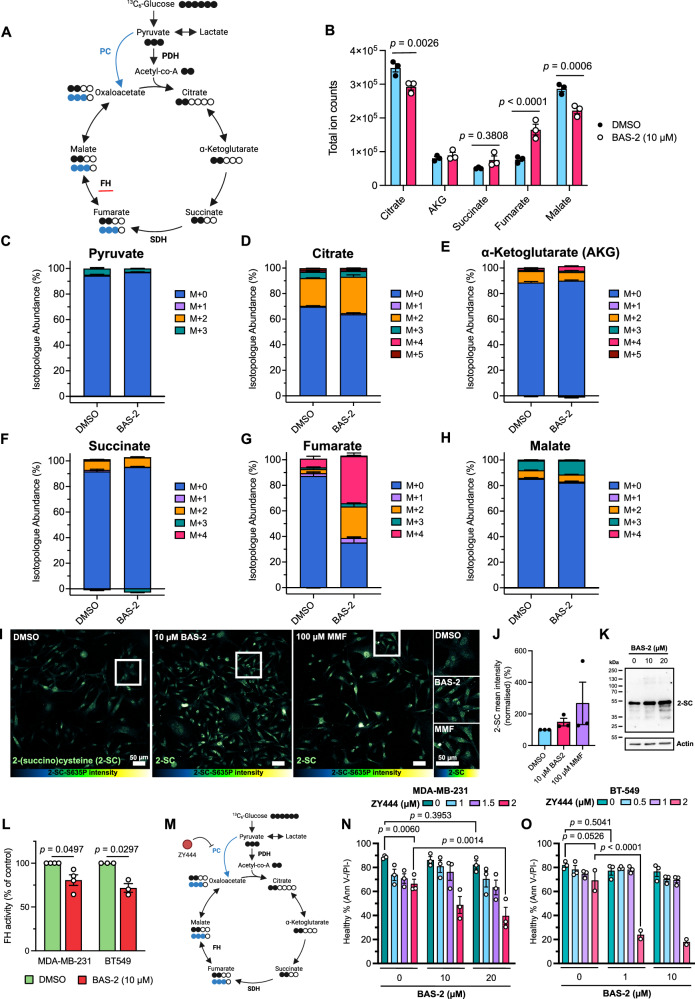
Fumarate hydratase (FH), a key node of mitochondrial metabolism, is also a tumour suppressor. Despite its prominent roles in tumourigenesis and inflammation, its regulation remains poorly understood. Herein, we show that histone deacetylase 6 (HDAC6) regulates FH activity. In triple-negative breast cancer cells, HDAC6 inhibition or knockdown results in alterations to mitochondrial cristae structure, as detected by live-cell super-resolution STED nanoscopy and electron microscopy, along with the release of mitochondrial DNA. Mass-spectrometry immunoprecipitation reveals multiple mitochondrial HDAC6-interactors, with FH emerging as a top hit. Super-resolution 3D-STORM shows HDAC6 interactions with FH in mitochondrial networks, which increases after perturbation of HDAC6 activity with BAS-2. Treatment with BAS-2 leads to fumarate accumulation by 13C glucose labelling, along with downstream succination of proteins and cell death. Together, these results identify HDAC6 inhibition as a regulator of endogenous FH activity in tumour cells, and highlight it as a promising candidate for indirectly targeting tumour metabolism.


Conflict of interest statement

Competing interests: The authors declare no competing interests.

Figures

Fig. 1
Fig. 1. Targeting HDAC6 activity in TNBC cells results in mitochondrial enlargement and cristae clearance.
A Representative transmission electron microscopy (TEM) images of MDA-MB-231 cells after treatment with 10 µM or 30 µM BAS-2 for 48 h. Upper panels represent whole-cell view and lower panels represent subsequent zoomed regions, as indicated by white dotted-line boxes. B Cross-sectional area of mitochondria manually traced from TEM images. Each grey circle represents a single mitochondrion. Data from 150-180 mitochondria from 5-8 cells per condition and one biological replicate. Significance assessed by one-way ANOVA and multiple comparisons to DMSO control. C Proportions of mitochondrial clearance visually graded as described in methods. D MitoTracker Green FM signal of MDA-MB-231 (MDA231) or BT-549 cells after treatment with BAS-2 for 24 h by flow cytometry. Data from 4-8 technical replicates from 2-4 biological repeats. Significance assessed by one-way ANOVA and multiple comparisons against each DMSO control. Bars show mean ± SEM. E Validation of HDAC6 K/D mixed populations using HDAC6-targeting guides A or B using CRISPR/Cas9 in MDA-MB-231 cells by Western blot. F Representative TEM images of MDA-MB-231 HDAC6 K/D (sgHDAC6A) or control scramble (sgSCR) cells. G Cross-sectional area and H mitochondrial cristae clearance of MDA-MB-231 HDAC6 K/D cells. Data from 170–270 mitochondria from 10-12 cells per condition and one biological replicate. Scale bars indicate 1 µm. Box-and-whisker boxes show 25th to 75th percentiles with the median at the centre, and whiskers indicate the range of minimum to maximum values. Significance assessed by one-way ANOVA comparing to DMSO or sgSCR. Source data are provided as a Source Data file.
Fig. 2
Fig. 2. Treatment with the HDAC6 inhibitor, BAS-2, caused live-cell mitochondrial cristae disruption by super-resolution imaging and resulted in mtDNA extrusion.
A Live-cell super-resolution images (STED) of BT-549 mitochondria using the mitochondrial membrane stain PKMito Orange (PKMO, orange) and DNA dye picogreen (cyan) after BAS-2 treatment for 24 h. Scale bars show 1 µm. B Representative images of high-dose (30 µM) BAS-2 treatment cytosolic DNA foci. Scale bars show 1 µm. C Non-nuclear picogreen pixel sum intensities as a proportion of the area quantified from live-cell super-resolution images. Points represent a single image’s picogreen channel pixel sum intensity. Data show 10-16 technical replicates (images) across 3 independent experiments. Bars represent mean ± SEM. D Representative fixed confocal images of MDA-MB-231 cells after 24 h treatment of BAS-2 stained with MitoTracker DeepRed FM, TFAM with anti-rabbit IgG Alexa Fluor568 (AF568), and DNA (Progen) with anti-mouse IgM Alexa Fluor488 (AF488). MitoTracker and DNA-AF488 signals were acquired using standard confocal and TFAM-AF568 was acquired using STED depletion. Merged images show TFAM-AF568 signal as green, and binary threshold panels (STED, binary) show TFAM signal in white. E TFAM + /DNA + /MitoTracker- foci quantified. Data from 4 technical replicates (images/regions) and one biological repeat. Bars show mean ± SEM. F, G As D, E with MDA-MB-231 HDAC6 K/D (sgHDAC6A) and control (sgSCR). Data from 4 technical replicates (images/regions) and one biological repeat. Bars show mean ± SEM. Significance assessed by two-sided unpaired t-test to sgSCR control or one-way ANOVA with multiple comparisons to DMSO. Scale bars show 1 µm or 5 µm (D and F, left panels). Source data are provided as a Source Data file.
Fig. 3
Fig. 3. HDAC6 inhibition with BAS-2 increases mtROS that leads to cell death and disruption to mitochondrial cristae structure in TNBC cells.
A Representative confocal images of live BT-549 cells after treatment with BAS-2 (10 µM and 30 µM) for 24 h stained with MitoSOX Red to indicate mitochondrial ROS. Lower panels show zoomed regions as indicated by yellow boxes. Scale bars show 10 µm (upper panels) and 1 µm (lower). MitoSOX Red intensity is max-adjusted and coloured using the ‘Royal’ colour map in ImageJ/FIJI of the scale (left to right) 0-100%. B Quantification of live-cell confocal images of BT-549 cells after BAS-2 treatment (24 h) where points represent mean pixel intensity of MitoSOX red channel from segmented cell regions. Data show 5-11 technical replicates (segmented cell regions) from one biological replicate. C Representative histograms of MitoSOX Red signal from MDA-MB-231 or BT-549 cells after 24 h BAS-2 treatment. D MitoSOX Red mean fluorescence intensity (MFI) of BT-549 and MDA-MB-231 cells after 24 h treatment with BAS-2 normalised to DMSO controls (n = 3 independent experiments). Bars represent mean ± SEM. E Cell death in MDA-MB-231 cells after pre-treatment with the mitochondrial ROS scavenger MitoTEMPO for 1 h and subsequent treatment with BAS-2 for 24 h, as measured by Annexin V-FITC and propidium iodide (PI) staining, where cells negative for both were designated ‘healthy’. Values normalised to control and mean ± SEM graphed (n = 3 independent experiments). F Representative live-cell STED images of BT-549 cells after pre-treatment with MitoTEMPO (mtT, 50 µM), treatment with BAS-2 (10 µM) and staining with PKMO (300 nM, 30 min) for mitochondrial membrane (orange) or picogreen for DNA (cyan). Line profiles showing PKMO signal are shown below indicating the path of the white dotted arrows. Scale bars show 1 µm. PKMO intensity is max-adjusted and coloured using the ‘mpl-inferno’ colour map in FIJI/ImageJ of the scale (left to right) 0-100%. G Box-and-whisker plots showing mitochondrial diameters from 3 confocal images per condition (images not shown) of the treatments indicated (mtT, 50 µM; BAS-2, 10 µM) from one biological replicate. Plots represent the data from 4400-5500 automatically segmented mitochondria, 1000-2000 on average per confocal image. Mitochondria were analysed as described in methods using the Mitochondria Analyzer FIJI plugin. Diameters were measured on a per-mito basis. H Mean PKMO signal on a per-mito basis from 4400-5500 segmented mitochondria from 3 confocal images and one biological replicate. Box-and-whisker boxes show 25th to 75th percentiles with the median at the centre and whiskers indicate the range from minimum to maximum. Significance by one-way ANOVA. Source data are provided as a Source Data file.
Fig. 4
Fig. 4. HDAC6 interacts with multiple metabolic and mitochondrial proteins, including fumarate hydratase (FH).
A Schematic of mass-spectrometry-based immunoprecipitation of HDAC6 to determine interacting proteins. B Proportional localisation of interacting proteins above a probability threshold of -logp = 1.3 derived via two-tailed t-test HDAC6 IP vs IgG IP control as assessed using DAVID using the cell component descriptor. Created in BioRender. C Interactors of HDAC6 compared to IgG rabbit antibody control pulldown and -logp significance value derived via t-test HDAC6 IP vs IgG IP control; a selection of metabolic- and mitochondrial-associated proteins are highlighted in blue. D KEGG pathway analysis of HDAC6-interactors above the probability threshold (t-test HDAC6 IP vs IgG IP control, -logp > 0.3) with the top interactors in the ‘metabolic pathways’ subgroup shown to the right. DAVID combines KEGG pathway terms, such as different metabolic pathways, to reduce term redundancy. E Schematic of global proteomics experiment in MDA-MB-231 or JJN3 cells after 24 h treatment with 10 μM BAS-2. F KEGG pathway and cell component analysis of upregulated (blue) and downregulated (red) proteins after BAS-2 treatment in MDA-MB-231 cells. G Volcano plot of increased and decreased protein expression in MDA-MB-231 cells after BAS-2 treatment (10 µM, 24 h) by proteomics, showing log2(fold change) vs -log(probability [p]) derived via two-tailed t-test. A -log(p) cut-off of 1 is indicated by dotted lines, and a log2(fold change) of -1 or 1. Mitochondrial proteins are highlighted in red, and other significant proteins in blue. Source data are provided as a Source Data file.
Fig. 5
Fig. 5. HDAC6 inhibition affects TCA cycle metabolism in MDA-MB-231 cells.
A Diagram of the TCA cycle and 13C6-glucose stable isotope tracing. Associated number of carbons in each metabolite are shown as circles where filled circles represent 13C and clear circles endogenous 12C. Pyruvate carboxylase (PC) activity is shown in blue. Created in BioRender. B Total ion count values from MDA-MB-231 cells after 24 h treatment and acute, 30 m 13C6-glucose infusion. Values represent the total abundance detected of all unlabelled and labelled fractions. Three technical replicates are shown from one independent experiment. C–H Relative isotopologue abundances of each TCA cycle metabolite including pyruvate in the format M + x, where ‘x’ indicates the number of 13C carbons. I Representative immunofluorescence images of MDA-MB-231 cells after 24 h treatment with BAS-2 or monomethyl fumarate (MMF) using 2-succinocysteine (2-SC) antibody with anti-rabbit Star635P secondary to indicate protein succination. Images are max-adjusted and coloured using the ‘Green-Fire-Blue’ colour map in FIJI/ImageJ with values (left to right) 0-100%. Panels to the right show zoomed regions, as indicated by white boxes. Scale bars show 10 µm. J Cells were manually segmented and mean pixel intensity quantified. Points represent the normalised mean of three biological repeats. 40-50 technical replicates (segmented cell regions) per biological repeat were averaged and normalised to DMSO control. Significance by one-way ANOVA to DMSO, which was not significant (p > 0.05). K Representative Western blot from MDA-MB-231 cells after 24 h treatment with BAS-2 (10 µM and 20 µM) and immunoblotted for 2-SC. L Fumarate hydratase activity from whole cell lysates of MDA-MB-231 or BT-549 cells after 24 h, as per manufacturer’s (Sigma, MAK-206) protocol. Values normalised to DMSO as 100% (n = 3-4 independent experiments). M Schematic of activity of ZY444 on pyruvate decarboxylase (PC). Created in BioRender. N Cell death by Annexin V/propidium iodide flow cytometry of MDA-MB-231 cells after pre-treatment (24 h) with the PC inhibitor ZY444 and subsequent BAS-2 treatment for 24 h (n = 3 independent experiments). O Cell death of BT-549 cells after ZY444 and BAS-2 treatment (n = 2-3 independent experiments). Two-way ANOVA was used to assess significance in (N, O) with multiple comparisons comparing each condition against each other. Selected comparisons are shown. Points represent independent biological replicates and the mean +/− SEM is graphed. Source data are provided as a Source Data file.
Fig. 6
Fig. 6. FH interacts with HDAC6 at mitochondrial networks as revealed by multiple 3D imaging approaches, including super-resolution 3D-STORM.
A Representative 3D reconstruction of a fixed MDA-MB-231 cell stained for mitochondria (MitoTracker DeepRed), FH, and HDAC6. Mitochondrial volume is indicated in red. FH volume overlapping mitochondrial volume (FH mito +ve) is in magenta and FH not overlapping in dark purple. HDAC6 overlapping FH (HDAC6 FH +ve) is in yellow and not overlapping in green (HDAC6 FH -ve). Scale bars show 1 µm. B Representative STORM images of a fixed BT-549 cell stained for FH (magenta, Alexa Fluor-647) and TOM20 (green, CF-680). Experiment was conducted two independent times with at least 2 regions imaged each time of approximately 50-70 z-slices. C Intensity line-profile along the blue line indicated in (B) and 3D reconstruction of the region in (B). D Representative STORM images of BT-549 cells after 24 h treatment with DMSO or BAS-2 (10 µM or 30 µM) showing FH (magenta, CF-680) and HDAC6 (green, Alexa Fluor647). White triangles indicate HDAC6-FH interactions at mitochondrial structures. Yellow boxes represent inlay region. Scale bars show 1 µm. Images taken from one biological repeat. E 3D-STORM reconstructions of regions in (D) with orthogonal views shown to the right. Dotted lines indicate the point at which each of the two views are taken. Yellow boxes represent inlay region and yellow dotted-line boxes indicate the region being shown. F Schematic illustrating the colocalisation by cross-correlation (CCC) method. Created in BioRender. G Representative contributions generated by the CCC analysis are highlighted, which illustrates all HDAC6 signal near to FH signal in this region. 5 DMSO regions were assessed by CCC from one independent experiment. Scale bars show 1 µm. H Total colocalisation points summed using a threshold of 32 nm. Each point represents one of 5 (DMSO), or 7 (10 µM, 30 µM) regions comprising 20-30 z-slices each and from one independent experiment. Two outliers were excluded using the ‘identify outliers’ test in GraphPad Prism. Significance by unpaired one-way ANOVA compared to DMSO control where points show mean ± SEM. I Spearman’s correlation coefficients of the z-stacks used in (H) using the Coloc2 plugin (ImageJ/FIJI). Each point represents one of 5 (DMSO), or 7 (10 µM, 30 µM) regions comprising 20-30 z-slices each and from one independent experiment. Significance by unpaired one-way ANOVA compared to DMSO control where bars show mean ± SEM. Source data are provided as a Source Data file.

References

    1. Pavlova, N. N. & Thompson, C. B. The emerging hallmarks of cancer metabolism. Cell Metab.23, 27–47 (2016). - PMC - PubMed
    1. Gonçalves, A. C. et al. Impact of cancer metabolism on therapy resistance - Clinical implications. Drug Resist Updat59, 100797 (2021). - PubMed
    1. Lv, L. et al. Relationship between metabolic reprogramming and drug resistance in breast cancer. Front Oncol.12, 942064 (2022). - PMC - PubMed
    1. Gallinari, P., Di Marco, S., Jones, P., Pallaoro, M. & Steinkühler, C. HDACs, histone deacetylation and gene transcription: from molecular biology to cancer therapeutics. Cell Res17, 195–211 (2007). - PubMed
    1. Rodrigues, D. A., Roe, A., Griffith, D. & Chonghaile, T. N. Advances in the design and development of PROTAC-mediated HDAC degradation. Curr. Top. Med Chem.22, 408–424 (2022). - PubMed

MeSH terms

LinkOut - more resources