. 2025 Jul 29;16(1):6947.
doi: 10.1038/s41467-025-62208-9.

Single-nuclei multiomics analysis identifies abnormal cardiomyocytes in a murine model of cardiac development

Affiliations

Single-nuclei multiomics analysis identifies abnormal cardiomyocytes in a murine model of cardiac development

Riley Leonard et al. Nat Commun. .

Abstract

Transcription factors such as Tbx5, Gata4, Mef2c and Pitx2 are required during cardiac development, and in adult cardiac homeostasis. We demonstrate that the gene dosage and modulation of these factors are mediated in vivo by the miR-200 family. Inhibition of a single miR-200 family member within the cluster results in defects of the left ventricle and cardiomyocyte maturation during development. Inhibition of the entire miR-200 family results in a ventricular septal defect and embryonic lethality by embryonic day (E)16.5. Inhibition of each miR-200 family has distinct heart phenotypes in cell specific differentiation and maturation. snRNA-sequencing reveals an immature cardiomyocyte cell state, suggesting reduced differentiation of these cells. The miR-200 family members are critical regulators of early cardiac development through maintaining cardiomyocyte differentiation and maturation. In this report, we identify several transcription factors regulated by miR-200 during heart development, a role for miR-200 in specific heart defects, and an abnormal cardiomyocyte population.


Conflict of interest statement

Competing interests: Brad A. Amendt is the CSO and founder of NaturemiRI, LLC. All other authors have no disclosures to report.

Figures
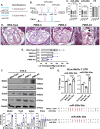
Fig. 1
Fig. 1. Inhibition of the miR-200 family has differential effects during cardiac development.
A Seed sequences of the miR-200a and miR-200c subfamilies. B Genomic location of miR-200a (Blue) and miR-200c (Magenta). miRs located on chromosome (Chr) 4 are intragenic and found in the second intron of Ttl10, while miRs located on chromosome 6 are intergenic. C Cardiac expression of miR-200a and miR-200c at E12.5, E14.5, E16.5, and P28. RNA was isolated from wild-type (WT) whole murine hearts. N = 4. (Shown as Ct values). D E14.5 hematoxylin and eosin stained transverse cardiac sections from Wild-Type, PMIS-A, PMIS-C, and PMIS-AC. The arrowhead shows a ventricular septal defect (VSD) and the arrow shows an atrial septal defect (ASD) in PMIS-AC embryos. RA, Right Atrium; LA, Left Atrium; RV, Right Ventricle; LV, Left Ventricle; VS, Ventral Septum. Corresponding anterior/posterior sections are seen in Supplementary Fig. 2. Scale bar = 100 µm. E Compact left ventricle compact myocardium thickness of WT, PMIS-A, PMIS-C, and PMIS-AC. N = 4. F Western Blot for Mef2c, Tbx5, Gata4, and Pitx2. Protein was isolated from E14.5 whole hearts. Lower panel: Quantification of Mef2c, Tbx5, Gata4 and Pitx2 normalized to Gapdh. N = 3. G Functional testing of miR-200a and miR-200c binding to the Mef2c 3’ UTR. Lower panel: identity of miR binding sequences in the Mef2c 3’UTR. N = 5. The statistic test performed was one-way ANOVAwith multiple comparisons. Data are presented as mean values ± SEM. *p ≤ 0.05, **p ≤ 0.01, ***p ≤ 0.001, ****p ≤ 0.00001.
Fig. 2
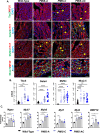
Fig. 2. Identification of in vivo miR-200 regulated genes in CMs.
A Immunofluorescent (IF) staining of apical left ventricle sections, at E14.5, for miR-200 family targets Tbx5, Gata4, Mef2c and cardiogenic co-factor Nkx2.5 (green). Sections were co-stained with CM marker (MF20 or cTnT) (Red). TFs are overexpressed in PMIS hearts. Yellow arrows denote CMs that have increased expression of the target TF. Scale bar = 25 μm. B Quantification of Corrected Total Cell Fluorescents (CTCF) of Tbx5, Gata4, Mef2c, and Nkx2.5. N = 12-19. C qPCR for downstream transcriptional targets of miR-200 TFs. RNA was isolated from whole hearts of litter mates used for snMultiOmics experiment. N = 4. The statistic test performed was one-way ANOVA with multiple comparisons. Data are presented as mean values ± SEM. *p ≤ 0.05, **p ≤ 0.01, ***p ≤ 0.001, ****p ≤ 0.00001.
Fig. 3
Fig. 3. Single nuclei transcript profiling of E14.5 miR-200 inhibited cardiac tissue.
A UMAP representation of single nuclei transcriptomes from wild-type, PMIS-A, PMIS-C, and PMIS-AC clustered for cell types. Unsupervised clustering identified 9 unique cell clusters. B Fraction of annotated cell clusters from each sample. C UMAP representation of single nuclei transcriptomes from wild-type, PMIS-A, PMIS-C, and PMIS-AC. D Heatmap showing the average expression for the top differentially expressed genes between E14.5 cardiac cell clusters. E Differentially expressed genes for WT v PMIS in cardiac cell clusters. The p-values were obtained using the two-sided Wilcoxon rank-sum test, adjusted for multiple comparisons using the Benjamini-Hochberg procedure. F UMAP representation of single nuclei transcriptomes subclustered for cell type. Unsupervised clustering identified 18 unique cell clusters, including 5 unique CM clusters.
Fig. 4
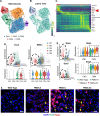
Fig. 4. Subclustering of CMs reveals an enriched CM population in PMIS-miR-200 hearts.
A UMAP plot of the CM subclustered population at E14.5. B Average percentage of CM cell states selected from 100 cells at random over 10 iterations. PMIS-miR-200 samples have an enrichment of the CM4 population (see boxed region). C UMAP plot of subclustered CMs from each sample. D UMAP feature plot for Tnni1. Higher expression is red. E Violin plots for Tbx5 and Mef2c expression in all identified CMs. PMIS-miR-200 samples show increased expression. F UMAP feature plot for significantly expressed CM4 genes Nppa, Sox5, and Fgf12. UMAP feature plot of Myl9 shows lower expression in CM4. UMAP feature plot of Tbx5 and Mef2c shows these factors are expressed in the CM4 cluster. G Immunofluorescent stain of apical left ventricle sections, at E14.5, for Nppa (Green, Yellow Arrows) and cTnT (Red). Nppa has increased expression in PMIS-miR-200 hearts at E14.5. Four independent experiments were performed with each showing similar results. Scale bar = 25 μm.
Fig. 5
Fig. 5. In-depth snRNA-seq. analysis predicts CM4 as a progenitor population of CMs.
A RNA velocity analysis of CM subclusters. B Latent Time of RNA velocity. Purple is time 0, yellow is time 1. C Gene expression dynamics of marker genes in each subcluster ordered along latent time inferred by RNA velocity analysis. Analysis shows that Tbx5 is associated with an earlier latent time and CM4 cluster. D Top: Plot of Tbx5 and Mef2c expression across pseudotime for each subcluster of CM. Both factors show expression in CM4 cells and at earlier pseudotime. Bottom: Violin plot of Tbx5 and Mef2c across CM subclusters. Factors are enriched in the CM4 cluster (boxed regions). E Left: Plot of CM4 markers Nppa and Sox5 expression across pseudotime from each subcluster of CM. Right: Violin plot of Nppa and Sox5 in CM1 and CM4 clusters. CM4 markers are enriched in PMIS-miR-200 samples. F Immunofluorescent stain of apical left ventricle sections, at E14.5, for Sox5 (Green) and Nppa (Red). PMIS-C and PMIS-AC hearts show clear enrichment of cell expression of both Nppa and Sox5 (yellow arrows). Four independent experiments were performed with each showing similar results. Scale bar = 25μm.
Fig. 6
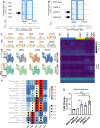
Fig. 6. ATAC-sequencing shows changes in the CM4 subcluster and changes in chromatin access near TFs.
A Visualization of ATAC-Seq reads of open chromatin around the Nppa locus in each of the CM subclusters. CM4 cluster has more open chromatin compared to other clusters (see arrow). B Visualization of ATAC-Seq reads of open chromatin around the Nppa locus in the CM4 cluster from PMIS-miR-200 samples. The Nppa locus appears more open in PMIS-miR-200 samples compared to WT (see arrows). C Open chromatin of the CM4 cluster was analyzed for enrichment of TF binding motifs. Shown are the top 10 enriched motifs. Motifs are enriched for T-Box family members, with Tbx5 being the most enriched. D UMAP feature blot of RNA expression (Upper) and motif enrichment (chromVAR) (lower) for Tbx5, Mef2c, Gata4, and Nkx2.5. E Heatmap of enriched topics across the CM cell states. CM4 cells are enriched for Topic 9 which contains TBX5 as the topic ranked as a differentially enriched motif (Supplemenatary File 7). F Heatmap of the TFs predicted to bind enriched eRegulons regions based on RNA expression of the TFs. G Nppa-Luciferase activity in AC16 cells stably expressing PMIS-miR-200 or a non-targeting control (PMIS-Scramble) showing activation of the Nppa promoter in PMIS-miR-200 cells. The statistic test performed was one-way ANOVA with multiple comparisons. N = 4. Data are presented as mean values ± SEM.
Fig. 7
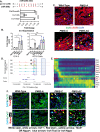
Fig. 7. miR-200c regulates the TF Irx1 in CM4 cells.
A Functional testing of the miR-200c regulation site in the Irx1 3’ UTR. N = 4. B qPCR for Irx1 expression in PMIS-miR-200 E14.5 hearts and PMIS transduced AC16 cells. RNA was isolated from whole hearts of litter mates used for snMulti-Omics experiment. N = 3. C Immunofluorescent stain of apical left ventricle sections, at E14.5, for Irx1 (Green) and cTnT (Red). PMIS-C and PMIS-AC hearts show clear enrichment of Irx1 expression (yellow arrowhead). Scale bar = 25 μm. D Visualization of ATAC-Seq reads of open chromatin around the Irx1 locus in the CM4 cluster from each PMIS sample. The Irx1 locus appears more open in PMIS-C and PMIS-AC samples compared to WT. E Gene expression dynamics of marker genes in each subcluster ordered along latent time inferred by RNA velocity analysis. Analysis shows that Tbx5 is associated with an earlier latent time in the CM4 cluster. F Immunofluorescent stain of apical left ventricle sections, at E14.5, for Irx1 (white), Tbx5, and Nppa (red) and cTnT (green). PMIS-C and PMIS-AC hearts show co-localization of Irx1 and Tbx5 and Irx1 and Nppa in CMs (yellow arrowhead). Scale bar = 25 μm. The statistic test performed was one-way ANOVAwith multiple comparisons. Data are presented as mean values ± SEM. *p ≤ 0.05, **p ≤ 0.01, ***p ≤ 0.001.

References

    1. Bruneau, B. G. et al. Chamber-specific cardiac expression of Tbx5 and heart defects in Holt–Oram syndrome. Dev. Biol.211, 100–108 (1999). - PubMed
    1. Bruneau, B. G. et al. A Murine model of Holt-Oram syndrome defines roles of the T-Box transcription factor Tbx5 in cardiogenesis and disease. Cell106, 709–721 (2001). - PubMed
    1. Liu, C. et al. Pitx2c patterns anterior myocardium and aortic arch vessels and is required for local cell movement into atrioventricular cushions. Development129, 5081–5091 (2002). - PubMed
    1. Molkentin, J. D., Lin, Q., Duncan, S. A. & Olson, E. N. Requirement of the transcription factor GATA4 for heart tube formation and ventral morphogenesis. Genes Dev.11, 1061–1072 (1997). - PubMed
    1. Garg, V. et al. GATA4 mutations cause human congenital heart defects and reveal an interaction with TBX5. Nature424, 443–447 (2003). - PubMed

MeSH terms

LinkOut - more resources