. 2025 Jul 28;16(1):6942.
doi: 10.1038/s41467-025-61842-7.

CD142-positive synovial fibroblasts drive meniscus destruction in rheumatoid arthritis

Affiliations

CD142-positive synovial fibroblasts drive meniscus destruction in rheumatoid arthritis

Hao Sun et al. Nat Commun. .

Abstract

Previous evidence suggest bone and cartilage damage is the main pathogenesis of rheumatoid arthritis joint destruction. However, the role of meniscus usually has not been thoroughly explored. Here, we identify CD142+ synovial fibroblasts as a subset located at sublining layer in normal and osteoarthritis synovium, which is increased and distributed at lining layer in rheumatoid arthritis synovium. Injection of CD142+ fibroblasts into DBA/1 male mice's knee destructs meniscus but has slight effect on cartilage. ABCC4 is highly expressed in CD142+ fibroblasts, whose blockage by MK571 attenuates CD142+ fibroblasts-induced meniscus destruction through cAMP/PKA signaling. Long-term follow-up of rheumatoid arthritis cohort indicates that enriched CD142+ fibroblasts at lining layer are a risk factor for severe knee joint destruction and eventually undergo total knee arthroplasty. Our results demonstrate CD142+ fibroblasts as an indicator to assess prognosis and a therapeutic target to inhibit meniscal destruction, thereby alleviating rheumatoid arthritis knee joint damage.


Conflict of interest statement

Competing interests: The authors declare no competing interests.

Figures
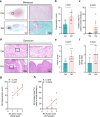
Fig. 1
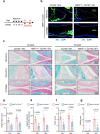
Fig. 1. Histological analysis indicating the destruction of RA meniscus are positively related to synovium lining layer synovitis.
a Representative Safranin-O-Fast Green staining images of meniscus from OA patients (n = 10) and RA patients (n = 15). b Quantification of meniscus degeneration score, which consists of four components: femoral/tibial/inner border surface, cellularity, collagen organization/alignment, and fiber organization, matrix Safranin-O-Fast Green staining. c Quantification of synovial invasion area ratio to whole meniscus area. d Representative Hematoxylin and Eosin (HE) staining images of knee synovium from OA patients (n = 10) and RA patients (n = 15). e, f Quantification of total Krenn score (maximum point, 9) and lining cell layer component of Krenn score (maximum point, 3). g, h Spearman’s correlation between RA Krenn score (lining layer) and RA meniscus degeneration score and RA meniscus invasion area. Source data are provided in the Source Data file. Statistics: two-tailed Student’s t-test (b, c, e, f). Data are mean ± s.d.
Fig. 2
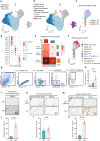
Fig. 2. CD142+ SF elevates in knee joint of RA.
a Single-cell RNA sequencing in UMAP projection shows 5368 cells of cartilage, 5256 cells of meniscus, and 4664 cells of synovium from one human RA knee sample. b Cells from three organs yield eight major clusters annotated according to the expression of known classical marker genes (Supplementary Fig. 2a, b). c Re-analysis of 3237 cells of synovial fibroblast (SF) revealed 3 SF subsets. d Expression of marker genes (y axes) for the three identified SF subsets (x axes). e Analysis of cell-to-cell interaction shows the heatmap of interaction numbers between SF subsets and meniscal cell or chondrocyte. The value in the colored block reveals the specific number of interactions between clusters (signaling ligand-receptor pairs listed in Supplementary Fig. 3c). f “Stromal cells” scRNA-seq from the AMP2 dataset, which contained nearly 60,000 single cells from 9 fibroblast clusters of 73 RA patients (excluding “Mu-0: Mural” cluster), projected and mapped on the fibroblast UMAP of this study. g Representative diagram of flow cytometry in the process of gating and sorting CD142+ SFs. h Percentage of CD142+ SFs to total CD31-CD45- SFs (normal synovium, n = 3; OA synovium, n = 6; RA synovium, n = 12; biological replicates). i Representative IHC images of CD142 in human knee synovial fluid deposit. j Quantification of CD142+ cells in synovial fluid deposit (n = 6; biological replicates). k–n Representative Safranin-O-Fast Green staining of mouse knee joint and IHC staining of CD142. k knee joint from wildtype mice and OA mice (DMM model) of C57BL/6 strain. l Quantification of CD142+ cell count by calculating the ratio of positive CD142 cells to total synovial cells (n = 6 mice, biological replicates). m knee joint from wildtype mice and CIA mice of DBA/1 strain. n Quantification of CD142+ cell count (n = 6 mice, biological replicates). Source data are provided in Source Data file. Statistics: one-way ANOVA with Tukey's multiple comparison test (h); two-tailed Student’s t-test (j, l, n). Data are mean ± s.d.
Fig. 3
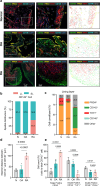
Fig. 3. The spatial distribution of CD142+ SF converts from sublining layer to lining layer in RA synovium.
a Multiplex immunohistochemistry (mIHC) staining of normal, OA, and RA knee synovium (normal, n = 3; OA, n = 5; RA, n = 5; biological replicates). The right column of images are spatial maps labeling the corresponding fluorescent cells in the middle column of sections. In spatial map, cells with no fluorescence but only stained with DAPI are defined as “Other” with gray color. We divided the synovium into lining layer (LL) and sublining layer (SL) based on the corresponding HE staining of the sections. Total cell number, lining layer cell number, and sublining layer cell number of CD142+, PRG4+, THY1+, CD146+ and Other were obtained based on the Akoya inForm (version 1.6). b Spatial distribution of CD142+ cells, which is calculated as the ratio of lining layer CD142+ number to total CD142+ number, or sublining layer CD142+ number to total CD142+ number (RA versus N, P = 0.001; RA versus OA, P = 0.0001). c Cell constituent in lining layer, which is calculated as the ratio of specific cell type number in lining layer to total lining layer cell number (CD142+ cell % in lining layer, RA versus N, P < 0.0001; RA versus OA, P < 0.0001). d Nearest spatial distance between CD142+ cells and CD146+ cells. Based on the spatial map acquired from Akoya inForm, we utilized R package PhenoptrReports (version 0.3.3) to process the data and yielded the nearest distances between CD142+ cells and CD146+ cells (μm). All distances were summed and taken average for one sample (normal, n = 3; OA, n = 5; RA, n = 5; biological replicates). e Co-expression of other SFs markers in CD142+ cells (normal, n = 3; OA, n = 5; RA, n = 5; biological replicates). Source data are provided in Source Data file. Statistics: one-way ANOVA with Tukey’s multiple comparison test (b, c, d, e). Data are mean ± s.d.
Fig. 4
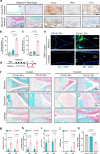
Fig. 4. CD142+ SF invades and destructs meniscus in RA knee.
a CD142 expression markedly elevates in synovial invasion area in RA meniscal matrix. Safranin-O-Fast Green staining shows the invasion area in meniscal matrix, with the corresponding image in the same section of IHC staining of CD142, PRG4, THY1. b Quantification of human meniscus (n = 6, biological replicates) invaded area cell count, calculated by the ratio of specific cell to total invaded area cell. c Quantification of CIA mice meniscus (n = 6 mice, biological replicates) invaded area cell count. d Diagram of establishing mice invasive SFs arthritis model. DBA/1 male mice were applied knee intra-articular injection of CD142+ and CD142- SFs at age of 8, 9, 10, and 11 weeks once a week. Knee samples were obtained at age of 12- and 16-week. e Representative fluorescent image of knee joint of invasive SFs arthritis model at 16-week of age provides direct evidence for CD142+ SFs invading meniscus (n = 3 mice, biological replicates). Before intra-articular injection, SFs are labeled with autofluorescence by CellTrace CFSE dye, which shows green color excited at 488 nm channel. DAPI labels nuclei. f Representative Safranin-O-Fast Green staining image of knee joint of invasive SFs arthritis model (n = 6 mice for both 12-week and 16-week, biological replicates). All sections displayed are sagittal view of knee lateral compartment. g Quantification of meniscus degeneration score of CD142- and CD142+ injection group. h Quantification of synovial invasion area in meniscus of CD142- and CD142+ injection group. i Quantification of Krenn score of CD142- and CD142+ injection group. j Quantification of cartilage OARSI score of CD142- and CD142+ injection group. k Co-culture of SFs-meniscal cells and quantification of expression of COL1A1 mRNA in meniscal cells (n = 6, biological replicates). Source data are provided in Source Data file. Statistics: one-way ANOVA with Tukey’s multiple comparison test (b, c, k); two-tailed Student’s t-test (g, h, i, j). Data are mean ± s.d.
Fig. 5
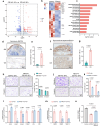
Fig. 5. ABCC4 expression is higher in CD142+ SF and MK571 effectively inhibits the aggressiveness of CD142+ SF.
a Bulk RNA sequencing of CD142- SFs and CD142+ SFs (n = 3, biological replicates) reveals 25 up-regulated genes and 89 down-regulated genes in CD142+ SFs, displayed on volcano plot with red color for up-regulated and blue color for down-regulated. b Heatmap of all up- and down- regulated genes for CD142- SFs (three columns on the left) and CD142+ SFs (three columns on the right), with top 10 genes labeled. c GO analysis in Cellular Component (CC) category for CD142+ SFs. d Representative images of IHC staining of ABCC4 in human RA and OA synovium. e Quantification of synovium ABCC4+ cell count (ratio to total synovial cells in the section, n = 6, biological replicates). f Representative images of IHC staining of ABCC4 in human RA and OA synovial fluid deposit. g Quantification of synovial fluid deposit ABCC4+ cell count (ratio to total deposit cells in the section, n = 6, biological replicates). h MK571 slightly influences on CD142- SFs in transwell assays. MK571: 5 μM. i Quantification of CD142- SFs transwell cell count (n = 3, biological replicates). j MK571 drastically represses the aggressiveness of CD142+ SFs in transwell assays. MK571: 5 μM. k Quantification of CD142+ SFs transwell cell count (n = 3, biological replicates). l MK571 suppresses the expression of related classical cell migration genes (mRNA) for CD142+ SFs by qPCR (n = 3, biological replicates). m MK571 suppresses the expression of extracellular matrix degradation enzymes genes (mRNA) for CD142+ SFs by qPCR (n = 3, biological replicates). n Co-culture of CD142+ SFs-meniscal cells in MK571 and quantification of expression of COL1A1 mRNA in meniscal cells (n = 6, biological replicates). Source data are provided in Source Data file. Statistics: one-way ANOVA with Tukey’s multiple comparison test (n); two-tailed Student’s t-test (e, g, i, k, l, m). Data are mean ± s.d.
Fig. 6
Fig. 6. MK571 effectively represses the meniscus destruction driven by CD142+ SFs.
a Diagram of establishing mice invasive SFs arthritis model. DBA/1 male mice were applied knee intra-articular injection of CD142+ SFs and MK571 (5 μM) + CD142+ SFs at age of 8, 9, 10, and 11 weeks once a week. Knee samples were obtained at age of 12- and 16-week. b Representative fluorescent image of knee joint of invasive SFs arthritis model at 16-week of age proves the blockage effect of MK571 toward CD142+ SFs invading meniscus (n = 3 mice, biological replicates). c Representative Safranin-O-Fast Green staining image of knee joint of invasive SFs arthritis model (n = 6 mice for both 12-week and 16-week, biological replicates). All sections displayed are sagittal view of knee lateral compartment. d Quantification of meniscus degeneration score. e Quantification of synovial invasion area in meniscus. f Quantification of Krenn score. g Quantification of cartilage OARSI score. Source data are provided in Source Data file. Statistics: two-tailed Student’s t-test (d, e, f, g). Data are mean ± s.d.
Fig. 7
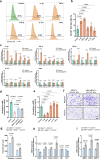
Fig. 7. Effect of cytokines on CD142- SF, and ABCC4 promotes CD142+ SF invasion by down-regulating cAMP/PKA signaling.
a Representative images of flow cytometry on cytokines stimulating CD142- SFs after 96 h, assessing percentage of CD142+ SFs (PE). The concentration of each cytokine is 10 ng/ml. b Quantification of percentage of CD142+ SFs for each group (n = 3, biological replicates). c Quantification of expression of on CD142+ SF marker genes and ABCC4 by qPCR (n = 3, biological replicates). d,e Intracellular cAMP concentration of each group by ELISA. f H89 restores aggressiveness of CD142+ SFs in transwell assays under the background of MK571. H89: 15 μM. MK571: 5 μM. g Quantification of CD142- SFs transwell cell count (n = 3, biological replicates). h H89 restores the expression of related classical cell migration genes for CD142+ SFs by qPCR (n = 3, biological replicates). i H89 restores the expression of extracellular matrix degradation enzymes genes for CD142+ SFs by qPCR (n = 3, biological replicates). Source data are provided in Source Data file. Statistics: one-way ANOVA with Tukey’s multiple comparison test (b, d, e); two-tailed Student’s t-test (c, g, h, i). Data are mean ± s.d.
Fig. 8
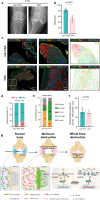
Fig. 8. High expression of CD142+ SF at lining layer indicates poor prognosis for RA knee.
a X-ray for RA patients who haven’t progressed to knee deformity (non-TKA) and have received total knee arthroplasty with knee deformity (TKA). b Quantification of Knee Society score (KSS score) for non-TKA (n = 10) and TKA (n = 7) patients at the end-point of follow-up. We chose Objective Knee Indicators for assessment, containing four categories (each category scoring 25 points): alignment, instability, joint motion and symptoms. c mIHC staining of knee synovia from non-TKA patients (n = 10, biological replicates) and TKA patients (n = 7, biological replicates). All knee synovia were acquired with knee parker-pearson fine needle biopsy at the time of earliest onset of knee symptoms. The right column of images are spatial maps labeling the corresponding fluorescent cells in the middle column of sections. d Spatial distribution of CD142+ cells for non-TKA synovia and TKA synovia, which is calculated as the ratio of lining layer CD142+ number to total CD142+ number, or sublining layer CD142+ number to total CD142+ number (non-TKA versus TKA, P < 0.0001). e Cell constituent in lining layer for non-TKA synovia and TKA synovia, which is calculated as the ratio of specific cell type number to total lining layer cell number (CD142+ cell % in lining layer, non-TKA versus TKA, P = 0.001). f Nearest spatial distance between CD142+ cells and CD146+ cells for non-TKA synovia (n = 10, biological replicates) and TKA synovia (n = 7, biological replicates). g Schematic diagram of the mechanism of CD142+ SFs driving meniscus destruction in RA and ABCC4 regulates CD142+ SF invasion by down-regulating cAMP/PKA signaling. Source data are provided in Source Data file. Statistics: two-tailed Student’s t-test (b, d, e, f). Data are mean ± s.d.

References

    1. Smolen, J. S., Aletaha, D. & McInnes, I. B. Rheumatoid arthritis. Lancet388, 2023–2038 (2016). - PubMed
    1. Tian, X. et al. 2018 Chinese guidelines for the diagnosis and treatment of rheumatoid arthritis. Rheumatol. Immunol. Res2, 1–14 (2021). - PMC - PubMed
    1. Agarwal, A. R. et al. Trend of using cementless total knee arthroplasty: a nationwide analysis from 2015 to 2021. Arthroplasty6, 24 (2024). - PMC - PubMed
    1. Harb, M. A. et al. Have the annual trends of total knee arthroplasty in rheumatoid arthritis patients changed?. J. Knee Surg.31, 841–845 (2018). - PubMed
    1. Long, H. et al. Length of stay and inpatient charges of total knee arthroplasty in China: analysis of a national database. Chin. Med J. (Engl.)136, 2050–2057 (2023). - PMC - PubMed

MeSH terms

LinkOut - more resources