. 2025 Oct;44(38):3537-3552.
doi: 10.1038/s41388-025-03496-9. Epub 2025 Jul 28.

EWS::FLI1-DHX9 interaction promotes Ewing sarcoma sensitivity to DNA topoisomerase 1 poisons by altering R-loop metabolism

Affiliations

EWS::FLI1-DHX9 interaction promotes Ewing sarcoma sensitivity to DNA topoisomerase 1 poisons by altering R-loop metabolism

Joaquin Olmedo-Pelayo et al. Oncogene. 2025 Oct.

Abstract

Drug resistance is an ill-defined cause of dismal outcomes in cancer. Ewing sarcoma (EwS), a pediatric cancer characterized by high therapy failure rates, is driven by a single oncogenic event generating EWSR1::ETS gene fusions (primarily EWSR1::FLI1) in a silent genomic background. This provides a straightforward model to study the impact of gene fusions on drug responses. Here, we describe a novel mechanism of sensitivity to DNA topoisomerase 1 poisons in EwS. We discovered that EWS::FLI1 prevents the resolution of R-loops induced by these drugs via sequestering DHX9 helicase, ultimately resulting in R-loop accumulation, replication stress, and genome instability. In turn, excessive DHX9 or reduced EWS::FLI1 levels render EwS cells resistant to the active metabolite of irinotecan (SN-38) independent of proliferation and global transcription rates. This resistance helps explain how elevated DHX9 levels predict worse clinical outcomes. Overall, our research demonstrates the impact of a dominant mutation on cancer drug sensitivity, highlighting its significant clinical implications.


Conflict of interest statement

Competing interests: The authors declare no competing interests. Ethics approval and consent to participate: All methods were performed following the relevant guidelines and regulations, including the Declaration of Helsinki for research involving human participants and Directive 2010/63/EU for the protection of animals used for scientific purposes. The study involving human participants was approved by the Comité Coordinador de Ética de la Investigación Biomédica de Andalucía, which issued a favorable opinion on April 10, 2024, for the project (Protocol version 1, dated 04/06/2023; IC version 7, dated 18/05/2021; internal code SICEIA-2024-000125; application code S2400018). Written informed consent was obtained from all participants before their inclusion in the study. The study also included research involving live vertebrates (mice, Mus musculus). It was authorized by the Dirección General de la Producción Agrícola y Ganadera of the Consejería de Agricultura, Pesca, Agua y Desarrollo Rural of the Junta de Andalucía. The corresponding ethics approval (reference number: 05/07/2023/58) was granted on July 6, 2023, for the project, classified as a Type II project involving mild to moderate procedures. The protocol was positively evaluated by the local Animal Ethics Committee and by the authorized body CEI de los Hospitales Universitarios Virgen Macarena - Virgen del Rocío de Sevilla. No identifiable images of human participants are included in this manuscript.

Figures

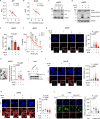
Fig. 1
Fig. 1. EwS cell lines and tumors are highly sensitive to TOP1 poisons.
A Comparative analysis of drug activity between 15-17 EwS (carrying the EWSR1::FLI1 fusion oncogene) and more than 600 non-EwS cell lines using the Genomics of Drug Sensitivity in Cancer website. Each dot is a tested drug. B Evaluation of SN-38 sensitivity between EwS (A4573, A-673, TC-71, and EW-7) and non-EwS cell lines (U2OS (osteosarcoma), SK-UT-1 (leiomyosarcoma), HT-1080 (fibrosarcoma), and 93T449 (liposarcoma)). After 72 h of treatment with indicated concentrations, cell viability was analyzed by MTT. Data represent the mean (+SEM) of the percentage of survival (relative to DMSO); n = 2 independent experiments. C Evaluation of tumor growth of PDX models (EwS: IEC-073, HSJD-ES-002, HSJD-ES-006; osteosarcoma, IEC-036; UPS, IEC-056) over 21 days following the beginning of irinotecan treatment. The dotted line indicates the end of treatment. Data represent the mean (+SEM) of tumor volume. D Evaluation of tumor growth inhibition of PDX models at the end of irinotecan treatment. Data represent the mean of the percentage of tumor growth inhibition. E Analysis of SN-38-induced DSBs comparing EwS (A4573, A-673, TC-71 and EW-7) and non-EwS cell lines (U2OS, SK-UT-1, HT-1080 and 93T449) by γH2AX IF. Cells were treated with 5 µM of SN-38 (30 min). Left, representative images. DAPI counterstain. Scale bar, 20 µm. Right, data represent the mean (±SEM) of nuclear γH2AX intensity; n ≥ 2 independent experiments (~75 cells were analyzed per replicate). F Similar to (E) in S-phase population (determined by EdU incorporation). Cells were incubated with 10 µM of EdU (20 min), washed and treated with 5 µM SN-38 (30 min). Data represent the mean (±SEM) of nuclear γH2AX intensity in EdU-positive cells (a total of ~100 cells were analyzed). G Determination of transcriptional rates between EwS and non-EwS cell lines by EU incorporation. Cells were incubated with 0.5 mM of EU for 45 min. Data represent the mean (±SEM) of nuclear EU intensity; n ≥ 2 independent experiments (~100 cells were analyzed per replicate). H Study of HR efficiency by SCEs assay in EwS, non-EwS, and BRCA1-mutated breast cancer cell lines (MDA-MB-436 and HCC-1937). Cells were treated with 2.5 µM etoposide for 30 min. Left, representative image. Scale bar, 5 µm. Asterisks indicate SCEs events. Right, data represent the mean (±SEM) of the frequency of SCEs per metaphase; n = 3 independent experiments (~20 metaphases were analyzed per replicate). P-value was determined by t-test.
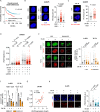
Fig. 2
Fig. 2. EWS::FLI1 impairs drug-induced R-loop resolution promoting genome instability and cytotoxicity.
A Evaluation of the association between CPT and B SN-38 activity (AUC), and EWSR1::FLI1 expression levels in EwS cell lines (n = 16). FLI1 gene was used as a surrogate marker of EWSR1::FLI1, since FLI1 is not expressed in EwS cells. Lineal correlation was determined by Pearson correlation coefficient. C EWS::FLI1 and LOX protein levels by WB in shA673 cells after DOX incubation. Loading control: GAPDH. Molecular weight in kDa. D SN-38-induced apoptosis upon EWSR1::FLI1 knockdown by PARP1 and CASP3 WB. Cells were pre-incubated with DOX for 24 h before 5 µM SN-38 treatment (3 h). After washout, cells were cultured in drug-DOX-free medium for 24 h. Loading control: GAPDH. Molecular weight in kDa. E Similar to (D) by AnnexinV FACS. Data represent the mean (+SEM) of the percentage of AnnexinV-positive cells, n = 5 independent experiments. F Similar to (D) by MTT assay. Cells were treated with indicated concentrations of SN-38 (3 h). After treatment, cells were cultured in drug-DOX-free medium for 48 h. Data represent the mean (+SEM) of the percentage of survival (relative to DMSO), n = 5 independent experiments. Dotted lines indicate IC50. G SN-38-induced γH2AX upon EWSR1::FLI1 knockdown by IF. Cells were pre-incubated with DOX for 24 h and treated with 5 µM SN-38 (30 min). Left, representative images. DAPI counterstain. Scale bar, 20 µm. Right, data represent the mean (±SEM) of nuclear γH2AX intensity, n = 5 independent experiments (~100 cells were analyzed per replicate). H SN-38-induced chromosomal breaks upon EWSR1::FLI1 downregulation. After DOX incubation, cells were treated with 2.5 µM SN-38 (30 min). Left, representative image. Scale bar, 10 µm. The arrow indicates a chromosomal break. Right, data represent the mean (±SEM) of the frequency of chromosomal breaks per chromosome, n = 3 independent experiments (20 metaphases were analyzed per replicate). I EWS::FLI1 protein levels in HeLa EF cells after 72 h of DOX incubation. Loading control: GAPDH. Molecular weight in kDa. J SN-38-induced γH2AX upon EWSR1::FLI1 overexpression by IF. HeLa EF cells were pre-incubated with DOX for 72 h and treated with 5 µM SN-38 (30 min). Other details as in (G), n = 3 independent experiments (~100 cells were analyzed per replicate). K SN-38-induced R-loops upon EWSR1::FLI1 knockdown by s9.6 IF. Cells were pre-incubated with DOX and treated with 5 µM SN-38 (30 min). Left, representative images. DAPI counterstain. Scale bar, 20 µm. Right, data represent the mean (±SEM) of nuclear s9.6 intensity, n = 3 independent experiments (~75 cells were analyzed per replicate). L Effect of RNH1 overexpression on SN-38-induced DSBs. Cells were transfected with RNH1:GFP or control plasmids 24 h before treatment with 5 µM SN-38 (30 min). Left, representative images. DAPI counterstain. Scale bar, 20 µm. Right, data represent the mean (±SEM) of nuclear γH2AX intensity in GFP-positive cells, n = 3 independent experiments (~50 cells were analyzed per replicate). P-value was determined by t-test.
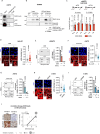
Fig. 3
Fig. 3. Loss of EWS::FLI1-DHX9 interaction alleviates R-loops accumulation promoting drug resistance.
A Kaplan–Meier showing overall survival of 166 EwS patient samples stratified by DHX9 mRNA levels. Statistical significance was determined by the Mantel–Cox test. B Determination of R-loops-DHX9 interactions by PLA in shA673 cells upon DOX incubation, and C DOX incubation and 5 µM SN-38 treatment (30 min). Left, representative images (red, PLA foci; blue, DAPI counterstain). Scale bar, 20 µm. Right, data represent the mean (±SEM) of PLA foci, n = 3 independent experiments (40 (B) and 20 (C) cells were analyzed per replicate). D Evaluation of the effect of DHX9 downregulation on SN-38-induced DSBs upon EWS::FLI1 depletion by γH2AX IF. After 48 h of transfection with indicated siRNAs and/or 24 h of incubation with DOX, shA673 cells were treated with 5 µM SN-38 (30 min). Data represent the mean (±SEM) of nuclear γH2AX signal; n = 3 independent experiments (150 cells were analyzed per replicate). E Evaluation of the effect of DHX9 overexpression on SN-38-induced DSBs by γH2AX IF. A-673 and TC-71 cells overexpressing DHX9:GFP or control plasmids were treated with 5 µM SN-38 (30 min). Left, representative images. DAPI counterstain. Scale bar, 20 µm. Right, data represent the mean (±SEM) of nuclear γH2AX signal of GFP-positive cells, n ≥ 3 independent experiments (30 cells were analyzed per replicate). F Effect of DHX9 overexpression on SN-38-induced apoptosis by AnnexinV FACS. Cells overexpressing DHX9:GFP or control plasmids were treated with 5 µM SN-38 (3 h). After washout, cells were maintained in drug-free medium for 24 h. Data represent the mean (+SEM) of the percentage of AnnexinV-positive between GFP-positive cells (relative to SN-38-), n ≥ 3 independent experiments. G Evaluation of the association between SN-38 activity (AUC) and DHX9 expression levels in EwS cell lines (n = 16). Lineal correlation was determined by the Pearson correlation coefficient. H Analysis of the effect of YK-4-279 on SN-38-induced DSBs by γH2AX IF. A-673 cells were pre-incubated with 75 µM YK-4-279 (1.5 h) and treated with 5 µM SN-38 (30 min). Left, representative images. DAPI counterstain. Scale bar, 50 µm. Right, data represent the mean (±SEM) of nuclear γH2AX intensity, n = 3 independent experiments (30 cells were analyzed per replicate). P-value was determined by t-test.
Fig. 4
Fig. 4. EWS::FLI1-DHX9 associated R-loop accumulation is a source of replication stress.
A Analysis of the effect of RNH1 overexpression in SN-38-induced replication stress by pCHK1 (Ser345) IF. Cells were transfected with RNH1:GFP or control plasmids 24 h before 5 µM SN-38 treatment (30 min). Left, representative images. DAPI counterstain. Scale bar, 20 µm. Right, data represent the mean (±SEM) of pCHK1 intensity in GFP-positive cells, n ≥ 2 independent experiments (30 cells were analyzed per replicate). B Effect of EWSR1::FLI1 knockdown in SN-38-induced replication stress by pCHK1 (Ser345) WB. shA673 cells were pre-incubated with DOX and treated with 5 µM SN-38 (30 min). Loading control: GAPDH. Molecular weight in kDa. Asterisk indicates non-specific bands. Bottom, quantification of CHK1 phosphorylation (pCHK1/CHK1 band signal). Data represent the mean of 2 independent experiments (relative to SN-38). C Similar to (B), by DNA fiber assay. Cells were incubated with CidU (30 min) and IdU + 5 µM SN-38 (30 min). D Quantification of (C). Data represent the mean (±SEM) of IdU/CidU fiber length ratio, n = 2 independent experiments (more than 250 fibers were analyzed per condition). E Effect of DHX9 overexpression on SN-38-induced replication stress by pCHK1 (Ser345) WB. A-673 and TC-71 cells overexpressing DHX9:GFP or control plasmids were treated with 5 µM SN-38 (30 min). Bottom, quantification of CHK1 phosphorylation (pCHK1/CHK1 band signal). Data are the mean of 2 independent experiments (relative to SN-38 GFP). Other details as in (B). F Effect of YK-4-279 treatment on SN-38-induced replication stress by pCHK1 (Ser345) WB. Cells were pre-incubated with 75 µM YK-4-279 (1.5 h) and treated with 5 µM SN-38 (30 min). Other details as in (B). G Evaluation of the effect of ATR inhibition in SN-38-induced pCHK1 and γH2AX by WB. A-673 and TC-71 cells were pre-incubated with 10 µM AZD6738 for 24 h and treated with 5 µM SN-38 (30 min). Other details as in (B). H Analysis of the effect of ATR inhibition in SN-38-induced chromosomal breaks. Cells were pre-incubated with 10 µM AZD6738 for 24 h and treated with 2.5 µM SN-38 (A-673) or 1.25 µM SN-38 (TC-71) for 30 min. Data represent the mean (±SEM) of the frequency of chromosomal breaks per chromosome, n ≥ 2 independent experiments (20 metaphases were analyzed per replicate). Statistical significance was determined by t-test. I Left, synergy plot representing synergistic effect of AZD6738 and SN-38 combination in A-673 cells. Right, effect of ATR inhibition in cell survival upon SN-38 exposure by MTT assay. Cells were incubated with AZD6738 (250 nM, 24 h) previous to the treatment with indicated concentrations of SN-38 (72 h). Data represent the mean (+SEM) of the percentage of survival, n = 3 independent experiments. Dotted lines indicate IC50. J Similar to (I) in TC-71 cell line. Statistical significance was determined by t-test.
Fig. 5
Fig. 5. EWS::FLI1 kidnaps DHX9 into the RNAPII transcriptional complex promoting R-loops formation.
A Analysis of the interaction between DHX9 and RNAPII-Ser2p by RNAPII-Ser2p pull-down. Molecular weight in kDa. Asterisk indicates non-specific bands. B Evaluation of the effect of EWSR1::FLI1 knockdown in DHX9-RNAPII-Ser2p interaction. shA673 cells overexpressing DHX9:GFP or control plasmids were incubated with DOX for 24 h previous to GFP pull-down. Representative immunoblots. Molecular weight in kDa. Data represent the mean (±SD) of the RNAPII-Ser2p band signal, normalized to DHX9:GFP pull-down (relative to DOX-); n = 3 independent experiments. C Evaluation of chromatin distribution of DHX9 by ChIP upon EWSR1::FLI1 knockdown. shA673 cells were treated with DOX for 24 h. Upper, diagram of ACTB and ACTG1 genes; and primers used for qPCR (red lines). Bottom, data represent the mean (+SEM) of DHX9 ChIP signal (normalized to DOX- signal at 3′); n = 3 independent experiments. D Evaluation of the effect of EWSR1::FLI1 overexpression on R-loops levels by s9.6 IF. HeLa EF cells were incubated with DOX for 72 h. Left, representative images. DAPI counterstain. Scale bar, 20 µm. Right, data represent the mean (±SEM) of nuclear R-loops; n = 5 independent experiments (50 cells were analyzed per replicate). E Evaluation of the effect of EWSR1::FLI1 downregulation on R-loops levels by slot blot assay. shA673 cells were incubated with DOX for 24 h. Left, representative immunoblots. Loading control: methylene blue staining. Right, data represent the mean (+SEM) of s9.6 signal (normalized to methylene blue and relative to DOX-), n = 4 independent experiments. F Similar to (D) in A-673 cells after treatment with 25 µM YK-4-279 for 4 h; n = 3 independent experiments. G Similar to (E) in A-673 cells after treatment with 75 µM YK-4-279 for 1.5 h; n = 3 independent experiments. H Similar to (D) in A-673 cells 48 h after transfection with indicated siRNAs; n = 4 independent experiments. I Similar to (E) in A-673 cells 48 h after transfection with indicated siRNAs; n = 3 independent experiments. Statistical significance was determined by t-test. J Analysis of the correlation between R-loops and DHX9 protein levels in a cohort of 59 EwS tumors. Scale bar, 50 µm. Correlation was determined by the Pearson correlation coefficient.
Fig. 6
Fig. 6. MODEL.
Under basal conditions, EWS::FLI1 promotes the interaction between DHX9 and the elongating RNAPII leading to the formation of R-loops. In addition, TOP1 poisoning provokes the accumulation of R-loops through the blockage of RNAPII transcription. In non-EwS cells, DHX9 resolves drug-induced R-loops, preventing genome instability. In EwS cells, EWS::FLI1 “hijacks” DHX9 into the RNAPII transcriptional complex, reducing DHX9 recruitment to the R-loops and R-loops resolution. Replication machinery collapse with unresolved R-loops promoting replication stress, genome instability, and cell death.

References

    1. Grünewald TGP, Cidre-Aranaz F, Surdez D, Tomazou EM, de Álava E, Kovar H, et al. Ewing sarcoma. Nat Rev Dis Primers. 2018;4:5. - PubMed
    1. Esiashvili N, Goodman M, Marcus RB Jr. Changes in incidence and survival of Ewing sarcoma patients over the past 3 decades: Surveillance Epidemiology and End Results data. J Pediatr Hematol Oncol. 2008;30:425–30. - PubMed
    1. Ye C, Dai M, Zhang B. Risk factors for metastasis at initial diagnosis with Ewing sarcoma. Front Oncol. 2019;9:1043. - PMC - PubMed
    1. Gaspar N, Hawkins DS, Dirksen U, Lewis IJ, Ferrari S, Le Deley MC, et al. Ewing sarcoma: current management and future approaches through collaboration. J Clin Oncol. 2015;33:3036–46. - PubMed
    1. Zöllner SK, Amatruda JF, Bauer S, Collaud S, de Álava E, DuBois SG, et al. Ewing sarcoma-diagnosis, treatment, clinical challenges and future perspectives. J Clin Med. 2021;10:1685. - PMC - PubMed

MeSH terms

LinkOut - more resources