. 2025 Sep;44(17):4772-4802.
doi: 10.1038/s44318-025-00515-z. Epub 2025 Jul 28.

Macrophages form dendrite-like pseudopods to enhance bacterial ingestion

Affiliations

Macrophages form dendrite-like pseudopods to enhance bacterial ingestion

Changyuan Fan et al. EMBO J. 2025 Sep.

Abstract

Macrophages are critical innate immune cells that exhibit remarkable adaptability during pathogen infections. However, the relationship between their morphological plasticity and physiological functions remains largely elusive. Here, we discovered an unprecedented paradigm of macrophage adaptation within a few hours upon severe Gram-negative bacterial infections, characterized by the formation of dendrite-like pseudopods (DLPs). Using in vitro, microfluidic, and in vivo infection models, we demonstrate that these pseudopods enhance bacterial uptake by expanding the macrophage searching radius, thereby bolstering host defense. Mechanistically, Toll-like receptor 4 (TLR4) activation by Gram-negative bacterial lipopolysaccharide (LPS) upregulates the expression of macrophage-specific RhoGEF and ARHGEF3 in an NF-κB-dependent manner. ARHGEF3 localizes to dendrite-like pseudopods and enhances RhoA activity. Consequently, periodic cycles of actin assembly and disassembly propel the elongation of pseudopods, whereas vimentin intermediate filaments stabilize them. Importantly, infusion of DLP-equipped macrophages into Salmonella-infected mice reduced bacterial burden and infection severity. Together, our findings underscore how the dynamic response of macrophages to massive infections can augment immune defense against pathogenic bacteria.

Keywords: Actin Filaments; Dendrite-like Pseudopods; Macrophage; Pathogen Ingestion; Vimentin Intermediate Filaments.


Conflict of interest statement

Disclosure and competing interests statement. The authors declare no competing interests.

Figures

Figure 1
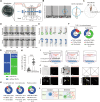
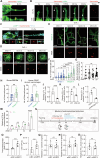
Figure 1. Macrophages form DLPs in response to a bacterial challenge.
(A) Schematic diagram of the two-photo intravital microscopy (TIM) experimental procedure. (B) Illustration of imaging the abdominal pouch in live mouse with TIM. (C) Physical display of TIM device and 3D reconstruction of macrophages on the abdominal wall. Scale bars, 20 µm. (D) Representative TIM imaging of peritoneal macrophages labeled with anti-F4/80 in vivo with or without Salmonella challenge. Green cells represent macrophages with obvious pseudopods. Magnified views reveal individual macrophage examples. Scale bars, 10 µm. (E) Quantification of the percentage of macrophages with or without DLPs upon Salmonella infection, based on TIM data from 150 cells in 6 independent imaging views from three experiments. (F) Quantification of the DLPs length in adherent peritoneal macrophages with or without Salmonella challenge. n = 18 cells. (G) Time-lapse imaging of THP-1 macrophages revealing the process of DLPs formation with or without Salmonella infection (MOI = 20). Scale bars, 50 µm. (H) Pie chart quantification of the percentage of three shapes of macrophages with or without Salmonella infection (MOI = 20). Blue, round shape (I); Red, fusiform shape (II); green, deformed shape with DLPs (III). (I) Quantification of the search radius of shape I and III macrophages. n = 50 cells. (J, K) Dosage and temporal-dependent analysis of shape III macrophages at 6 h-post-infection (hpi) under varying MOIs (J) or at different hpi times with a fixed MOI of 20 (K). (L) Representative time-lapse imaging revealing DLPs formation in iBMDM, RAW264.7 and mouse peritoneal macrophages during Salmonella infection (MOI = 20). Scale bars, 50 µm. Pie chart quantification of the percentage of three shapes of macrophages with or without Salmonella infection (MOI = 20) for 6 h. (M) Immunofluorescence visualization by phalloidin staining, delineating lamellipodia, filopodia and DLPs with dashed lines. Upper panels provide definitions for the three protrusive structures. Scale bars, 10 µm. (N) Representative images of DLPs visualized by WGA staining in Salmonella infected THP-1 macrophages. Yellow arrows depict ‘tube’ and ‘tip’ structures. Yellow line divides the tube and tip. White line divides the cell body and DLPs. Lower panel shows the orthographic view from the white dash line in the upper panel. Scale bars, 20 µm. (O) Quantification of the maximum width of ‘tips’ and ‘tubes’ in (n). n = 75 cells. (P) Quantification of the percentage of macrophages with filopodia and DLPs, respectively, in the indicated MOI of Salmonella infection at 6 hpi in THP-1 cells. (Q) Upper panel showing the schematic diagram of Salmonella withdraw experiment. Lower panel showing the time-lapse imaging of THP-1 macrophages after washing out Salmonella. Green circles depict the radius of cell. Scale bars, 20 µm. (R) Quantification of search radius of shape III macrophages after washing out Salmonella. The yellow arrowheads depict the DLPs in (D, G, L). Data are presented as mean ± s.d. from three independent experiments. Dots in quantifications presented individual cells. P = 0.00980 (E). P = 0.00090 (F). P = 0.00090 (H). P = 4.26191E-10 (I). P values from left to right (J): P = 0.00700, P = 0.50150, P = 0.56538, P = 0.66530. P values from left to right (K): P = 0.02162, P = 0.86055, P = 0.97863. P values from left to right (L): P = 0.00034, P = 0.00030, P = 0.00026. P = 5.32443E-40 (O). ns P > 0.05; *P < 0.05; **P < 0.01; ***P < 0.001; ****P < 0.0001: unpaired two-tailed Student’s t test (E, F, H, I, J, K, L, O). Source data are available online for this figure.
Figure 2
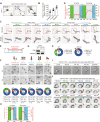
Figure 2. DLPs formation requires the contact with bacteria and they elongate directionally towards bacteria.
(A) Photo image and schematic diagram of the microfluidics. (B) Representative bright field images of shape III macrophages within microfluidics. The blue circle depicts the DLPs. The yellow dashed line depicts the length of DLPs. The red line depicts the vertical axis. The angle between the red line and the yellow line is the DLPs orientation. (C) Wind rose analysis depicting the directional orientation of 20 DLPs. (D) Representative bright field time-lapse imaging of THP-1 macrophages in microfluidics infected with Salmonella (MOI = 20) from upper channel. Scale bars, 20 µm. (E) Schematic diagram showing the observed macrophage deformation in microfluidics corresponding in (D). (F) Pie chart quantification of the percentage of three shapes of macrophages located in the junction between the upper vertical microchannel (Salmonella infection for 6 h)/the lower vertical microchannels (Mock) and the middle horizontal chamber. Blue, round shape (I); Red, fusiform shape (II); Green, deformed shape with DLPs (III). (G) Percentage of extending ratio of DLP-positive macrophages to microchannels. (H) Quantification of the DLPs length in Mock and Salmonella infected macrophage in the microfluidics assay. n = 20 cells. (I) Schematic diagram showing the optimized transwell model for the contact assay. (J) Representative images showing the membrane pores (depicted by red arrowheads) in bright field, GFP-tagged bacterial in upper A and lower B focal planes, and macrophages morphology with phalloidin staining. Scale bars, 20 µm. (K) Pie chart quantifications of the percentage of three shapes in macrophages in the contact assay. (L) Schematic diagram illustrating that the directional growth of DLPs require the contact with bacteria. The yellow arrowheads depict the DLPs in (D, J). Data are presented as mean ± s.d. from three independent experiments. P = 0.00024 (F). P = 2.04912E-15 (H). P values from left to right (K): P = 0.00216, P = 0.00019. ***P < 0.001: unpaired two-tailed Student’s t test (F, H). one-way ANOVA with Sidak’s analysis (K). Source data are available online for this figure.
Figure 3
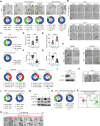
Figure 3. Cyclic actin assembly waves drive the DLPs construction and vimentin intermediate filaments stabilize the DLPs.
(A) Immunostaining of endogenous β-tubulin, F-actin and vimentin in Salmonella infected THP-1 macrophages. Scale bar, 20 µm. (B) Quantification of the fluorescence intensity ratio of β-tubulin, F-actin and vimentin in DLPs versus the cell body in Salmonella infected THP-1 macrophages. n = 20 cells. (C) Representative time-lapse images of SiR-actin labeled actin filaments in Salmonella infected THP-1 macrophages (MOI = 20). Scale bar, 20 µm. Magnified views showing the DLPs. Red lines depicting the actin filaments detected by Ridged detection. Scale bar, 20 µm. (D) Quantification of the DLPs length and actin filaments length over time in infected THP-1 macrophages in (C). Growing, steady and collapsing stages are denoted by green, gray and blue, respectively. (E) Schematic diagram of actin inhibitors treatment assay. (F) Upper panels showing time-lapse imaging of actin inhibitors treated THP-1 macrophages during Salmonella infection (MOI = 20) for 6 h. The targeting sites of inhibitors are shown in the upper panels. Pie charts in the lower panels show the percentage of macrophage shapes. Scale bar, 20 µm. DMSO, n = 391 cells, Latrunculin B treatment, n = 232 cells; Blebbistatin treatment, n = 247 cells; SMIFH2 treatment, n = 171 cells; NP-G2-044 treatment, n = 228 cells; and CK666 treatment, n = 269 cells. (G) Western blot analysis of vimentin in wild-type (WT) and vimentin knockout (VIM KO) THP-1 macrophages. (H) Pie charts showing the percentage of three shapes in macrophages upon Salmonella infection for 6 h. WT, n = 382 cells; VIM KO, n = 363 cells. (I) Time-lapse images of VIM KO THP-1 macrophages during Salmonella infection (MOI = 20). Arrowheads in distinct colors depict the unstable DLPs. Scale bars, 20 µm. (J) Time-lapse images of SiR-actin labeled actin filaments in Salmonella infected VIM KO THP-1 macrophages (MOI = 20). Yellow dashed lines outline the budding DLPs. (K) Quantification of the DLPs length and actin filaments length over time in infected VIM KO THP-1 macrophage in (J). Growing, steady and collapsing stage are denoted by green, gray and pink, respectively. The yellow arrowheads depict the DLPs in (A, F). Data are presented as mean ± s.d. from three independent experiments. Dots in quantifications presented individual cells. P values from left to right (F): P = 0.00052, P = 0.00053, P = 0.00102, P = 0.00018, P = 0.08446. P = 0.00022 (H). ns P > 0.05; ***P < 0.001: unpaired two-tailed Student’s t test (H). one-way ANOVA with Sidak’s analysis (F). Source data are available online for this figure.
Figure 4
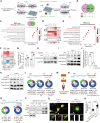
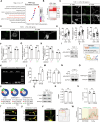
Figure 4. LPS activated TLR4 stimulates the DLPs formation.
(A) Representative phase-contrast imaging of THP-1 macrophages following infection with distinct bacteria at 6 hpi (MOI = 20). Scale bars, 50 µm. Pie chart in the lower panel showing the quantification of the percentage of three shapes of macrophages with different bacterial infection (MOI = 20) for 6 h. Yellow arrows depict the DLPs. (B) Time-lapse imaging of THP-1 macrophages showing the DLPs formation upon treatment of 100 ng/mL LPS and 1 µg/mL LTA, respectively. Lower panels are magnified regions. Scale bar, 20 µm (in cell images) and 2 µm (in the magnified images). (C) Pie charts representing the percentage of three shapes in macrophages treated with LPS and LTA for 6 h, respectively. (DG) Quantification of the cell area (D), searching radius (E), circularity (F) and solidity (G) of shape I and shape III macrophages. n = 25-30 cells. (H) Representative time-lapse images of iBMDMs and RAW264.7 with or without LPS stimulation. Yellow arrows depict the DLPs. Scale bar, 20 µm. (I) Pie chart quantification of the percentage of iBMDMs and RAW264.7 treated with LPS for 6 h. (J) Western blot analysis of TLR4 in wild-type (WT) and TLR4 knockout (TLR4 KO) THP-1 macrophages. (K) Representative imaging of THP-1 WT and TLR4 KO macrophage with LPS stimulation. Scale bars, 20 µm. (L) Pie charts showing the percentage of three shapes in macrophages in wild-type (WT) and TLR4 knockout (TLR4 KO) THP-1 macrophages infected with salmonella for 6 h. WT, n = 324 cells; TLR4 KO, n = 248 cells. (M) Western blot analysis of NF-κB (Ser536) phosphorylation following LPS, TAK-242 and combined LPS and TAK-242 treatment. (N) Schematic diagram (upper panel) and representative time-lapse imaging (lower panels) of THP-1 macrophage during Salmonella infection (MOI = 20) under TAK-242 treatment. Scale bars, 20 µm. (O) Pie charts showing the percentage of three shapes in macrophages following vehicle (Veh.) and TAK-242 treatment. Veh., n = 288 cells; TAK-242 treatment, n = 267 cells. (P) Schematic diagram of LPS-triggered DLPs formation. Data are presented as mean ± s.d. from three independent experiments. Dots in quantifications presented individual cells. P values from left to right (A): P = 0.00029, P = 6.77908E-05, P = 4.29608E-05, P = 0.07380, P = 0.08446. P = 0.00006 (C). P = 4.66028E-12 (D). P = 1.86775E-24 (E). P = 4.80168E-23 (F). P = 1.78717E-09 (G). P values from left to right (I): P = 4.41414E-05, P = 0.01250. P = 0.00313 (L). P = 0.00645 (O). ns P > 0.05; **P < 0.01; ***P < 0.001; ****P < 0.0001: unpaired two-tailed Student’s t test (C, DG, I, O). one-way ANOVA with Sidak’s analysis (A). Source data are available online for this figure.
Figure 5
Figure 5. Omics profiling reveals critical roles of ARHGEF3 and RhoA in DLPs formation.
(A) Schematic diagram showing the screening and sorting of none-DLPs (P−) and more-DLPs (P + ) iBMDM macrophages. (B) Illustration of upregulated genes in P− and P+ iBMDMs with LPS treatment. (C) Biological process enrichment analysis of upregulated genes in P+ but not in P− iBMDMs with LPS treatment. The top ten enriched terms are shown in the bubble chart. (D) Heatmap showing the transcriptional levels of surface markers of macrophages with LPS stimulation in P+ and P− iBMDMs by RNA sequencing. (E) Cellular component enrichment analysis of upregulated genes in P+ but not in P− iBMDMs. The top 10 enriched items are shown in the bubble chart. In (C) and (E), the colored bubbles displayed from red to blue indicating the descending order of P. adjust value. The sizes of the bubbles are displayed from small to large in ascending order of gene counts. The x and y axis represent the gene ratio and the GO terms, respectively. (F) Heatmap showing the transcriptional levels of RhoA GEFs and GAPs by RNA sequencing. (G) ARHGEF3 transcriptional levels were measured by RT-qPCR in P− and P+ iBMDM macrophages. (H) Western blot analysis of ARHGEF3 protein levels upon LPS stimulation in P− and P+ iBMDM macrophages. (I) Western blot analysis of ARHGEF3 and the active levels of RhoA in THP-1 macrophages treated with LPS for indicated times. (J) Quantification of the relative luciferase activity upon LPS or LPS + TAK242 treatment. (K) Western blot analysis of ARHGEF3 and the active levels of RhoA upon LPS, TAK-242 or combined LPS and TAK-242 treatment. (L) Upper panel showing the diagram of ARHGEF3 knockdown procedure in THP-1 macrophages. Pie charts in lower panels illustrating the percentage of three shapes with RNAi treatment and salmonella infection for 6 h. Ctrl (no transfection), n = 758; siNC, n = 384 cells; siARHGEF3, n = 590 cells. (M) Diagram of the RhoA-ROCK signaling pathway. (N) Upper panel showing the diagram of RhoA CA/DN plasmid transfection procedure in THP-1 macrophages. Pie charts in lower panels illustrating the percentage of three shapes with transfection and salmonella infection for 6 h. EGFP (Control), n = 236; RhoA CA, n = 244 cells; RhoA DN, n = 277 cells. (O) Upper panel showing the diagram of Y-27632 treatment procedure. Pie charts in lower panels illustrating the percentage of three shapes with or without Y-27632 treatment and with Salmonella infection for 6 h. Veh., n = 228 cells; Y-27632 treatment, n = 186 cells. (P) Co-immunoprecipitation (Co-IP) verified the interaction between mTLR4 and ARHGEF3 in iBMDM cells stably expressed mTLR4-HA. The protein complex was enriched using Protein A/G agarose beads. (Q) Representative images of THP-1 macrophages with DLPs stimulated by LPS without or with TAK242 pretreatment and stained with ARHGEF3 and TLR4 antibodies. White dash lines depict the outline of the cell. Cropped views depict DLPs regions. Yellow arrows depict the DLPs. Bars, 20 µm (in cell images) and 5 µm (in the magnified images). (R) Quantification of the mean intensity of ARHGEF3 in cell body (except nucleus) and the DLPs of THP-1 macrophages treated with LPS. Data are presented as mean ± s.d. from three independent experiments. Dots in quantifications presented individual cells. P values from left to right (G): P = 0.28437, P = 0.00013. P = 0.00035 (J). P values from left to right (L): P = 0.01918, P = 0.00050. P = 0.00057 (N), P = 7.67308E-05 (O). P = 3.63749E-20 (R). ns P > 0.05; ***P < 0.001; ****P < 0.0001: unpaired two-tailed Student’s t test (G, J, O, R), one-way ANOVA with Sidak’s analysis (L, N), two-way ANOVA with Sidak’s analysis (F), Benjamini–Hochberg (BH) analysis (C, E). Source data are available online for this figure.
Figure 6
Figure 6. DLPs enhance the efficiency of bacterial ingestion of macrophages and promote the clearance of bacteria in vivo.
(A) Representative images of mCherry-tagged Salmonella infected THP-1 macrophages stained with WGA. White dash line divides DLPs from the cell body. Lower panel shows the orthographic view of the upper panel image. Scale bars, 10 µm. (B) Time-lapse imaging of mCherry-tagged Salmonella infected THP-1 macrophages stained with WGA. White dash line depicts the cell body and DLPs. White arrowheads depict the position of an inward moving Salmonella bacterium along DLPs. Scale bars, 20 µm. (C) Immunofluorescence staining of endogenous LAMP1 and WGA in mCherry-tagged Salmonella infected THP-1 macrophages. The magnified views depict ROIs in cell body and in DLPs. Scale bars, 10 µm (in cell image) and 5 µm (in the magnified images). (D, E) Representative images of mCherry-tagged Salmonella in THP-1 macrophages with or without DLPs. Cell outlines were visualized with WGA staining. White squares depict ROIs containing ingested Salmonella. ROIs are magnified below, with ingested Salmonella. Scale bars, 10 µm. (F) Quantification of the number of Salmonella per infected cell in shape I and III macrophages at distinct MOIs. n = 20–30 cells. (G) Quantification of the ratio of bacteria numbers in shape III versus in shape I macrophages at distinct MOIs. n = 15–25 cells. (H, I) Quantification of the number of Salmonella per infected cell in shape I and III mouse BMDMs (J) and human PBMC derived macrophages (K). n = 20–25 cells. (JL) Quantification of the bacterial load upon Salmonella infection in THP-1 WT and VIM-KO macrophages (J), iBMDMs WT and VIM-KO macrophages (K) and THP-1 macrophages with RNAi of negative control or ARHGEF3 (L). (M) Quantification of the bacterial load in P− and P+ iBMDM macrophages at distinct MOIs. (N) Schematic diagram of extraintestinal infection mouse model incorporating macrophage re-infusion. (O, P) Quantification of bacterial load indicated by colony forming unit (CFU) in peritoneal lavage fluid (O) and liver (P) infected with Salmonella. (QS) Quantitative RT-qPCR analysis of the expression levels of inflammatory markers in the spleen. Data are presented as mean ± s.d. from three independent experiments. Dots in quantifications presented individual cells. P values from left to right (F): P = 0.03057, P = 0.00013, P = 0.00024, P = 4.00394E-06. P = 0.016278 (H), P = 0.00043 (I), P = 0.01133 (J), P = 0.00855 (K), P = 0.00477 (L), P values from left to right (M): P = 0.79525, P = 0.16105, P = 0.06649, P =  0.00034. P = 0.00769 (N), P = 0.00362 (O). ns P > 0.05; *P < 0.05; **P < 0.01; ***P < 0.001; ****P < 0.0001: unpaired two-tailed Student’s t test (HL, OS), one-way ANOVA followed by a Tukey’s post hoc test (G), two-way ANOVA with Sidak’s analysis (F, M). Source data are available online for this figure.
Figure 7
Figure 7
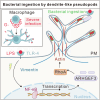
Schematic overview of the role of DLPs in enhancing the uptake of Gram-negative bacteria by macrophages.
Figure EV1
Figure EV1. Macrophages construct dendrite-like pseudopods (DLPs) in response to bacterial infection.
(A) Pie chart quantification of the percentage of shape III macrophages derived from shape I/II macrophages with Salmonella infection (MOI = 20). Blue, shape I to shape III; Red, shape II to shape III. The percentages presented in the form of mean ± s.d. (B-D) Quantification of cell area (B), circularity (C) and solidity (D) of shape I and shape III macrophages. n = 50 cells. (E) Quantification of the number of primary pseudopods derived from THP-1 cell body upon Salmonella infection with distinct MOIs. (F) Representative images visualized by WGA in shape I, shape II and shape III THP-1 macrophages and processed by Binary and Sholl analysis. Scale bar, 20 µm. Right panel shows the quantification of the number of intersections along DLPs based on Sholl analysis. n = 20 cells. (G) Schematic diagram of cell debris extraction (upper panel) and the time-lapse images of iBMDMs stimulated with cell debris (lower left panel). Scale bar, 50 µm. Pie chart quantification of the percentage of three shapes of macrophages with cell debris stimulation for 6 h (lower right panel). The percentages presented in the form of mean ± s.d. (H) Quantifications of the transcriptional levels of dendritic cell markers (CD83 and CD11c) by RT-qPCR. (I) Representative images of MoDCs derived from Human peripheral blood mononuclear cell-derived dendritic cells with and without Salmonella infection (MOI = 20) for 6 h. Scale bar, 10 µm. (J) Quantification of DLPs length in Salmonella infected MoDCs and macrophages. n = 30 cells. (K) Representative time-lapse images of U2OS cells upon Salmonella infection (MOI = 20). Scale bar, 10 µm. (L) Immunofluorescence of THP-1 macrophages infected with Salmonella and stained with WGA. Scale bar, 5 µm (filopodia panel) and 20 µm (DLPs panel). (M) Quantification of filopodia and DLPs length upon Salmonella infection. (N) Invert confocal images visualized by vinculin staining in Salmonella infected THP-1 macrophages. Blue and green boxes depicting the region of cell body and DLPs, respectively. Bars, 20 µm. (O) Quantification of the mean intensity of vinculin in ROIs of cell body and DLPs in (N). n = 28 cells. (P) Representative fluorescent imaging revealing the diffusion of 0.5 mg/mL 70 kDa FITC-Dextran in the microchannel 6 h after loading. Line profile on the right panel illustrates the fluorescence intensity of FITC-Dextran along the microchannels. Scale bars, 60 µm. Data are presented as mean ± s.d. from three independent experiments. Dots in quantifications presented individual cells. P = 2.38284E-18 (B). P = 2.16145E-24 (C). P = 2.74828E-25 (D). P values from left to right (E): P = 0.89574, P = 0.60961, P = 0.787850183, P = 0.51197, P = 0.67727, P = 0.78709. P values from left to right (H): P = 0.00233, P = 0.00128. P = 2.07762E-09 (J). P = 0.00093 (O). ns P > 0.05; **P < 0.001; ***P < 0.001: unpaired two-tailed Student’s t test (BD, G, J). one-way/two-way ANOVA with Sidak’s analysis (E, H). Source data are available online for this figure.
Figure EV2
Figure EV2. DLPs formation is dependent on cytoskeleton.
(A) Pie chart shows the percentage of time spent in each stage of DLPs in wild-type THP-1 macrophages. (B) Quantification of the cell toxicity of the actin inhibitors. (C) Quantification of bacterial growth rate following the treatment of the actin inhibitors. (D) Representative images of actin filaments visualized by phalloidin in Veh., 0.5 µM Latrunculin B (LatB), 10 µM Blebbistatin, 40 µM CK666, 15 µM SMIFH2 and 1 µM NP-G2-044 treated THP-1 macrophages, respectively. Red and yellow magnified regions represent the podosome and contractile stress fibers (SF), respectively. Scale bars, 10 µm (in cell images) and 5 µm (in the magnified images). White dash lines outline cell contours. (E) Effects of 1 µM Nocodazole treatment on THP-1 macrophages for 1 h. The endogenous microtubule network was visualized by β-tubulin antibody staining. Scale bars, 20 µm. (F) Diagram of the Nocodazole treatment procedure. (G) Time-lapse images of THP-1 macrophages during Salmonella infection for 6 h with Nocodazole treatment (MOI = 20). Scale bars, 20 µm. (H) Pie charts show the percentage of three shapes in macrophages infected with salmonella for 6 h. Veh. n = 283 cells; Nocodazole treatment, n = 351 cells. (I) Representative images of endogenous vimentin in vehicle and 1 µM simvastatin treated cells. White and yellow dashed lines depict the regions of cell outline and vimentin network, respectively. Scale bars, 10 µm. (J) Schematic diagram of simvastatin treatment procedure. (K) Time-lapse images of THP-1 macrophages during Salmonella infection for 6 h with simvastatin treatment (MOI = 20). Scale bars, 20 µm. Yellow arrowheads depict DLPs, while the hollow arrowheads depict the diminishing DLPs. (L) Pie charts show the distribution of macrophage shapes following vehicle and simvastatin treatment with salmonella infection for 6 h. Veh., n = 366 cells; simvastatin treatment, n = 403 cells. (M) Pie chart shows the percentage of time spent in each stage of DLPs in VIM KO THP-1. Data are presented as mean ± s.d. from three independent experiments. P = 0.00040 (L). ns P > 0.05. ***P < 0.001: unpaired two-tailed Student’s t test (B, C, H, L). Source data are available online for this figure.
Figure EV3
Figure EV3. TLR4 is a key factor for DLPs formation.
(A) Representative images show the localization of NF-κB/P65 in THP-1 macrophages under mock or LPS-treated conditions. Scale bar, 20 µm. (B) Quantification of the nuclear P65 ratio relative to total cell count in (A). (C) Quantification of cell toxicity followingTAK-242 treatment. (D) Quantification of bacterial growth with TAK-242 treatment. Data are presented as mean ± s.d. from three independent experiments. Dots in quantifications presented individual cells. P = 2.27158E-07 (B). ns P > 0.05; ****P < 0.0001: unpaired two-tailed Student’s t test (BD). Source data are available online for this figure.
Figure EV4
Figure EV4. ARHGEF3 and RhoA is essential in DLPs formation.
(A) Biological process enrichment analysis of significantly upregulated genes in P + /P− iBMDMs challenged with LPS (count with average TPM). The top 10 enriched items are shown in the bubble chart. The colored bubbles from red to blue indicates the descending order of P. adjust value. The sizes of the bubbles are displayed from small to large in ascending order of gene counts. The x and y axis represent the gene ratio and the GO terms, respectively. (B) Heatmap shows the transcriptional levels of inflammatory cytokines by RNA sequencing. (C) Representative images showing the F-actin visualized by phalloidin and macrophage surface markers CD64 and CD32 in P− and P+ iBMDMs with LPS treatment for 6 h. Bars, 10 µm. (D) Representative images showing the F-actin visualized by phalloidin and macrophage surface markers CD14 in P− and P+ iBMDMs with LPS treatment for 6 h. Bars, 10 µm. (E) quantification of the mean intensity of macrophage surface markers CD64, CD32, and CD14 in P− and P+ iBMDMs in (C) and (D). (FH) Quantifications of ARHGEF11, ARHGAP18, ARHGAP10 transcriptional levels by qRT-PCR in P- and P+ iBMDMs upon LPS stimulation. (I) Western blot analysis of ARHGEF3 upon LTA treatment. (J) Schematic diagram showing predicted NF-κB binding site in the ARHGEF3 promoter. (K, L) RT-qPCR analysis of DNA pulled down with IgG or NF-κB antibody upon LPS stimulus. (M) Quantification of the cell toxicity upon PDTC treatment. (N) Western blot analysis of ARHGEF3 upon LPS, or combined LPS and PDTC treatment. (O) Western blot analysis demonstrating ARHGEF3 knockdown efficiency in THP-1 macrophages. (P) Pie charts show the percentage of three shapes in macrophages with RNAi treatment of negative control, ARHGEF11 and ARHGAP10 and with Salmonella infection for 6 h. (Q) Western blot analysis of pMLC and MLC upon Y-27632 treatment in THP-1 macrophages. (R) Quantification of bacterial growth rate upon Y-27632 treatment. (S) Quantification of cell toxicity upon Y-27632 treatment with Salmonella infection for 6 h. (T, U) Representative images of DLPs in iBMDMs (T) and RAW264.7 (U) stimulated by LPS and stained with ARHGEF3 and TLR4 antibodies. Yellow arrows depict the DLPs. (V) The distribution of ARHGEF3 and TLR4 from DLPs to cell body. P-region, the specific pseudopods region; C-region, Cell body region. (W) Line profiles of related fluorescence intensity of ARHGEF3 and TLR4 in (V). Data are presented as mean ± s.d. from three independent experiments. Dots in quantifications presented individual cells. P values from left to right (E): P = 0.00288, P = 0.00189, P = 0.00425. P values from left to right (F): P = 0.00054, P = 0.45742. P values from left to right (G): P = 0.00150, P = 0.00067. P values from left to right (H): P = 0.00243, P = 0.14849. P values from left to right (L): P = 0.39404, P = 0.03801. ns P > 0.05; *P < 0.05; **P < 0.01; ***P < 0.001: one-way ANOVA with Sidak’s analysis (P), two-way ANOVA with Sidak’s analysis (FH, L), unpaired two-tailed Student’s t test (E, M, R, S), Benjamini–Hochberg (BH) analysis (A). Source data are available online for this figure.
Figure EV5
Figure EV5. Cytoskeleton and related signaling are essential in DLPs formation.
(A) Quantification of infection rates in THP-1 macrophages with fluorescence-tagged or non-tagged Salmonella. (B) Pie charts show the percentage of three shapes of macrophages with Salmonella infection for 6 h in (A). (C) Quantification of the average speed of inward moving Salmonella. n = 78 cells. (D) Schematic diagram illustrating the CFU assay performed at distinct infection durations. (E) Representative images of the CFU assay at different time point post Salmonella infection of THP-1 macrophages. (F) Quantification of intracellular Salmonella over time in THP-1 macrophages. (G) Western blot analysis of vimentin in WT and VIM KO iBMDM. (H, I) Quantification of the bacterial load upon Salmonella infection in THP-1 macrophages treatment with TAK242 or Y-27632. (J) Schematic diagram of extraintestinal infection mouse model incorporating macrophage re-infusion. (K, L) Quantification of bacterial load indicated by colony forming unit (CFU) in peritoneal lavage fluid (K) and liver (L) infected with Salmonella. (MO) Quantitative RT-qPCR analysis of the expression levels of inflammatory markers in the spleen. Data are presented as mean ± s.d. from three independent experiments. Dots in quantifications presented individual cells. P values from left to right (F): P = 0.65388, P = 0.00094, P = 0.00094. P = 0.00558515 (H). P = 0.00124 (I). P = 0.00805 (K). P = 0.00243 (L). P = 0.03700 (M). P = 0.04913 (N). P = 0.04496 (O). ns P > 0.05; *P < 0.05; **P < 0.01; ***P < 0.001: unpaired two-tailed Student’s t test (H, I, KO), one-way ANOVA followed by a Tukey’s post hoc test (A, F). Source data are available online for this figure.

References

    1. Alexandraki I, Palacio C (2010) Gram-negative versus Gram-positive bacteremia: what is more alarmin(g)? Crit Care 14:161 - PMC - PubMed
    1. Alpuche-Aranda CM, Racoosin EL, Swanson JA, Miller SI (1994) Salmonella stimulate macrophage macropinocytosis and persist within spacious phagosomes. J Exp Med 179:601–608 - PMC - PubMed
    1. Anes E (2017) Acting on actin during bacterial infection. In: Jimenez-Lopez JC (ed.) Cytoskeleton—structure, dynamics, function and disease. IntechOpen, Rijeka. pp 27–44
    1. Arthur WT, Ellerbroek SM, Der CJ, Burridge K, Wennerberg K (2002) XPLN, a guanine nucleotide exchange factor for RhoA and RhoB, but not RhoC. J Biol Chem 277:42964–42972 - PubMed
    1. Binley KE, Ng WS, Tribble JR, Song B, Morgan JE (2014) Sholl analysis: a quantitative comparison of semi-automated methods. J Neurosci methods 225:65–70 - PubMed

MeSH terms

LinkOut - more resources