

Relationship between nutritional assessment and nutritional risk screening in hospitalized children with cerebral palsy: a single-center prospective study
- PMID: 40721852
- PMCID: PMC12304268
- DOI: 10.1038/s41598-025-12628-w
Relationship between nutritional assessment and nutritional risk screening in hospitalized children with cerebral palsy: a single-center prospective study
Abstract
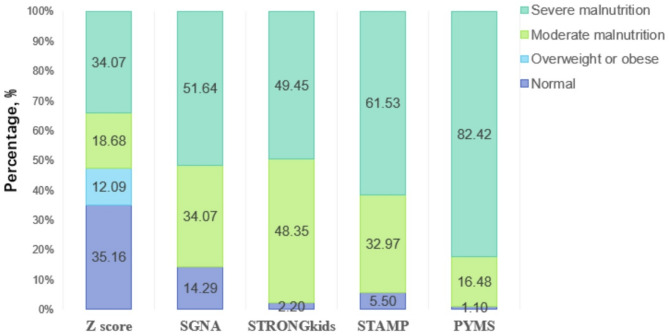
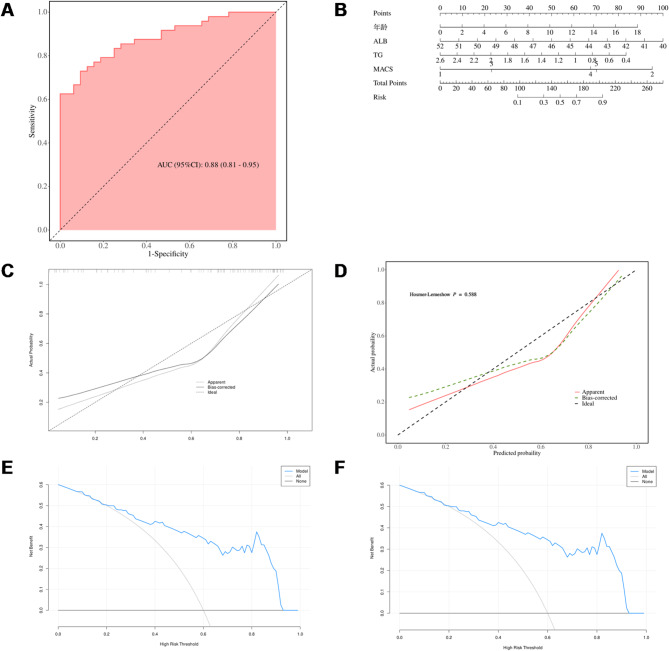
Cerebral palsy (CP) strongly affects the growth and development of children and is accompanied by a high risk of malnutrition. This study aims to characterize the nutritional status of hospitalized children with CP, evaluate the efficacy of four nutritional risk screening tools, analyze influencing factors of malnutrition. In our study, 64.8% of all 91 patients were malnourished. Nutritional status was associated with the gross motor function classification system (GMFCS) grade, the manual ability classification system (MACS) grade, caregiver concern, and age (P < 0.05). Compared with Z score, the sensitivity and consistency of the four malnutrition risk screening tools were lower. Multivariate logistic regression analysis revealed that older age, lower albumin (ALB) concentration, and MACS grade II were independent influencing factors for malnutrition. The prediction model with 4 variables, including age, albumin, triglyceride and MACS grade, was included, the AUC (95% CI) was 0.88 (0.81-0.95), and the P value of the H-L goodness-of-fit test was 0.588, which has practical value. We indicate that the rate of malnutrition in hospitalized children with CP remains high and still requires extensive attention from society, especially in clinical nutrition.
Keywords: Cerebral palsy; Children; Effectiveness; Malnutrition; Nutritional assessment; Nutritional risk screening.
© 2025. The Author(s).
Conflict of interest statement
Declarations. Ethics approval and consent to participate: This study received ethical approval (Number: GRH-2022-WZ-05) from the Ethics Review Committee of the institution where the study was conducted. and written informed consent was provided by a parent or legal representative in accordance with local law. This study was conducted in accordance with the Declaration of Helsinki. Consent for publication: Not applicable. Competing interests: The authors declare no competing interests.
Figures

References
-
- Rosenbaum, P. et al. A report: the definition and classification of cerebral palsy April 2006. Dev Med. Child. Neurol. Suppl.109, 8–14 (2007). - PubMed
-
- Palisano, R. J., Cameron, D., Rosenbaum, P. L., Walter, S. D. & Russell, D. Stability of the gross motor function classification system. Dev. Med. Child. Neurol.48, 424–428 (2006). - PubMed
MeSH terms
LinkOut - more resources
Full Text Sources
Medical
Miscellaneous
