. 2025 Jul 28;8(1):1115.
doi: 10.1038/s42003-025-08520-y.

OH2 oncolytic virus inhibits non-small-cell lung cancer metastasis via β-catenin pathway suppression

Affiliations

OH2 oncolytic virus inhibits non-small-cell lung cancer metastasis via β-catenin pathway suppression

Han Hu et al. Commun Biol. .

Abstract

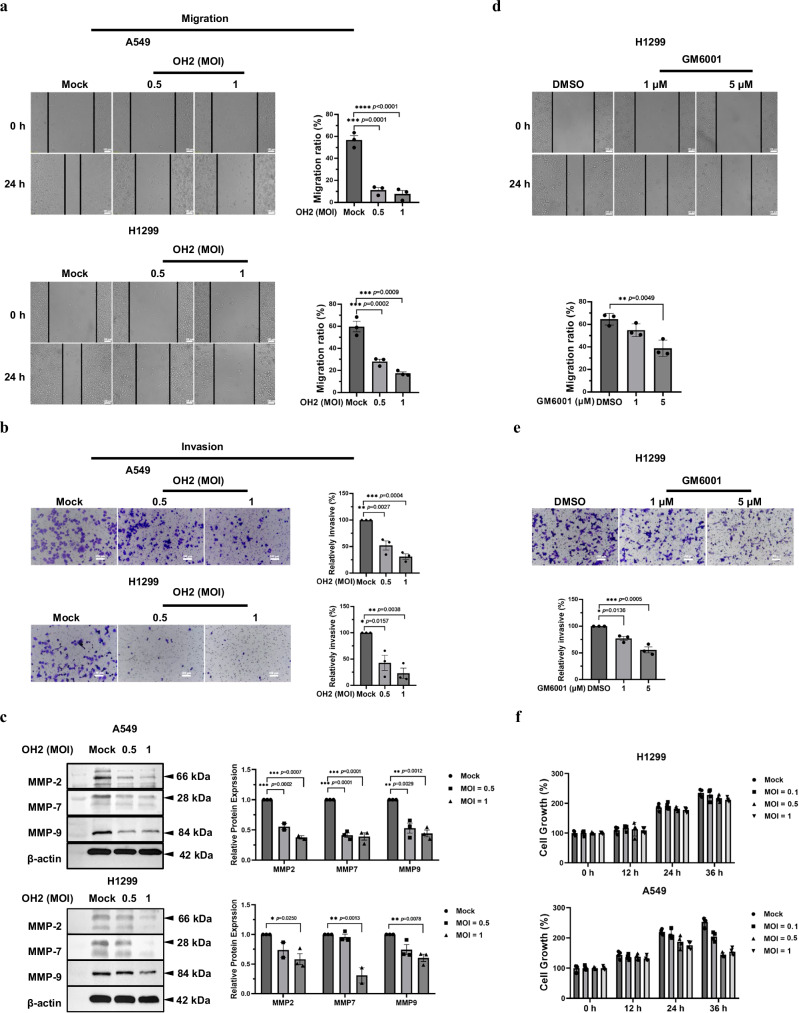
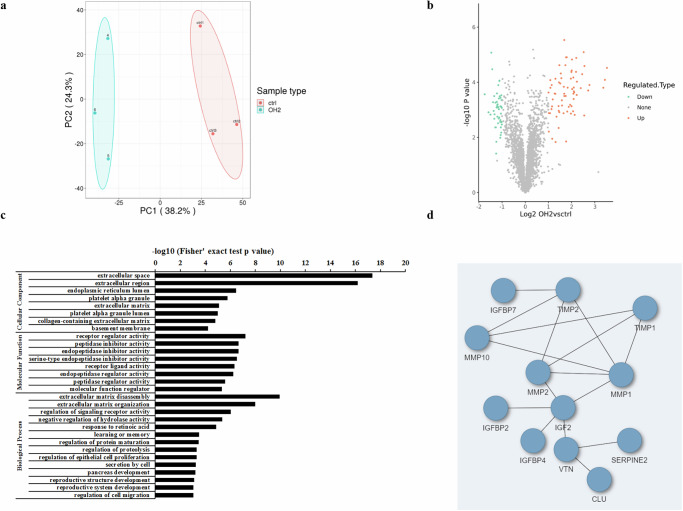
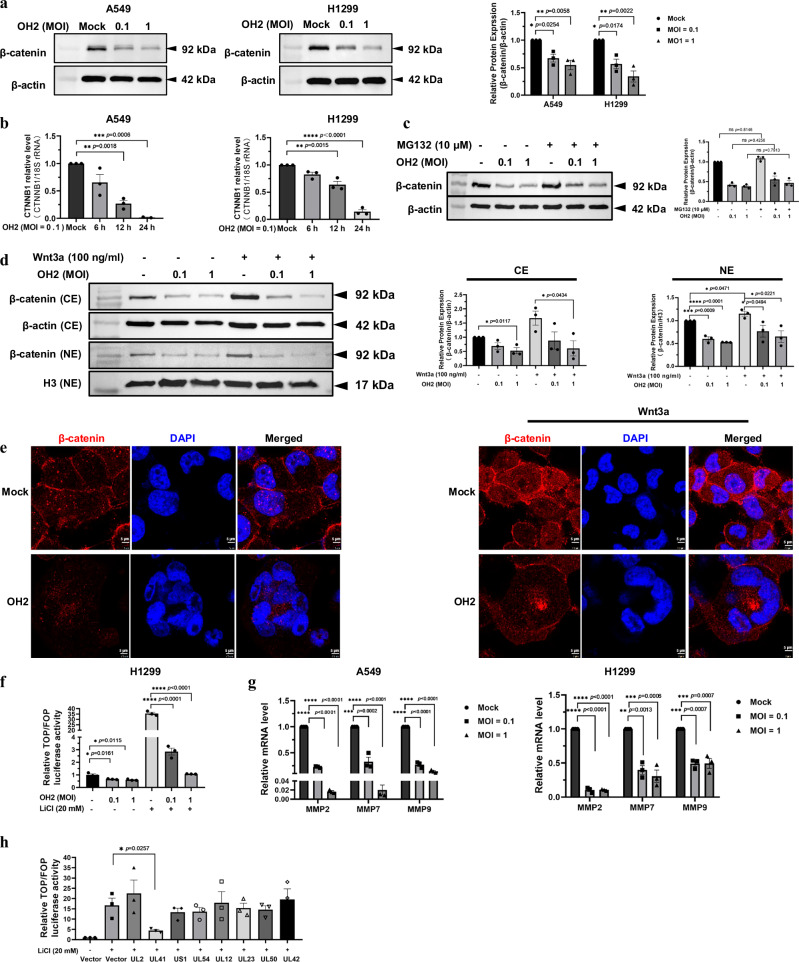
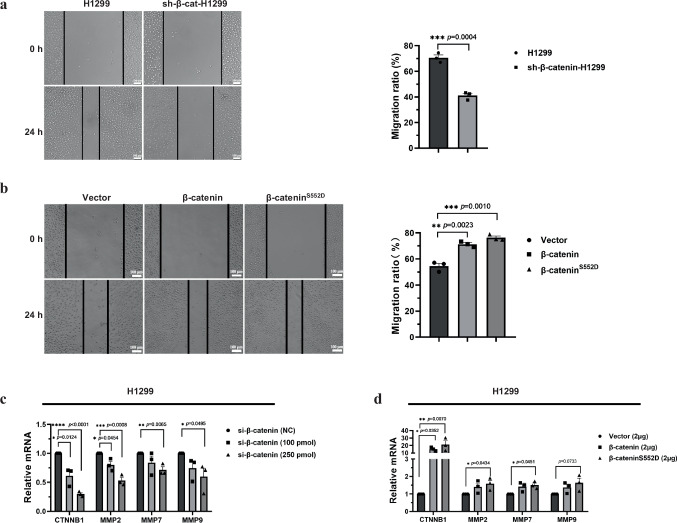
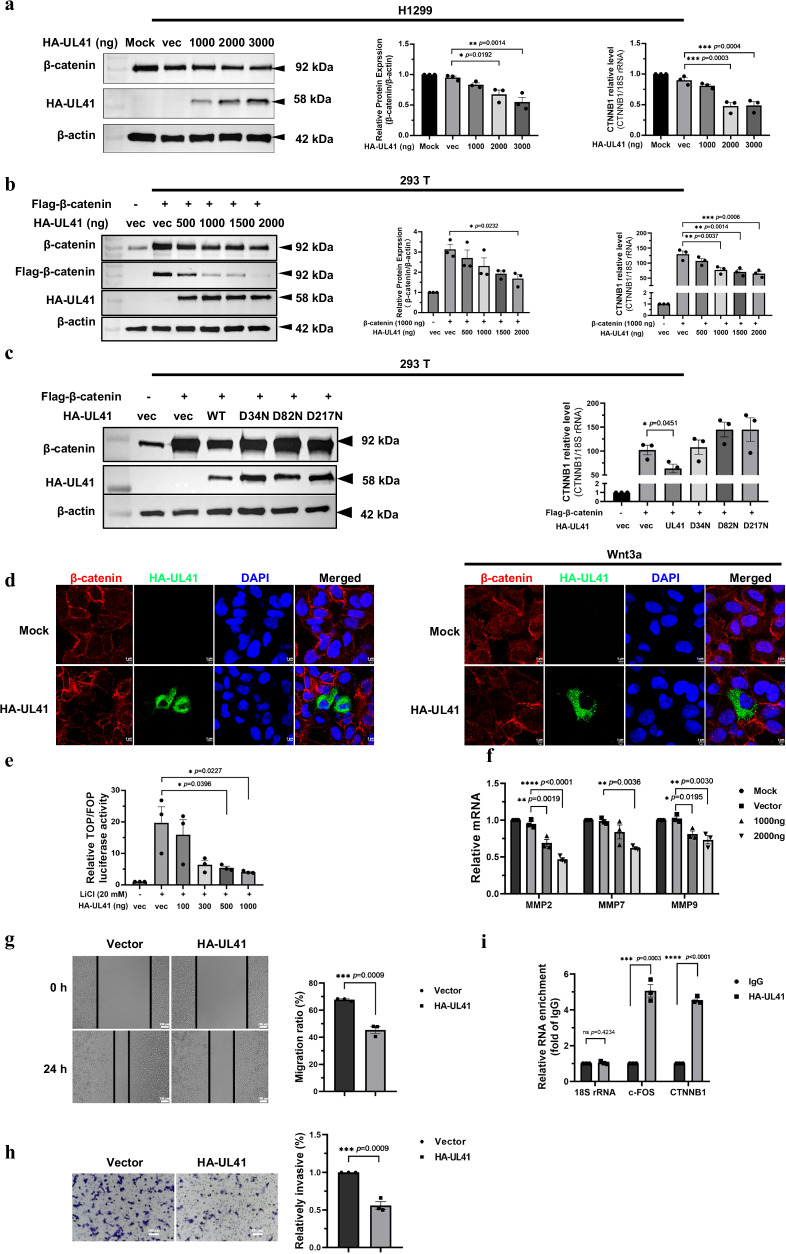
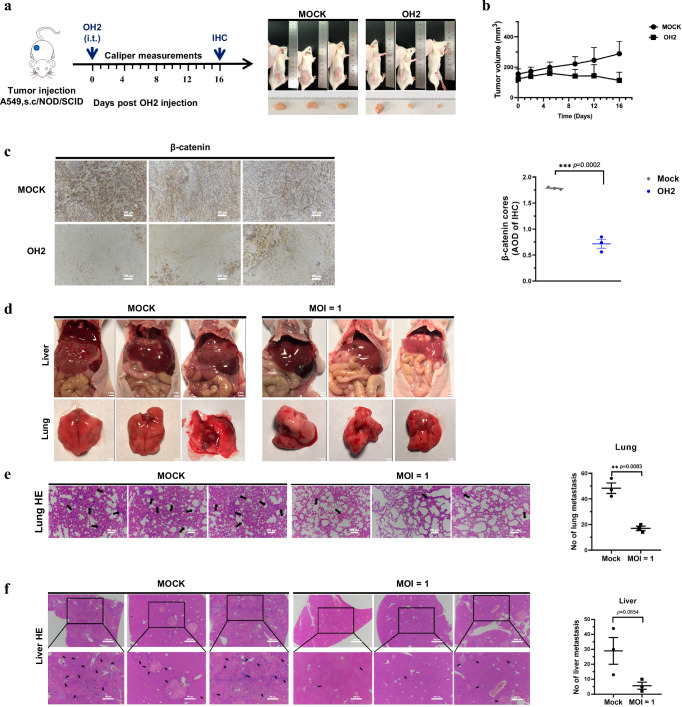
The five-year survival rate for non-small-cell lung cancer (NSCLC) remains poor, primarily due to tumor invasion and metastasis. This study evaluates the anti-metastatic potential of the oncolytic virus OH2 in NSCLC. OH2 inhibits migration and invasion of NSCLC by downregulating β-catenin, as demonstrated in vitro and in a lung metastasis model. OH2 reduces β-catenin mRNA levels, suppressing its transcriptional activity and downstream expression of Matrix Metalloproteinases (MMPs), key mediators of extracellular matrix degradation. Proteomic analysis of the secretome confirms reduced MMPs expression following OH2 treatment. Mechanistically, the OH2 tegument protein UL41 is identified as a critical factor that degrades β-catenin mRNA, thus inhibiting β-catenin nuclear transcriptional activity. These findings reveal a novel anti-metastatic mechanism of OH2 via disruption of the β-catenin/MMPs axis and support its potential as a therapeutic candidate for invasive NSCLC.


Conflict of interest statement

Competing interests: The authors declare no competing interests.

Figures

Fig. 1
Fig. 1. OH2 can inhibit migration and invasion of NSCLC cell lines through MMP2, MMP7, and MMP9.
a Wound healing assay was performed on A549 and H1299 cells treated with or without OH2. Images shown are representative at time 0 h and 24 h post-treatment (left) and migration was quantified from images using ImageJ software, and graphs show means ± SEM from three independent experiments (right). b Transwell invasion assay was performed on A549 and H1299 cells treated with or without OH2 by the 24-transwell system. Representative photomicrographs of invading cells stained with crystal violet (left) and the number of invading cells and graphs show means ± SEM from three independent experiments (right). Scale bars, 100 μm. c A549 and H1299 cells were infected with or without OH2. Cells were lysed at 24 h post-infection and the samples were analyzed by western blotting. Western blot analysis (left) and quantification show means ± SEM from three independent experiments (right) of MMP2, MMP7, and MMP9 were performed. d Wound healing assay was performed on H1299 cells treated with or without GM6001. Data shown are means ± SEM from three independent experiments. e Transwell invasion assay was performed on H1299 cells treated with or without GM6001. Scale bars, 100 μm. Data shown are means ± SEM from three independent experiments. Statistical analysis was performed using one-way ANOVA with Tukey’s post hoc test in (ae). *p < 0.05; **p < 0.01; ***p < 0.001; ****p < 0.0001. f A549 and H1299 were incubated with or without OH2 and analyzed by CCK8 assay at various time points. Data are presented as means ± SD.
Fig. 2
Fig. 2. Gene ontology analysis of differently expressed proteins in OH2 infected A549 cells.
a A549 of proteomic with or without OH2 treatment represented in a two-dimensional space. b Volcano plot showed the proteins that were differentially secreted between OH2-treated and mock treated A549 cells. The proteins with the largest and most statistically significant absolute fold-change between OH2 treatment and control are those at the upper left (green dots) and right corners (red dots). c The GO enrichment analyses of the significantly downregulated proteins by OH2 treatment compared to control. d The protein-protein interaction analysis of down-regulated proteins in OH2 treated A549 cells by STRING.
Fig. 3
Fig. 3. OH2 reduces β-catenin levels and transcriptional activity.
a H1299 and A549 cells were infected with or without OH2. Cells were lysed and the samples were subjected to western blot analysis (left). The quantification data shown are means ± SEM from three independent experiments (right). Statistical analyses were performed using one-way ANOVA with Tukey’s post hoc test. *p < 0.05; **p < 0.01. b H1299 and A549 cells were infected with or without OH2. And the samples were subjected to qRT-PCR analysis. Data shown are means ± SEM from three independent experiments. Statistical analyses were performed using one-way ANOVA with Tukey’s post hoc test. **p < 0.01, ***p < 0.001, ****p < 0.0001. c MG132 does not affect the β-catenin inhibition of OH2. H1299 were treated with OH2 in the absence or presence of MG132 (10 μM). Western blot analysis (left) and quantification (right) of β-catenin were performed. The quantification data shown are means ± SEM from three independent experiments (right). d OH2 reduces β-catenin protein levels in both cytoplasmic and nuclear fractions: H1299 cells were infected with OH2 or mock infection, followed by treatment with Wnt3a for 6 h, followed by nuclear fractionation and immunoblotting. The band density was quantified using ImageJ software. Data are represented as means ± SEM from three independent experiments. e The effects of OH2 on the expression and distribution of β-catenin were explored by IF labeling in the indicated cells with or without Wnt3a (100 ng/mL) stimulation. Magnification ×1000. f OH2 inhibited the transcriptional activity of β-catenin. H1299 and A549 cells infected with OH2 were transfected with TOP-Flash or FOP-Flash. Transfection efficiency was normalized by co-transfection with pRL-TK. Luciferase activity was measured 48 h post transfection by the dual-luciferase assay. Data are shown as the mean ± SEM. g OH2 negatively regulates the expression of MMPs by qRT-PCR analysis. Data shown are mean ± SEM of three independent experiments. Statistical analyses were performed using one-way ANOVA with Tukey’s post hoc test. **p < 0.01; ***p < 0.001; ****p < 0.0001. h Overexpression of UL41 blocks the transcriptional activity of wild type β-catenin: H1299 cells were transfeted with OH2 viral proteins, followed by dual-luciferase assay. Data are represented as means ± SEM from three independent experiments. Statistical analyses were performed using Student’s t test in (c, d, f, h). ns not significant; *p < 0.05; ***p < 0.001; ****p < 0.0001.
Fig. 4
Fig. 4. β-catenin was positively correlated with lung cancer migration and MMPs transcription.
a β-catenin knockdown suppressed H1299 cell migration. sh-β-catenin H1299 cells stably expressing shRNA targeting β-catenin. Images shown are representative at time 0 h and 24 h post-treatment (left) and migration was quantified from images, and graphs show means ± SEM from three independent experiments (right). ***p < 0.001 (Student’s t test). b H1299 cells were transfected with indicated plasmids of β-catenin-S552D and β-catenin, followed by wound-healing assay. Images shown are representative at time 0 h and 24 h post-treatment (left) and migration was quantified from images, and graphs show means ± SEM from three independent experiments (right). c H1299 cells transfected with si-β-catenin, followed by qRT-PCR analysis. Data are shown as mean ± SEM of three independent experiments. d H1299 cells were transfected with indicated plasmids of β-catenin-S552D and β-catenin, followed by qRT-PCR analysis to detect the mRNA expression of CTNNB1 and MMPs as indicated. Data are shown as mean ± SEM of three independent experiments. Statistical analysis was performed using one-way ANOVA with Tukey’s post hoc test in (bd). *p < 0.05; **p < 0.01; ***p < 0.001; ****p < 0.0001.
Fig. 5
Fig. 5. UL41 abrogates the activity of β-catenin by degrading its mRNA.
a Ectopic expression of UL41 decreased the expression of endogenous β-catenin in H1299 cells. H1299 cells were transfected with HA-UL41 plasmid for 48 h, and then the cells were harvested and analyzed by western blotting (left) or qRT-PCR analysis (right). The band density was quantified using ImageJ software (middle). Data are represented as means ± SEM from three independent experiments. *p < 0.05, **p < 0.01, ***p < 0.001 (Student’s t test). b OH2 tegument protein UL41 inhibits the ectopic expression of β-catenin. HEK293T cells were cotransfected with Flag-β-catenin and HA-UL41 plasmids. At 48 h posttransfection, the cells were harvested and subjected to western blot analysis (left) or qRT-PCR analysis (right). The band density was quantified using ImageJ software (middle). Data are represented as means ± SEM from three independent experiments. *p < 0.05, **p < 0.01, ***p < 0.001 (Student’s t test). c 293T cells cotransfected with Flag-β-catenin and HA-UL41 or mutants. At 48 h posttransfection, the cells were harvested and subjected to western blot analysis (left) or qRT-PCR analysis (right). Data are represented as means ± SEM from three independent experiments. *p < 0.05 (Student’s t test). d UL41 reduces β-catenin protein levels in both cytoplasmic and nuclear fractions: H1299 cells transfected with HA-UL41 were treated with (right) or without Wnt3a (left), followed by immunofluorescence in the indicated cells. e Overexpression of HA-UL41 blocks the transcriptional activity of β-catenin: H1299 cells transfected with HA-UL41 plasmids were treated with or without LiCl, followed by TCF/β-catenin reporter dual-luciferase assay. Date are shown as the mean ± SEM of three independent experiments. f H1299 cells transfected with HA-UL41, followed by qRT-PCR analysis. Data are shown as mean ± SEM of three independent experiments. g H1299 cells were transfected with indicated plasmid of HA-UL41, followed by wound-healing assay. Data are shown as mean ± SEM of three independent experiments. ***p < 0.001 (Student’s t test). h H1299 cells were transfected with indicated plasmid of UL41-HA, followed by invasion assay. Data are shown as mean ± SEM of three independent experiments. ***p < 0.001 (Student’s t test). i RIP-qPCR confirmed UL41 binding to CTNNB1 mRNA. 18S rRNA and c-FOS served as negative and positive controls, respectively. Data are shown as mean ± SEM of three independent experiments. ***p < 0.001 (Student’s t test). Statistical analysis was performed using one-way ANOVA with Tukey’s post hoc test in (a, b, e, f). *p < 0.05; **p < 0.01; ***p < 0.001; ****p < 0.0001.
Fig. 6
Fig. 6. Inhibition of lung cancer metastasis by OH2 treatment in vivo.
a A549 cells were inoculated into the right flanks of nude mice. OH2 or PBS (mock) was injected into the tumors. The elements in this image were created using Adobe Photoshop software. Macroscopic appearance of mice and isolated tumors was observed on day 16 after treatment. b Tumor volume growth curves of the OH2 and mock-treated groups. Data are expressed as mean ± SEM (n = 3 per group). c Histologic analysis of A549 tumors. Paraffin-embedded sections of A549 tumors were stained with anti-β-catenin antibody. Data are represented as means ± SEM (n = 3). d 5 ×10⁶ disaggregated A549 cells premixed with PBS or OH2 at MOI = 1 in PBS were injected i.v. by tail vein into BALB/c nude mice. Representative pictures of fixed lungs and livers at 3 weeks after injection were shown. e Representative H&E staining pictures of lung (left). Arrows, metastasis nodules. metastasis nodules were quantified (right). f Representative H&E staining pictures of liver (left). Arrows, metastasis nodules. metastasis nodules were quantified (right). Data are represented as means ± SEM (n = 3). Statistical analyses were performed using Student’s t test in (c, e, f). **p < 0.01; ***p < 0.001.

Similar articles

References

    1. Siegel, R. L., Miller, K. D., Wagle, N. S. & Jemal, A. Cancer statistics. 2023. Ca. Cancer J. Clin.73, 17–48 (2023). - PubMed
    1. Arbour, K. C. & Riely, G. J. Systemic therapy for locally advanced and metastatic non-small cell lung cancer: a review. JAMA322, 764–774 (2019). - PubMed
    1. Simeone, J. C., Nordstrom, B. L., Patel, K. & Klein, A. B. Treatment patterns and overall survival in metastatic non-small-cell lung cancer in a real-world, US setting. Future Oncol.15, 491–502 (2019). - PubMed
    1. Shalhout, S. Z., Miller, D. M., Emerick, K. S. & Kaufman, H. L. Therapy with oncolytic viruses: progress and challenges. Nat. Rev. Clin. Oncol.20, 160–177 (2023). - PubMed
    1. Malhotra, J. & Kim, E. S. Oncolytic viruses and cancer immunotherapy. Curr. Oncol. Rep.25, 19–28 (2023). - PubMed

MeSH terms