. 2025 Jul 28;30(1):93.
doi: 10.1186/s11658-025-00766-y.

Xanthosine alleviates myocardial ischemia-reperfusion injury through attenuation of cardiomyocyte ferroptosis

Affiliations

Xanthosine alleviates myocardial ischemia-reperfusion injury through attenuation of cardiomyocyte ferroptosis

Yang Xu et al. Cell Mol Biol Lett. .

Abstract

Background: Ischemic heart disease remains a leading cause of morbidity and mortality worldwide, with myocardial ischemia-reperfusion (I/R) injury significantly contributing to cardiomyocyte death and poor outcomes post-acute myocardial infarction (AMI). Emerging evidence highlights metabolic changes during myocardial injury, particularly in purine metabolism. This study investigates the protective role of xanthosine (XTS), a purine metabolism intermediate, in alleviating I/R injury.

Methods: Neonatal and adult mouse myocardial tissues post-myocardial infarction (MI) were analyzed using untargeted and targeted metabolomics to explore metabolic profiles. The effects of XTS on I/R injury were evaluated in vivo using a murine I/R model and in vitro with hypoxia/reoxygenation-treated neonatal rat cardiomyocytes (NRCMs). Cardiac function, fibrosis, apoptosis, oxidative stress markers, and ferroptosis-related pathways were assessed via echocardiography, biochemical assays, western blotting, and electron microscopy. Integrated drug affinity responsive target stability (DARTS)-based drug target screening and RNA-seq transcriptomic profiling elucidate XTS-mediated mechanisms against I/R injury.

Results: Metabolomics revealed distinct differences in purine metabolism between neonatal and adult mice post-MI, with significant XTS accumulation observed in neonatal hearts. In vivo, XTS treatment in adult mice enhanced left ventricular function, reduced fibrosis, and alleviated lipid peroxidation and mitochondrial damage post-I/R injury. In vitro, XTS significantly improved cardiomyocyte viability, reduced oxidative stress, and mitigated ferroptosis by restoring glutathione peroxidase 4 (GPX4) levels and reducing acyl-coenzyme A synthetase long-chain family member 4 (ACSL4) expression. Mechanistically, XTS stabilized metabolic enzymes, upregulated L-arginine and glutathione (GSH) to mitigate reactive oxygen species(ROS), and inhibited ferroptosis.

Conclusions: XTS, a key purine metabolism intermediate, improves cardiac remodeling and function following I/R injury by suppressing ferroptosis and reducing mitochondrial ROS production. These findings provide novel insights into the therapeutic potential of XTS as an adjunctive treatment for patients with AMI undergoing revascularization.

Keywords: Ferroptosis; Ischemia–reperfusion (I/R) Injury; Purine metabolism; Reactive oxygen species (ROS); Xanthosine (XTS).


Conflict of interest statement

Declarations. Ethics approval and consent to participate: The animal procedures were approved by the Animal Ethics Committee of Southeast University (no. 20240219008, 19 February 2024). All of the experiments about animals were performed in accordance with the Basel Declaration. Animal Ethics Committee of Southeast University strictly adheres to the principles and guidelines established by the International Council for Laboratory Animal Science (ICLAS) to ensure that our animal research meets international ethical standards. Consent for publication: Not applicable. Competing interests: The authors declare that they have no competing interests.

Figures
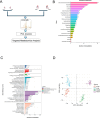
Fig. 1
Fig. 1
Metabolic profiling revealed significant metabolic differences between neonatal and adult mice post-myocardial infarction. A Schematic illustration of untargeted and targeted metabolomics analysis. B Bar chart showing the distribution of identified metabolite categories in the metabolomic analysis of myocardial tissue. C Distribution of identified metabolites across different KEGG pathway categories in myocardial tissue metabolomics analysis. D Principal component analysis (PCA) score plot illustrate distinct clustering of samples in the P1M6, P1S6, P56M6, and P56S6 groups, indicating significant metabolic differences between the groups
Fig. 2
Fig. 2
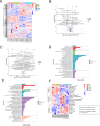
Purine metabolism exhibited significant changes in neonatal and adult mice post-MI. A Heatmap showing differences in metabolite expression levels and clustering relationships among the groups. B Volcano plot showing significant changes in metabolites between the P1M6 and P1S6 groups, with upregulated, downregulated, and non-significantly changed metabolites marked in red, blue, and gray, respectively. C Volcano plot showing significant changes in metabolites between the P56M6 and P56S6 groups, with upregulated, downregulated, and non-significantly changed metabolites marked in red, blue, and gray, respectively. D KEGG pathway enrichment analysis shows the distribution of differential metabolites across various pathways between the P1M6 and P1S6 groups (TOP 50). E KEGG pathway enrichment analysis shows the distribution of differential metabolites across various pathways between the P56M6 and P56S6 groups (TOP 50). F Heatmap shows differences in the expression levels of metabolites involved in the purine metabolism pathway and their clustering relationships among the groups. #P < 0.05(P56S6 VS. P1S6); *P < 0.05(P1M6 VS. P1S6); P < 0.05(P56M6 VS. P56S6). Two-way ANOVA was used for statistical analysis
Fig. 3
Fig. 3
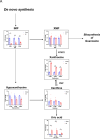
XTS was significantly accumulated in the infarcted myocardium of neonatal mice. A Targeted metabolomics reveals changes in the levels of six metabolites within the purine metabolism pathway at 3, 6, and 9 days post-P1MI, with values shown relative to age-matched sham-operated mice. B Western blot analysis shows the protein expression levels of PNP and NT5C2 in the ventricles of P1S3 and P1M3 mice. C Western blot analysis shows the protein expression levels of PNP and NT5C2 in the ventricles of P56S3 and P56M3 mice. D Bar chart illustrating the targeted quantification of XTS in myocardial tissue of neonatal mice at postnatal days 1, 7, and 56. E Relative mRNA expression levels of PNP and NT5C2 in the ventricles of mice at different developmental stages (n = 3). F Western blot analysis shows the protein expression levels of PNP and NT5C2 in the ventricles of mice across various developmental stages
Fig. 3
Fig. 3
XTS was significantly accumulated in the infarcted myocardium of neonatal mice. A Targeted metabolomics reveals changes in the levels of six metabolites within the purine metabolism pathway at 3, 6, and 9 days post-P1MI, with values shown relative to age-matched sham-operated mice. B Western blot analysis shows the protein expression levels of PNP and NT5C2 in the ventricles of P1S3 and P1M3 mice. C Western blot analysis shows the protein expression levels of PNP and NT5C2 in the ventricles of P56S3 and P56M3 mice. D Bar chart illustrating the targeted quantification of XTS in myocardial tissue of neonatal mice at postnatal days 1, 7, and 56. E Relative mRNA expression levels of PNP and NT5C2 in the ventricles of mice at different developmental stages (n = 3). F Western blot analysis shows the protein expression levels of PNP and NT5C2 in the ventricles of mice across various developmental stages
Fig. 4
Fig. 4
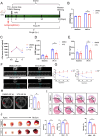
XTS treatment enhanced cardiac function and reduced fibrosis after ischemia–reperfusion injury in adult mice. A Experimental design: Eight-week-old adult mice received intraperitoneal injections of XTS (100 mg/kg). At 24 h post-MI/R injury, TUNEL staining and TTC–Evans blue double staining were performed. Myocardial edema was assessed on day 3 using MRI, myocardial cell proliferation was evaluated on day 14, and fibrosis was analyzed on day 28. Cardiac function was assessed at multiple time points using echocardiography. B At 21 days post-MI/R injury, heart weight/body weight (HW/BW) ratio was measured in mice treated with intraperitoneal injection of either DMSO or XTS (n = 6 mice per group). C Serum cTnI levels were detected using ELISA at 12 h, 3 days, and 6 days post-MI/R in DMSO- or XTS-treated mice (n = 6 mice per group). D Levels of lipid peroxidation product 4-HNE in DMSO or XTS treated mice 7 days after I/R surgery (n = 5 mice per group). E Levels of lipid peroxidation product MDA in the ventricles of DMSO- and XTS treated mice 7 days after I/R surgery (n = 6 mice per group). FG LVEF and LVFS were measured by echocardiography at 1, 7, 14, and 21 days after I/R surgery (n = 7–8 mice per group). H At 3 days post I/R surgery, T2-weighted MRI imaging was used to depict the myocardial edema area in DMSO and XTS treated mice. The edema area was quantified and calculated as a proportion of the LV area (n = 3 mice per group). I Masson trichrome staining of heart sections from DMSO and XTS treated mice. The hearts were collected 28 days after I/R surgery (n = 6 mice per group, scale bar = 1 mm). J TTC–Evans Blue double staining of heart sections from DMSO and XTS treated mice. The hearts were collected 24 h after I/R surgery, and the infarct area (IF), area at risk (AAR), and LV were assessed (n = 6 mice per group, scale bar = 1 mm)
Fig. 5
Fig. 5
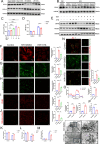
Explorations for the underlying mechanisms in the improvement of cardiac functions after I/R injury with respect to XTS. A Western blot analysis of GPX4 and ACSL4 in myocardial tissue from mice treated with XTS or DMSO, subjected to sham or I/R injury, with hearts collected 24 h post-reperfusion. B Western blot analysis of GPX4 in H9c2 treated with DMSO or XTS (10 μM) under normoxic or H/R conditions. C ATP levels in NRCMs treated with XTS or DMSO and subjected to H/R (n = 6). D LDH levels in NRCMs treated with XTS (10 μM) or DMSO under normoxic or H/R conditions (n = 6). E Western blot analysis of GPX4 and ACSL4 in NRCMs treated with XTS (10 μM) or DMSO under normoxic or H/R conditions. F Detection of Fe2⁺ levels in NRCMs treated with XTS (10 uM) or DMSO under normoxic or H/R conditions using the FerroOrange fluorescent probe (scale bar = 10 μm, n = 5). G Fluorescence staining of lipid peroxidation products in NRCMs treated with XTS (10 μM) or DMSO under normoxic or H/R conditions (scale bar = 10 μm, n = 5). HI Detection of ROS levels in NRCMs treated with XTS (10 μM) or DMSO under normoxic or H/R conditions using the DCFH-DA and DHE fluorescent probe (scale bar = 100 um, n = 5). J Detection of mitochondrial reactive oxygen species (mROS) levels in NRCMs treated with XTS (10 μM) or DMSO under normoxic or H/R conditions using MitoSOX Red staining (scale bar = 50 um, n = 5). K GSH levels in NRCMs treated with XTS (10 μM) or DMSO and subjected to normoxic or H/R conditions (n = 6).L SOD levels in NRCMs treated with XTS (10 μM) or DMSO and subjected to normoxic or H/R conditions (n = 6). M MDA levels in NRCMs treated with XTS (10 μM) or DMSO and subjected to normoxic or H/R conditions (n = 6). N Fluorescence staining of JC-1 in the primary cardiomyocytes treated with XTS (10 uM) or DMSO. In cells with high mitochondrial membrane potential (ΔΨm), JC-1 forms complexes known as J-aggregates that emit an orange to red fluorescence. In cells with low ΔΨm, JC-1 remains in the monomeric form, which emits a green fluorescence (bar = 20 μm). O The effect of XTS (10 uM) on the OCR was measured with a Seahorse XF96 snalyzer. P Representative transmission electron microscopy images and corresponding relative Flameng scores of NRCMs treated with XTS (10 μM) or DMSO and subjected to H/R (n = 3 per group); scale bars = 2 μm (left) and 600 nm (right)
Fig. 6
Fig. 6
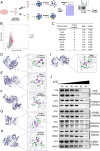
Screening and validation of potential XTS binding targets. A Flowchart illustrating the experimental workflow of DARTS combined with LC-MS, starting from cell lysis supernatant, followed by pronase treatment, SDS-PAGE separation, and LC-MS analysis to identify target proteins. B Volcano plot showing differentially expressed proteins (DEPs) detected by LC-MS. Red dots represent significantly upregulated and proteins (|FC|> 2, Q-value < 0.05). C List of XTS-binding candidate proteins filtered based on molecular weight and functional annotation. DI Molecular docking simulations (visualized with PyMOL) displaying binding modes and binding energies between XTS and target proteins: ALDH1A, GAA, PHGDH, EPHB3, XPNPEP1, and UMPS. J CETSA analysis demonstrates that XTS reduces degradation of GAA, PHGDH, EPHB3, ALDH1A, XPNPEP1, and UMPS compared with DMSO controls
Fig. 7
Fig. 7
Metabolomics reveals that XTS mitigates post-I/R lipid peroxidation by upregulating l-arginine and GSH. A PCA reveals distinct metabolic profiles between XTS-treated and DMSO control groups. B Hierarchical clustering heatmap demonstrates divergent metabolite expression patterns between I/R-XTS and I/R-DMSO cohorts. C Volcano plot identifies 74 significantly altered metabolites (|FC|> 1.5, P-value < 0.05), including 46 upregulated (red) and 26 downregulated (blue) species. D KEGG pathway enrichment analysis highlights XTS-induced metabolic perturbations, particularly in purine metabolism (e.g., upregulated uric acid) and l-arginine biosynthesis. E Fold changes of metabolites in the purine metabolism pathway (red = upregulation, blue = downregulation). F Fold changes of metabolites in other key pathways showing coordinated regulation (red = upregulation, blue = downregulation)
Fig. 8
Fig. 8
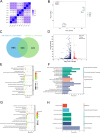
RNA sequencing reveals XTS-mediated suppression of ferroptosis in cardiomyocytes under H/R injury. A Correlation heatmap showing intra- and intergroup relationships among Control (CON), H/R + DMSO (H/R), and H/R + XTS (XTS) groups. B PCA depicting distinct clustering of the three experimental groups. C Venn diagram illustrating overlapping DEGs between H/R versus Control and XTS versus H/R comparisons (|FC| > 1.5, Q-value < 0.05). D Volcano plot of DEGs between XTS and H/R groups (red: upregulated, blue: downregulated). E, F Bubble plots showing GO and KEGG pathway enrichment for downregulated DEGs in XTS versus H/R. GH Bar plots displaying GO and KEGG pathway enrichment for upregulated DEGs in XTS versus H/R

References

    1. Tsao CW, Aday AW, Almarzooq ZI, Alonso A, Beaton AZ, Bittencourt MS, et al. Heart disease and stroke statistics-2022 update: a report from the American Heart Association. Circulation. 2022;145(8):e153–639. - PubMed
    1. Hausenloy DJ, Yellon DM. Myocardial ischemia-reperfusion injury: a neglected therapeutic target. J Clin Invest. 2013;123(1):92–100. - PMC - PubMed
    1. Zuo W, Sun R, Ji Z, Ma G. Macrophage-driven cardiac inflammation and healing: insights from homeostasis and myocardial infarction. Cell Mol Biol Lett. 2023;28(1):81. - PMC - PubMed
    1. Lopaschuk GD, Collins-Nakai RL, Itoi T. Developmental changes in energy substrate use by the heart. Cardiovasc Res. 1992;26(12):1172–80. - PubMed
    1. Puente BN, Kimura W, Muralidhar SA, Moon J, Amatruda JF, Phelps KL, et al. The oxygen-rich postnatal environment induces cardiomyocyte cell-cycle arrest through DNA damage response. Cell. 2014;157(3):565–79. - PMC - PubMed

MeSH terms

Substances

LinkOut - more resources