. 2025 Jul 28;25(1):966.
doi: 10.1186/s12870-025-07014-7.

Genetic diversity and genome-wide associations for frost survival in sorghum

Affiliations

Genetic diversity and genome-wide associations for frost survival in sorghum

Natalja Kravcov et al. BMC Plant Biol. .

Abstract

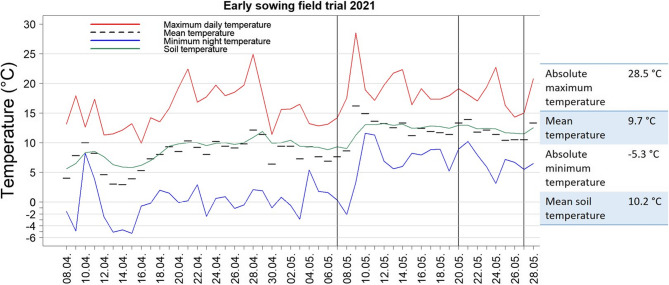
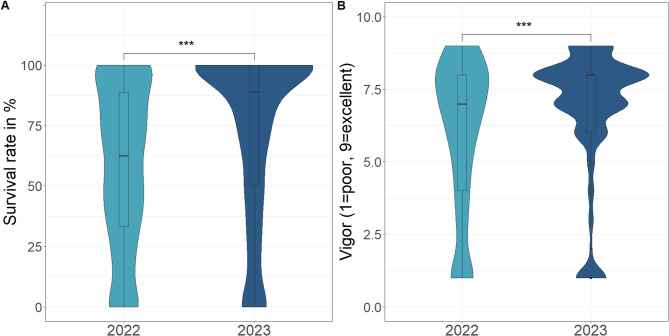
Background: The ability to withstand periods of light frost during juvenile development is an important adaptive trait for sorghum (Sorghum bicolor L. Moench) production in high-latitude temperate areas. Frost tolerance would allow for earlier sowing and prolongation of growing season and maturity, thereby increasing yield potential. Using a broad diversity set (n = 285), a field cold emergence trial and two semi-controlled frost survival experiments were conducted to investigate the phenotypic diversity and genetic architecture of frost survival traits.

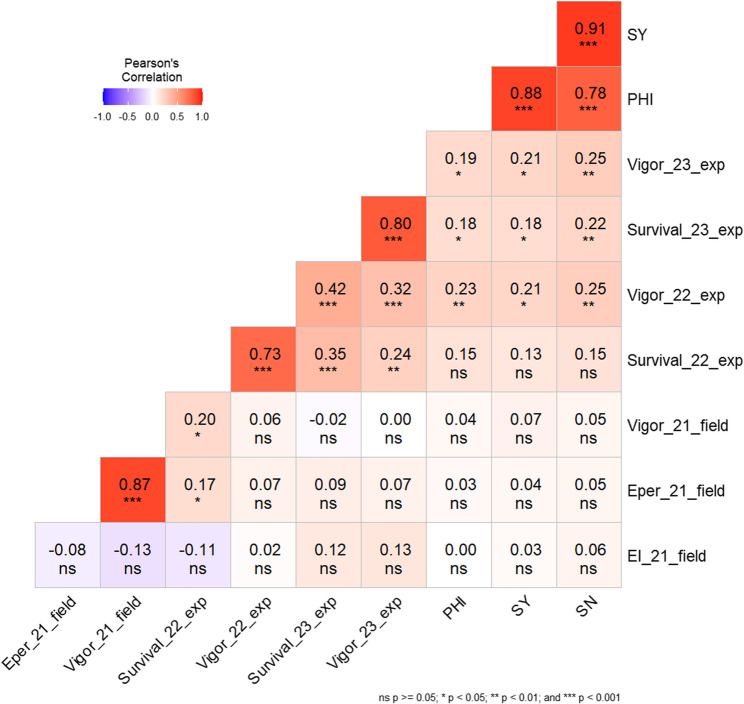
Results: The results show high phenotypic diversity for frost survival, including superior genotypes combining high frost tolerance and cold emergence levels via quantitative trait inheritance. Tolerance to temperatures above and below 0 °C was not correlated, suggesting separate genetic control. The found QTL do not overlap for the traits of frost survival and plant emergence under cold sowing conditions. Genome-wide association studies revealed four significant associations for frost survival, where the QTLs are located on chromosomes Sb02, Sb07, and Sb08. For the trait of emergence under cold sowing conditions, a total of 12 QTLs were found on chromosomes Sb01, Sb03, Sb04, Sb05, and Sb06.

Conclusion: A good overview regarding the suitability of the tested genotypes for early sowing was obtained due to the large diversity investigated in this study, with surprisingly high survival rates of numerous genotypes after frost stress. These results will contribute to the breeding of cultivars with improved cold and frost tolerance, facilitating better adaptation for production in high-latitude temperate areas, as well as earlier sowing to avoid summer drought.

Keywords: S. bicolor; Abiotic stress; Climate adaptation; Freezing; GWAS; Genetic diversity; Juvenile Frost tolerance.


Conflict of interest statement

Declarations. Ethics approval and consent to participate: Not applicable. Consent for publication: Not applicable. Competing interests: The authors declare no competing interests.

Figures

Fig. 1
Fig. 1
Maximum, minimum and soil temperature course during the early-sown field trial in Gross Gerau, Germany from April 8 (sowing date) to May 28, 2021. The vertical black lines indicate the dates on which plant emergence was counted. The temperature with absolute maximum (highest) and minimum (lowest) is shown in the box next to the figure
Fig. 2
Fig. 2
Temperature curve in °C according to date and time for the semi-controlled frost experiment in 2022 (left) and 2023 (right). The blue line indicates 15 °C threshold, being considered the threshold for cold stress in sorghum, and red line indicates 0 °C. Below the graphs, the absolute minimum and maximum temperature is shown. The temperature with absolute maximum (highest, Tmax), mean temperature (Tmean) and minimum (lowest, Tmin) is shown in the box next to the graph
Fig. 3
Fig. 3
Violinplots for (A) percentage survival rate and (B) vigor for the two frost experiments, separately for the years 2022 and 2023. The significance level are shown by ANOVA mean squares p ≤ 0.001***, p ≤ 0.01** and p ≤ 0.05*
Fig. 4
Fig. 4
Pearson’s correlation for all scored traits Emergence Index (EI), emergence percent (Eper), vigor and survival (in %) from the field trial (2021) and semi-controlled frost experiments (2022 and 2023). The number following the trait abbreviation refers to the year. The reproductive cold tolerance traits panicle harvest index (PHI), seed yield (SY) and seed number (SN) were added from a previous study in other environments [37]
Fig. 5
Fig. 5
Classification of population structure with (A) estimation of cluster number with the best number of K = 3 as highest peak and (B) Barplot with three subpopulations shown as different colors
Fig. 6
Fig. 6
Scatterplot showing the best genotypes (A): emergence in percentage (above 35%) and survival rate (> 90%); (B) PHI (> 0.6) and survival rate (> 90%) after frost
Fig. 7
Fig. 7
Phylogram for the sorghum diversity set (n = 285), showing classification of subpopulations according to the calculated clusters (blue, pink and black colored branches). Blue dots indicate superior genotypes with survival rate > 90% after frost and emergence > 35% under early-sown field conditions. The green dot shows one genotype found to have survival rate > 90% and PHI > 0.6 during reproductive cold stress. Red dot shows genotype SBTR132412, which had a high performance for all three traits
Fig. 8
Fig. 8
Manhattan plot of a genome-wide association study for the trait emergence in percent at early sowing. The chromosomes are shown on the x-axis and the negative decadic logarithm of the p-values on the y-axis. The higher the dots, the stronger is their association with the trait; the blue line shows the threshold of -log10 (p) ≥ 3. Individual dots represent genetic markers. The markers highlighted in red are significantly associated with the trait Emergence Index
Fig. 9
Fig. 9
Manhattan plot of a genome-wide association study for the trait survival rate after short frost periods. The chromosomes are shown on the x-axis and the negative decadic logarithm of the p-values on the y-axis. The higher the dots are, the more they are associated with the trait; the blue line shows the threshold of -log10 (p) ≥ 3. Individual points represent genetic markers. The regions associated with the trait are located on chromosomes Sb02, Sb07 and Sb08

References

    1. Awika JM. Major cereal grains production and use around the world: advances in cereal science: implications to food processing and health promotion. American Chemical Society; 2011.
    1. Poutanen KS, Kårlund AO, Gómez-Gallego C, Johansson DP, Scheers NM, Marklinder IM, et al. Grains - a major source of sustainable protein for health. Nutr Rev. 2022;80(6):1648–63. - PMC - PubMed
    1. Kumar AA, Reddy BVS, Sharma HC, Hash CT, Rao PS, Ramaiah B, et al. Recent advances in Sorghum genetic enhancement research at ICRISAT. AJPS. 2011;02(04):589–600.
    1. Vadez V, Krishnamurthy L, Hash CT, Upadhyaya HD, Borrell AK. Yield, transpiration efficiency, and water-use variations and their interrelationships in the sorghum reference collection. Crop Pasture Sci. 2011;62(8):645.
    1. Yu J, Tuinstra MR. Genetic analysis of seedling growth under cold temperature stress in grain Sorghum. Crop Sci. 2001;41(5):1438–43.

LinkOut - more resources