. 2025 Jul 28;23(1):845.
doi: 10.1186/s12967-025-06849-w.

Chronic intermittent hypoxia impairs BM-MSC osteogenesis and long bone growth through regulating histone lactylation

Affiliations

Chronic intermittent hypoxia impairs BM-MSC osteogenesis and long bone growth through regulating histone lactylation

Fang Chen et al. J Transl Med. .

Abstract

Background: Chronic intermittent hypoxia (CIH) caused by OSA often results in serious complications. However, the adverse effects of CIH on bone growth and development are often overlooked.

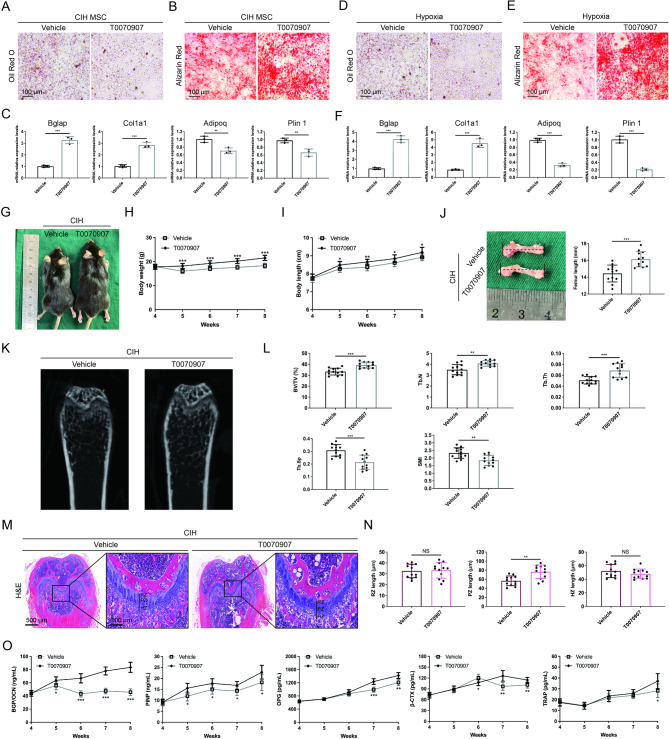
Methods: CIH intervention was conducted using an OxyCycler model A84 system for 8 h per day (from 8:00 a.m. to 4:00 p.m.) over a period of 4 weeks. Body and femur lengths were measured, and micro-CT, histological analysis, and ELISA were performed to evaluate femoral development. Metabolomic, single-cell transcriptomic, Western blot, and ChIP‒qPCR analyses were conducted to explore the potential mechanisms underlying CIH-induced inhibition of long bone growth. T0070907 was administered intraperitoneally (0.5 mg/kg) every two days to investigate its effect on long bone growth under CIH conditions.

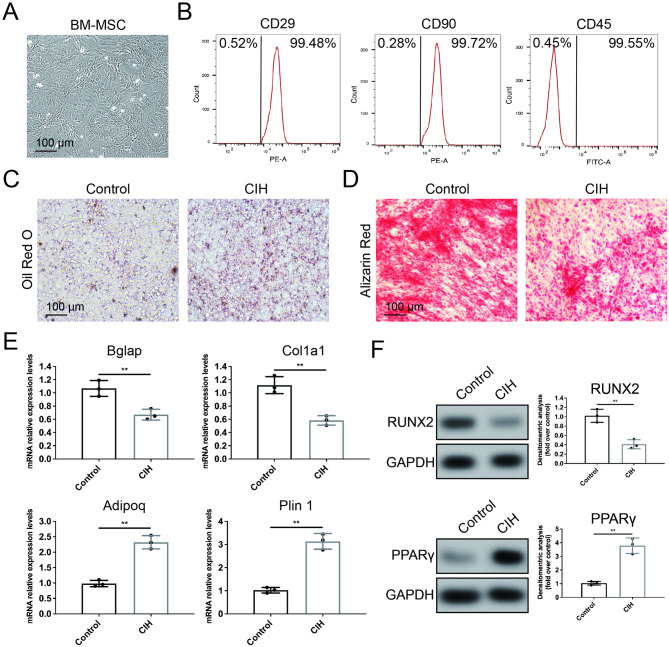
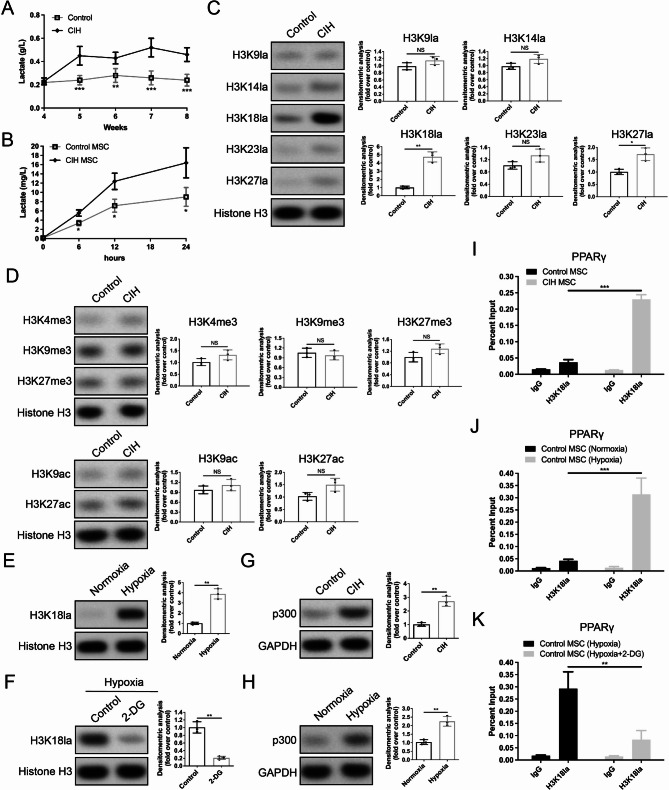
Results: Here, we showed that CIH stimulation during long bone development significantly inhibited long bone growth. Multiomics analysis revealed that CIH induces anaerobic glycolysis in bone marrow mesenchymal stem cells (BM-MSCs), promotes adipogenic differentiation, and reduces their osteogenic differentiation capacity. Mechanistic studies demonstrated that CIH-induced lactate accumulation enhances lactylation at histone H3 lysine 18 (H3K18) on the PPARγ promoter in BM-MSCs, leading to the transcriptional activation of PPARγ and a consequent imbalance between the adipogenic and osteogenic differentiation of BM-MSCs. The PPARγ inhibitor T0070907 could partially rescue long bone developmental disorders induced by CIH.

Conclusions: Our findings reveal an epigenetic mechanism underlying CIH-induced long bone dysplasia and highlight T0070907 as a promising targeted therapeutic agent.

Keywords: BM-MSCs; Bone development; Chronic intermittent hypoxia; Histone lactylation; PPARγ.


Conflict of interest statement

Declarations. Ethics approval and consent to participate: The study was approved by the Ethics Committee of Shanghai Sixth People’s Hospital (No. 2024 − 0632). Consent for publication: Not applicable. Competing interests: The authors confirm that there are no conflicts of interest.

Figures

Fig. 1
Fig. 1
CIH impairs long bone growth in mice. (A) Macroscopic images of mice after 4 weeks of CIH or control treatment. (B, C) The quantification of body weight and body length at all examined time points. (D) Macroscopic images of the mouse femur and quantification of femur length. (E) Micro-CT images of the mouse femur after 4 weeks of CIH or control treatment. (F) The quantification of bone volume per tissue volume (BV/TV%), trabecular number (Tb.N), trabecular thickness (Tb.Th), trabecular separation (Tb.Sp) and structure model index (SMI). (G) H&E-stained images of the distal femur after four weeks of CIH or control treatment. (scale bar = 500 μm). Zoomed-in images show the growth plate cartilage region. (zoom scale bar = 100 μm). (H) The quantification of the lengths of the resting zone (RZ), proliferative zone (PZ), and hypertrophic zone (HZ). Data are presented as mean ± SD (n = 12 biologically independent animals). *P < 0.05; **P < 0.01; ***P < 0.001
Fig. 2
Fig. 2
CIH downregulates the expression of bone turnover markers. (A, B) ALP- and TRAP-stained images of the distal femur after four weeks of CIH or control treatment, along with expression quantification. (scale bar = 500 μm). (C, D) Images and quantitative analysis of immunohistochemical staining of collagen COL I and OCN in the CIH and the control group. (scale bar = 500 μm, zoom scale bar = 100 μm). (E) Images and quantitative analysis of immunofluorescence staining for OSX in the CIH and the control group. OSX is labeled in red. (Scale bar = 100 μm). (F) Serum bone turnover marker levels at all examined time points. Data are presented as mean ± SD (n = 12 biologically independent animals). *P < 0.05; **P < 0.01; ***P < 0.001
Fig. 3
Fig. 3
CIH enhances glycolysis and adipogenic differentiation in BM-MSCs. (A) Schematic diagram of single-cell transcriptome sequencing of femoral tissue. (B) The proportions of each BM-MSC subpopulation between the CIH group and the control group. (C) KEGG assay results of significantly upregulated pathways of differentially expressed genes in BM-MSCs between the CIH group and the control group. (D) The number of metabolites with significant differences between the CIH group and the control group. (E, F) Volcano map and Heatmap of differential metabolites between the control group and the CIH group. (G) KEGG assay results showing the top 10 upregulated and downregulated pathways of differentially expressed genes in femoral tissues between the CIH group and the control group. (H) Reactome assay results of significantly downregulated pathways of differentially expressed genes in femoral tissues between the CIH group and the control group
Fig. 4
Fig. 4
CIH inhibits the osteogenic differentiation of BM-MSCs. (A) Images of phase-contrast microscopy of BM-MSCs. (B) Identification of surface antigen-specific markers of BM-MSCs. (C, D) Oil Red O and Alizarin Red staining images of BM-MSCs isolated from mice in the CIH or control group. (scale bar = 100 μm). (E) Relative RNA expression levels of osteogenic and adipogenic marker genes in BM-MSCs isolated from mice in the CIH or control group. (F) The protein levels of RUNX2 and PPARγ in BM-MSCs isolated from mice in the CIH or control group. Data are presented as mean ± SEM (n = 3 independent experiments). **P < 0.01
Fig. 5
Fig. 5
CIH increases the H3K18la level in the promoter region of the PPARγ gene in BM-MSCs. (A, B) Lactate levels in femoral tissue and the supernatant of BM-MSCs in the control and CIH groups. (C) The levels of H3K9la, H3K14la, H3K18la, H3K23la, and H3K27la in BM-MSCs isolated from mice in the CIH or control group. (D) The levels of H3K4me3, H3K9me3, H3K27me3, H3K9ac and H3K27ac in BM-MSCs isolated from mice in the CIH or control group. (E) The H3K18la levels in BM-MSCs isolated from control mice following normoxia or hypoxia treatment. (F) The H3K18la levels in BM-MSCs under hypoxic conditions with or without 2-DG treatment. (G) The protein levels of p300 in BM-MSCs isolated from mice in the CIH or control group. (H) The protein levels of p300 in BM-MSCs isolated from control mice following normoxia or hypoxia treatment. (I) ChIP assay confirming the increased H3K18la level in the PPARγ promoter region of BM-MSCs isolated from CIH mice. (J) ChIP assay confirming the increased H3K18la level in the PPARγ promoter region of BM-MSCs under hypoxic conditions. (K) ChIP assay confirming that 2-DG blocks the hypoxia-induced upregulation of H3K18la levels in the PPARγ promoter region. Data in (A) are presented as mean ± SD (n = 12 biologically independent animals). Data in (B)–(K) are presented as means with SEs (n = 3 independent experiments). *P < 0.05; **P < 0.01; ***P < 0.001
Fig. 6
Fig. 6
Application of the PPARγ inhibitor T0070907 alleviates CIH-induced long bone growth impairment. (A, B) Oil Red O and Alizarin Red staining images of BM-MSCs isolated from CIH-treated mice with or without T0070907 treatment. (scale bar = 100 μm). (C) Relative RNA expression levels of osteogenic and adipogenic marker genes in BM-MSCs isolated from CIH-treated mice with or without T0070907 treatment. (D, E) Oil Red O and Alizarin Red staining images of BM-MSCs under hypoxic conditions with or without T0070907 treatment. (scale bar = 100 μm). (F) Relative RNA expression levels of osteogenic and adipogenic marker genes in BM-MSCs under hypoxic conditions with or without T0070907 treatment. (G) Macroscopic images of CIH-treated mice with or without T0070907 treatment. (H, I) The quantification of body weight and body length at all examined time points. (J) Macroscopic images of the mouse femur and quantification of femur length. (K) Micro-CT images of the femur from CIH-treated mice with or without T0070907 treatment. (L) The quantification of BV/TV%, Tb.N, Tb.Th, Tb.Sp and SMI. (M) H&E-stained images of the distal femur from CIH-treated mice with or without T0070907 treatment. (scale bar = 500 μm). Zoomed-in images show the growth plate cartilage region. (zoom scale bar = 100 μm). (N) The quantification of the lengths of RZ, PZ, and HZ. (O) Serum bone turnover marker levels at all examined time points. Data in (C) and (F) are presented as means with SEs (n = 3 independent experiments). Data in (G)–(O) are presented as mean ± SD (n = 12 biologically independent animals). *P < 0.05; **P < 0.01; ***P < 0.001

Similar articles

References

    1. Benjafield AV, Ayas NT, Eastwood PR, Heinzer R, Ip MSM, Morrell MJ, et al. Estimation of the global prevalence and burden of obstructive sleep apnoea: a literature-based analysis. Lancet Respir Med. 2019;7(8):687–98. 10.1016/S2213-2600(19)30198-5 - PMC - PubMed
    1. Bitners AC, Arens R. Evaluation and management of children with obstructive sleep apnea syndrome. Lung. 2020;198(2):257–70. 10.1007/s00408-020-00342-5 - PMC - PubMed
    1. Zhang K, Ma D, Wu Y, Xu Z. Impact of chronic intermittent hypoxia on cognitive function and hippocampal neurons in mice: A study of inflammatory and oxidative stress pathways. Nat Sci Sleep. 2024;16:2029–43. 10.2147/NSS.S489232 - PMC - PubMed
    1. Wang F, Zou J, Xu H, Huang W, Zhang X, Wei Z, et al. Effects of chronic intermittent hypoxia and chronic sleep fragmentation on gut microbiome, serum metabolome, liver and adipose tissue morphology. Front Endocrinol (Lausanne). 2022;13:820939. 10.3389/fendo.2022.820939 - PMC - PubMed
    1. Vanek J, Prasko J, Genzor S, Ociskova M, Kantor K, Holubova M, et al. Obstructive sleep apnea, depression and cognitive impairment. Sleep Med. 2020;72:50–8. 10.1016/j.sleep.2020.03.017 - PubMed

LinkOut - more resources