. 2025 Jun 23;26(7):694-707.
doi: 10.1631/jzus.B2400048.

Competitive roles of slow/delta oscillation-nesting-mediated sleep disruption under acute methamphetamine exposure in monkeys

[Article in English, Chinese]
Affiliations

Competitive roles of slow/delta oscillation-nesting-mediated sleep disruption under acute methamphetamine exposure in monkeys

[Article in English, Chinese]
Xin Lv et al. J Zhejiang Univ Sci B. .

Abstract

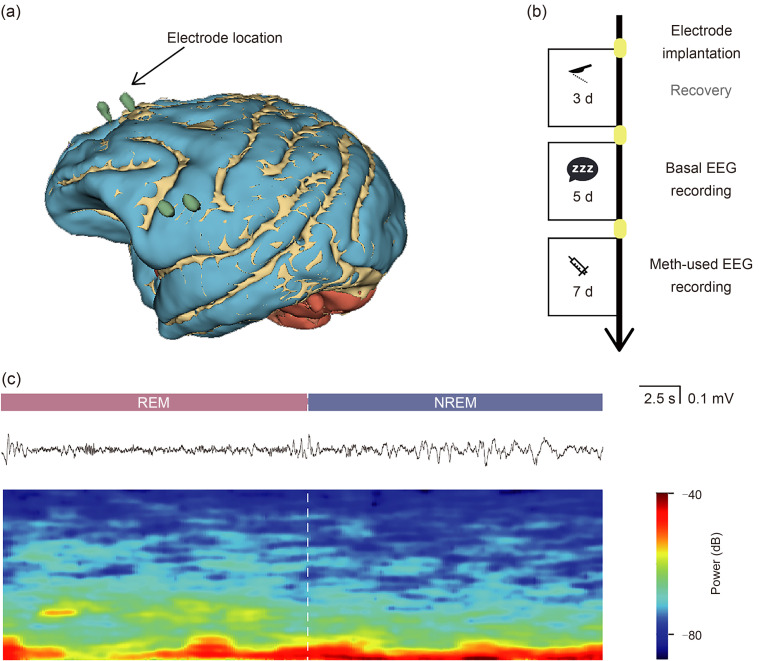
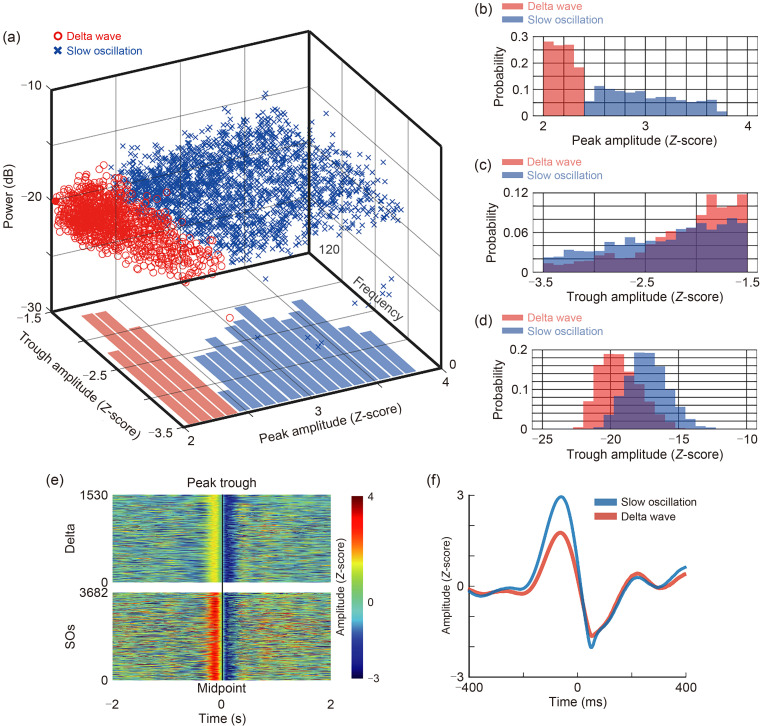
Abuse of amphetamine-based stimulants is a primary public health concern. Recent studies have underscored a troubling escalation in the inappropriate use of prescription amphetamine-based stimulants. However, the neurophysiological mechanisms underlying the impact of acute methamphetamine exposure (AME) on sleep homeostasis remain to be explored. This study employed non-human primates and electroencephalogram (EEG) sleep staging to evaluate the influence of AME on neural oscillations. The primary focus was on alterations in spindles, delta oscillations, and slow oscillations (SOs) and their interactions as conduits through which AME influences sleep stability. AME predominantly diminishes sleep-spindle waves in the non-rapid eye movement 2 (NREM2) stage, and impacts SOs and delta waves differentially. Furthermore, the competitive relationships between SO/delta waves nesting with sleep spindles were selectively strengthened by methamphetamine. Complexity analysis also revealed that the SO-nested spindles had lost their ability to maintain sleep depth and stability. In summary, this finding could be one of the intrinsic electrophysiological mechanisms by which AME disrupted sleep homeostasis.

苯丙胺类兴奋剂的滥用是全球重要的公共健康风险之一。近期研究指出,处方安非他命类药物的滥用呈现显著上升趋势。然而,急性甲基苯丙胺暴露(AME)影响睡眠稳态的神经生理机制仍有待探索。本研究采用非人灵长类动物(恒河猴)为模型,利用脑电图(EEG)睡眠分期的方法评估AME对神经振荡的调控作用,并重点研究AME对睡眠纺锤波、delta波和慢波(SO)的差异性影响,及其在睡眠稳定性调控中的相互作用机制。AME显著抑制非快速眼动2期(NREM2)的睡眠纺锤波,并对SO和delta波具有差异性调控作用。此外,甲基苯丙胺特异性增强了SO和delta波与睡眠纺锤波的嵌套关系;复杂度特征分析发现,SO嵌套的纺锤波维持睡眠深度和稳定性的生理功能也出现显著损伤。上述结果在神经振荡网络层面上阐述了AME导致睡眠稳态破坏的内在电生理机制。.

苯丙胺类兴奋剂的滥用是全球重要的公共健康风险之一。近期研究指出,处方安非他命类药物的滥用呈现显著上升趋势。然而,急性甲基苯丙胺暴露(AME)影响睡眠稳态的神经生理机制仍有待探索。本研究采用非人灵长类动物(恒河猴)为模型,利用脑电图(EEG)睡眠分期的方法评估AME对神经振荡的调控作用,并重点研究AME对睡眠纺锤波、delta波和慢波(SO)的差异性影响,及其在睡眠稳定性调控中的相互作用机制。AME显著抑制非快速眼动2期(NREM2)的睡眠纺锤波,并对SO和delta波具有差异性调控作用。此外,甲基苯丙胺特异性增强了SO和delta波与睡眠纺锤波的嵌套关系;复杂度特征分析发现,SO嵌套的纺锤波维持睡眠深度和稳定性的生理功能也出现显著损伤。上述结果在神经振荡网络层面上阐述了AME导致睡眠稳态破坏的内在电生理机制。

Keywords: Addiction; Amphetamine; Delta oscillation; Electroencephalogram (EEG); Sleep stage; Slow oscillation (SO).


Figures

Fig. 1
Fig. 1. Experimental design and procedure of acute methamphetamine exposure. (a) Schematic of surgical electrode implantation and electrode-position reconstruction, showing the precise arrangement of electrodes in specific locations. (b) Experimental procedure schematic illustrating the entire experimental process. (c) Sleep stage diagram depicting sleep stages of rapid eye movement (REM) and non-rapid eye movement (NREM) with raw wave representation and its heatmap features. EEG: electroencephalogram; Meth: methamphetamine.
Fig. 2
Fig. 2. Functional sleep impairment induced by acute methamphetamine exposure (AME). (a) The total time of each sleep stage (rapid eye movement (REM), non-rapid eye movement 1 (NREM1), NREM2, and NREM3) after AME. AME significantly prolongs the total duration of REM sleep and shortens the total time of NREM2 and NREM3 sleep (n=14 in basal versus n=20 in meth, Mann-Whitney test of non-parameters test: for REM, P=0.0002; for NREM1, P=0.7178; for NREM2, P=0.0001; for NREM3, P<0.0001). (b) Chord diagram illustrating the probability of transitions between sleep stages. The left panel represents the baseline state, while the right panel depicts the state after AME. AME does not significantly impair the progression from REM to NREM sleep. (c) Average duration of segments of each sleep stage (REM, NREM1, NREM2, and NREM3). In addition to the significantly prolonged duration of individual REM sleep stages, impairment of NREM sleep stability mainly occurs during the NREM2 stage (for awake stage, n=51 in basal versus n=34 in meth, Mann-Whitney test of non-parameters test, P=0.0720; for REM, n=202 in basal versus n=381 in meth, Mann-Whitney test of non-parameters test, P<0.0001; for NREM1, n=238 in basal versus n=310 in meth, Mann-Whitney test of non-parameters test, P=0.4821; for NREM2, n=72 in basal versus n=22 in meth, Mann-Whitney test of non-parameters test, P=0.0012; for NREM3, n=156 in basal versus n=98 in meth, Mann-Whitney test of non-parameters test, P=0.2720). Data are expressed as mean±standard deviation (SD). n.s.: not significant. ** P<0.01, *** P<0.001, **** P<0.0001.Meth: methamphetamine.
Fig. 3
Fig. 3. Attenuation of sleep-spindle waves in non-rapid eye movement 2 (NREM2) stage by acute methamphetamine exposure (AME). (a) Schematic representation of spindle waves identified in the raw waveform after 412 Hz filtering during NREM sleep. (b) Spindle-wave incidence (count per second) during basal sleep period and AME sleep period (n=14 in basal versus n=20 in meth, Mann-Whitney test of non-parameters test, P<0.0001). (c) Average power of spindle waves during basal sleep period and AME sleep period (n=30 145 in basal versus n=28 904 in meth, Mann-Whitney test of non-parameters test, P<0.0001). (d) Average spindle waveform during basal sleep period and AME sleep period. AME induced a flatter waveform with lower amplitude and shorter duration, which leads to functional loss in sleep stability. Red curve indicated the basal; yellow curve indicated the meth. (e) Spindle-wave incidence in the NREM2 stage (count per second) during basal sleep period and AME sleep period (n=14 in basal versus n=20 in meth, Mann-Whitney test of non-parameters test, P<0.0001). (f) Spindle-wave incidence in the NREM3 stage (count per second) during basal sleep period and AME sleep period (n=14 in basal versus n=20 in meth, Mann-Whitney test of non-parameters test, P=0.3451). Data are expressed as mean±standard deviation (SD). n.s.: not significant. **** P<0.0001. Meth: methamphetamine.
Fig. 4
Fig. 4. Dissociation of delta waves and slow oscillations (SOs). (a) Delta waves and SOs from single monkeys in the basal sleep period stage (n=5). The scatter plot is based on Z-scored peaks of up states, Z-scored troughs of up states, and average power. (b) Distribution of Z-scored peaks of up states. The peak distribution of the delta wave is completely separated from the SO. (c) Distribution of Z-scored troughs in the up states of delta waves and SOs. (d) Distribution of average power of delta waves and SOs. SOs exhibit slightly higher power than delta waves. (e) Heatmap matrix which vertically stacks all original waveform heatmaps of delta wave and SOs. On the left side of the midpoint is the peak amplitude, and on the right side are the trough amplitudes. (f) Average waveform of SOs (n=1530 from five trials) and delta waves (n=3682 from five trials).
Fig. 5
Fig. 5. Acute methamphetamine exposure (AME) differentially altering delta waves and slow oscillations (SOs). (a) Comparison of the delta incidence during non-rapid eye movement (NREM) in basal and AME periods (n=14 in basal versus n=20 in meth, unpaired t-test, P=0.0002). (b) Comparison of the average power of delta waves during NREM in basal and AME periods (n=93 204 delta in basal versus n=134 091 delta in meth, Mann-Whitney test of non-parameters test, P<0.0001). (c) Comparison of the incidence of SOs during NREM in baseline and AME periods (n=14 in basal versus n=20 in meth, unpaired t-test, P=0.1496). (d) Comparison of the average power of SOs during NREM in basal and AME periods (n=39 300 SOs in basal versus n=50 043 SOs in meth, Mann-Whitney test of non-parameters test, P<0.0001). (e) Comparison of the incidence of SOs during NREM2 sleep (n=14 in basal versus n=20 in meth, unpaired t-test, P=0.9343). (f) Comparison of the incidence of delta waves during NREM2 sleep (n=14 in basal versus n=20 in meth, unpaired t-test, P=0.0015). (g) Comparison of the incidence of SOs during NREM3 sleep (n=14 in basal versus n=20 in meth, Mann-Whitney test of non-parameters test, P=0.0033). (h) Comparison of the incidence of delta waves during NREM3 sleep (n=14 in basal versus n=20 in meth, Mann-Whitney test of non-parameters test, P=0.0004). Data are expressed as mean±standard deviation (SD). n.s.: not significant. ** P<0.01, *** P<0.001, **** P<0.0001. Meth: methamphetamine.
Fig. 6
Fig. 6. Strengthened competitive spindle nesting of slow oscillations (SOs) over delta waves by acute methamphetamine exposure (AME). (a) Schematic diagram illustrating the independent nesting of SOs and delta waves with spindles. The waveforms represent the SO, spindle wave, and delta wave from the filtered signal. The dashed line indicates the starting point of the down state, which is also the beginning time-point of nesting. (b) Delta-spindle nesting incidence (per minute) changes from basal to AME periods (n=14 in basal versus n=20 in meth, unpaired t-test, P=0.0051). (c) SO-spindle nesting incidence (per minute) changes from basal to AME periods (n=14 in basal versus n=20 in meth, unpaired t-test, P=0.0238). (d) Peri-delta-nesting distribution of spindle wave in basal (red line) and AME periods (yellow line). Lines and dots represent the means, and shading represents the standard error of the mean (SEM). (e) Peri-SO-nesting distribution of spindle waves in basal (red line) and AME periods (yellow line). Lines and dots represent the means, and shading represents SEM. (f) Delta-nesting index changes from basal to AME periods (n=14 in basal versus n=20 in meth, unpaired t-test, P=0.8559). (g) SO-nesting index changes from basal to AME periods (n=14 in basal versus n=20 in meth, unpaired t-test, P<0.0001). (h) Delta/SO competing index changes from basal to AME periods, calculated based on the ratio of spindles involved in delta nesting to the ratio of spindles involved in SO nesting, reflecting the competitive recruitment effects of the two types of nesting (n=14 in basal versus n=20 in meth, unpaired t-test, P<0.0001). Data are expressed as mean±standard deviation (SD). n.s.: not significant. * P<0.05, ** P<0.01, **** P<0.0001. Meth: methamphetamine.
Fig. 7
Fig. 7. Acute methamphetamine exposure (AME) impairing slow oscillations (SOs)-nested spindles in sleep stability maintenance. (a) Schematic diagram of sample entropy calculation. Spindle waves were divided into three groups: nested with delta waves, nested with SOs, and non-nested spindles. To mitigate the silencing effects of SO/delta-mediated down states, sample entropy was computed within a time window (Δt) consisting of the first 20 s following the peak of the first spindle wave after the end of the down state. For each time window, sample entropy was computed using a sliding window approach with a width of 1 s and a step size of 1 s. (b) Average peri-event entropy for delta-nested spindles, SO-nested spindles, and non-nested spindles in baseline (top) and AME (bottom) periods. The entropy around delta-nested spindles and SO-nested spindles exhibits completely opposite activity, while non-nested spindles occupy an intermediate position. AME also induces a flatter entropy profile around SO-nested spindles. Solid lines represent the means, and the dashed line represents the standard error of the mean (SEM). The gray semi-transparent line indicates the average value of entropy. The statistical results are based on the average sample entropy around the gray box for events. The significance markers indicate the statistical results between the average peri-spindle sample entropy (for peri-delta-nested spindle entropy, n=3494 in basal versus n=3414 in meth, unpaired t-test, **** P<0.0001; for peri-SO-nested spindle entropy, n=13 996 in basal versus n=8861 in meth, unpaired t-test, **** P<0.0001).

Similar articles

References

    1. Andersen ML, Diaz MP, Murnane KS, et al. , 2013. Effects of methamphetamine self-administration on actigraphy-based sleep parameters in rhesus monkeys. Psychopharmacology (Berl), 227(1): 101-107. 10.1007/s00213-012-2943-2 - DOI - PMC - PubMed
    1. Baingana F, al'Absi M, Becker AE, et al. , 2015. Global research challenges and opportunities for mental health and substance-use disorders. Nature, 527(7578): S172-S177. 10.1038/nature16032 - DOI - PMC - PubMed
    1. Bandarabadi M, Herrera CG, Gent TC, et al. , 2020. A role for spindles in the onset of rapid eye movement sleep. Nat Commun, 11: 5247. 10.1038/s41467-020-19076-2 - DOI - PMC - PubMed
    1. Bassetti CLA, Adamantidis A, Burdakov D, et al. , 2019. Narcolepsy—clinical spectrum, aetiopathophysiology, diagnosis and treatment. Nat Rev Neurol, 15(9): 519-539. 10.1038/s41582-019-0226-9 - DOI - PubMed
    1. Berro LF, Andersen ML, Tufik S, et al. , 2016. Actigraphy-based sleep parameters during the reinstatement of methamphetamine self-administration in rhesus monkeys. Exp Clin Psychopharmacol, 24(2): 142-146. 10.1037/pha0000064 - DOI - PMC - PubMed

Substances