

The Casual Associations Between Brain Functional Networks and Fibromyalgia: A Large-Scale Genetic Correlation and Mendelian Randomization Study
- PMID: 40722384
- PMCID: PMC12292968
- DOI: 10.3390/bioengineering12070692
The Casual Associations Between Brain Functional Networks and Fibromyalgia: A Large-Scale Genetic Correlation and Mendelian Randomization Study
Abstract
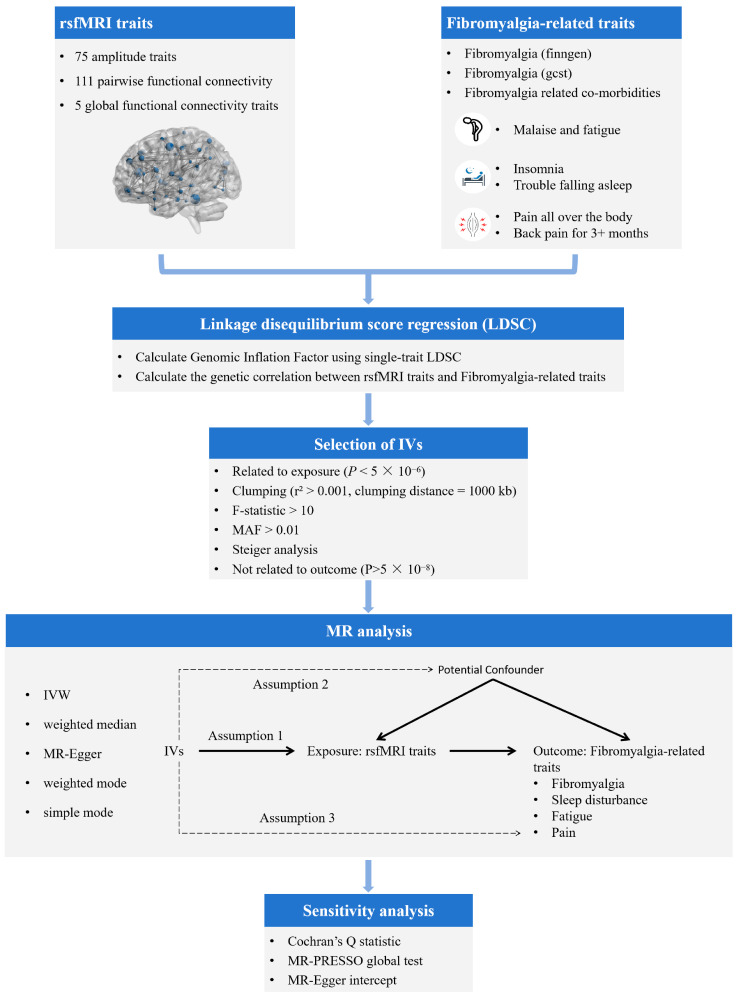
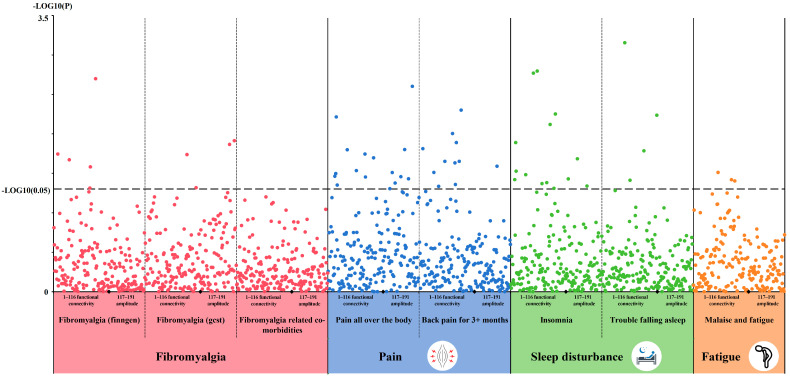
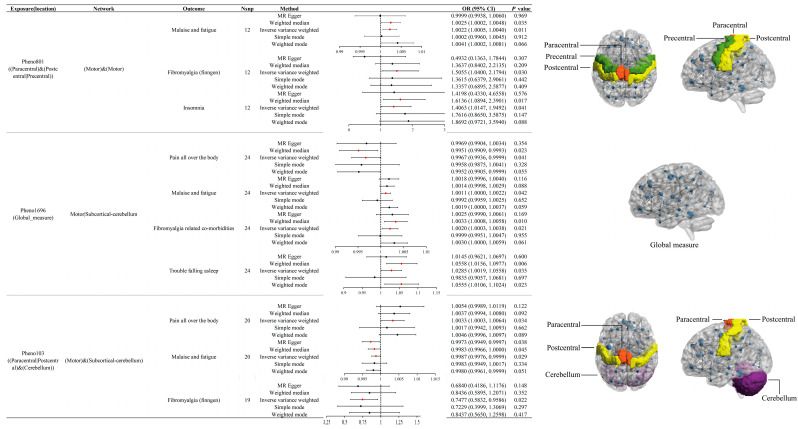
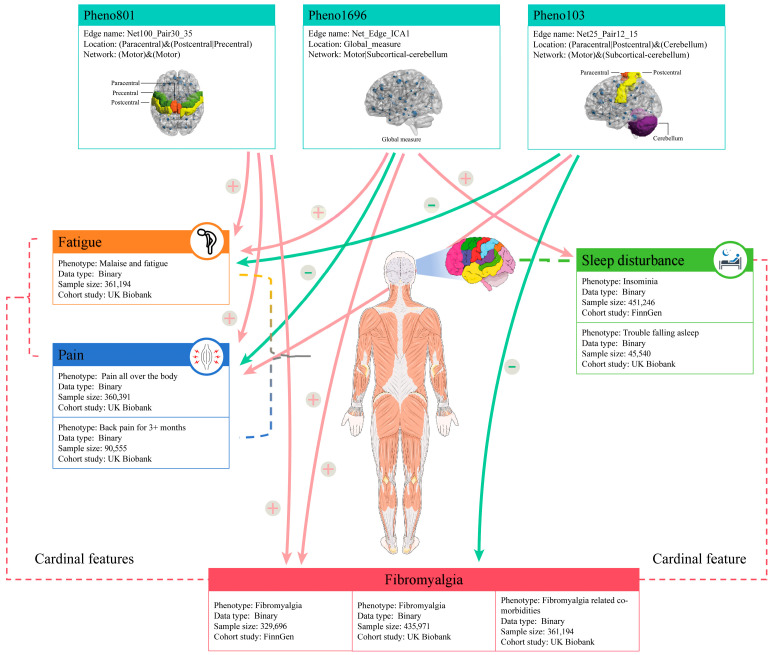
While the central mechanisms of fibromyalgia have gained attention, the causal effects between brain networks and fibromyalgia remain unclear. Two-sample Mendelian randomization and Linkage Disequilibrium Score Regression were performed to investigate the relationship between 191 rsfMRI traits and 8 fibromyalgia-related traits. A total of 4 rsfMRI traits were genetically correlated with trouble falling asleep, 11 with back pain for 3+ months, 16 with pain all over the body, 14 with insomnia, 5 with fibromyalgia, 4 with fibromyalgia, and 3 with malaise and fatigue. Pheno801 has significant causal effects on malaise and fatigue (OR = 1.0022, p = 0.01), fibromyalgia (finngen) (OR = 1.5055, p = 0.03), and insomnia (OR = 1.4063, p = 0.04). Pheno1696 significantly impacts fibromyalgia-related comorbidities (OR = 1.002, p = 0.02), trouble falling asleep (OR = 1.0285, p = 0.04), malaise and fatigue (OR = 1.0011, p = 0.04), and pain all over the body (OR = 0.9967, p = 0.04). Pheno103 has marked effects on fibromyalgia (finngen) (OR = 0.7477, p = 0.02), malaise and fatigue (OR = 0.9987, p = 0.03), and pain all over the body (OR = 1.0033, p = 0.03). Our findings suggest that targeting these networks could effectively prevent or alleviate fibromyalgia.
Keywords: brain functional networks; fibromyalgia; genetic correlations; mendelian randomization; resting-state functional MRI.
Conflict of interest statement
The authors declare no conflicts of interest.
Figures
Similar articles
-
Mind and body therapy for fibromyalgia.Cochrane Database Syst Rev. 2015 Apr 9;2015(4):CD001980. doi: 10.1002/14651858.CD001980.pub3. Cochrane Database Syst Rev. 2015. PMID: 25856658 Free PMC article.
-
Acupuncture for treating fibromyalgia.Cochrane Database Syst Rev. 2013 May 31;2013(5):CD007070. doi: 10.1002/14651858.CD007070.pub2. Cochrane Database Syst Rev. 2013. PMID: 23728665 Free PMC article.
-
Serotonin and noradrenaline reuptake inhibitors (SNRIs) for fibromyalgia.Cochrane Database Syst Rev. 2018 Feb 28;2(2):CD010292. doi: 10.1002/14651858.CD010292.pub2. Cochrane Database Syst Rev. 2018. PMID: 29489029 Free PMC article.
-
Bayesian-weighted Mendelian randomization reveals sleep apnea syndrome mediates the BMI-chronic pain link.J Thorac Dis. 2025 Jun 30;17(6):4091-4103. doi: 10.21037/jtd-2025-827. Epub 2025 Jun 25. J Thorac Dis. 2025. PMID: 40688334 Free PMC article.
-
Insights from Mendelian randomization and genetic correlation analyses into the relationship between endometriosis and its comorbidities.Hum Reprod Update. 2023 Sep 5;29(5):655-674. doi: 10.1093/humupd/dmad009. Hum Reprod Update. 2023. PMID: 37159502 Free PMC article. Review.
References
-
- White K.P., Speechley M., Harth M., Ostbye T. The London Fibromyalgia Epidemiology Study: The prevalence of fibromyalgia syndrome in London, Ontario. J. Rheumatol. 1999;26:1570–1576. - PubMed
LinkOut - more resources
Full Text Sources
