. 2025 Jul 8;15(14):1732.
doi: 10.3390/diagnostics15141732.

Multimodal Imaging of Diabetic Retinopathy: Insights from Optical Coherence Tomography Angiography and Adaptive Optics

Affiliations

Multimodal Imaging of Diabetic Retinopathy: Insights from Optical Coherence Tomography Angiography and Adaptive Optics

Andrada-Elena Mirescu et al. Diagnostics (Basel). .

Abstract

Background/Objectives: To investigate the role of multimodal imaging, specifically optical coherence tomography angiography (OCTA) and adaptive optics (AO), in the diagnosis and monitoring of diabetic retinopathy. Methods: Our study represents an observational, cross-sectional analysis including sixty-nine patients from four distinct groups: a control group (17 patients), diabetic patients without diabetic retinopathy (no DR) (14 patients), diabetic patients with non-proliferative diabetic retinopathy (NPDR) (18 patients), and diabetic patients with proliferative diabetic retinopathy (PDR patients). A comprehensive ophthalmological evaluation, along with high-resolution imaging using OCTA and AO, was performed. OCTA images of the superficial capillary plexus, acquired with the OCT Angio Topcon, were analyzed using a custom-developed MATLAB algorithm, while AO retinal vascular images were evaluated with the manufacturer's software of the Adaptive Optics Retinal Camera rtx1™. Results: Our findings demonstrated statistically significant reductions in foveal avascular zone circularity, superficial capillary plexus density, vessel length density, and fractal dimension, correlating with the severity of diabetic retinopathy, particularly in the PDR. Additionally, mean wall thickness and wall-to-lumen ratio were significantly increased in patients with diabetic retinopathy, notably in PDR. Conclusions: In conclusion, our findings demonstrate that the combined use of OCTA and AO imaging offers complementary insights into the microvascular alterations associated with diabetic retinopathy progression and severity. These high-resolution modalities together reveal both perfusion deficits and structural vascular changes, underscoring their utility as essential tools for early detection, staging, monitoring, and informed management of DR.

Keywords: adaptive optics ophthalmoscopy; diabetic retinopathy; optical coherence tomography angiography.


Conflict of interest statement

The authors declare no conflicts of interest.

Figures

Figure 1
Figure 1
OCTA image of (a) a healthy volunteer, (b) a no DR patient, (c) an NPDR patient, and (d) a PDR patient; custom-developed MATLAB algorithm—for left to right, the first picture represents a manually drawn FAZ (area marked by green dots) and a 3 mm diameter circle (blue circle), the second picture represents the cropped image with FAZ excluded, the third image represents the 2D Frangi vesselness filter, the fourth image represents the binarized image using the Phansalkar local thresholding method, and the fifth image represents the skeletonized image.
Figure 2
Figure 2
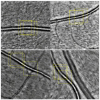
Adaptive optics ophthalmoscopy image—image of the retinal arteriole of (a) a healthy volunteer, (b) a no DR patient, (c) an NPDR patient, and (d) a PDR patient; the yellow boxes represent the selected regions of interest (ROIs), each measuring 100 microns, as indicated by the scale bar and three consecutive measurements were performed, as indicated by the numbers next to each yellow box.
Figure 3
Figure 3
Best corrected visual acuity (BCVA) distribution and data analysis among study groups; post hoc analyses (Dunn’s test) and the statistically significant adjusted p-values between groups: control group and PDR group (p adj = 0.0002), no DR group and PDR group (p adj = 0.016), and NPDR group and PDR group (p adj = 0.015).
Figure 4
Figure 4
FAZ circularity, SCP density, VL density of superficial layer, FD of superficial layer distribution among the study groups and data analyses; FAZ = foveal avascular zone, SCP = superficial capillary plexus, VL = vessel length, FD = fractal dimension; post hoc analyses (Dunn’s test) and the statistically significant adjusted p-values between groups for FAZ circularity: control group and PDR group (p adj = 0.019); post hoc analyses (Tukey’s test) and the statistically significant adjusted p-values between groups for SCP density: control group and PDR group (p adj = 0.015), no DR group and PDR group (p adj = 0.005), for VL density of superficial layer: control group and PDR group (p adj = 0.001), no DR group and PDR group (p adj = 0.001), no DR group and NPDR group (p adj = 0.049), and for FD of superficial layer: control group and PDR group (p adj < 0.0001), no DR group and PDR group (p adj = 0.0001), control group and NPDR group (p adj = 0.004), no DR group and NPDR group (p adj = 0.017).
Figure 5
Figure 5
WT, WLR distribution among the study groups, and data analyses; WT = mean wall thickness, WLR = wall-to-lumen ratio; post hoc analyses (Dunn’s test) and the statistically significant adjusted p-values between groups for WT: control group and PDR group (p adj = 0.008), and for WLR: control group and PDR group (p adj < 0.0001), and control group and NPDR group (p adj = 0.011).
Figure 6
Figure 6
Correlation between BCVA and WLR in diabetic patients; BCVA = best corrected visual acuity, WLR = wall-to-lumen ratio.

References

    1. Wong T.Y., Cheung C.M., Larsen M., Sharma S., Simó R. Diabetic retinopathy. Nat. Rev. Dis. Primers. 2016;2:16012. doi: 10.1038/nrdp.2016.12. - DOI - PubMed
    1. Tang F.Y., Ng D.S., Lam A., Luk F., Wong R., Chan C., Mohamed S., Fong A., Lok J., Tso T., et al. Determinants of Quantitative Optical Coherence Tomography Angiography Metrics in Patients with Diabetes. Sci. Rep. 2017;7:2575. doi: 10.1038/s41598-017-02767-0. - DOI - PMC - PubMed
    1. Sun Z., Yang D., Tang Z., Ng D.S., Cheung C.Y. Optical coherence tomography angiography in diabetic retinopathy: An updated review. Eye. 2021;35:149–161. doi: 10.1038/s41433-020-01233-y. - DOI - PMC - PubMed
    1. Ogurtsova K., da Rocha Fernandes J.D., Huang Y., Linnenkamp U., Guariguata L., Cho N.H., Cavan D., Shaw J.E., Makaroff L.E. IDF Diabetes Atlas: Global estimates for the prevalence of diabetes for 2015 and 2040. Diabetes Res. Clin. Pract. 2017;128:40–50. doi: 10.1016/j.diabres.2017.03.024. - DOI - PubMed
    1. Waheed N.K., Rosen R.B., Jia Y., Munk M.R., Huang D., Fawzi A., Chong V., Nguyen Q.D., Sepah Y., Pearce E. Optical coherence tomography angiography in diabetic retinopathy. Prog. Retin. Eye Res. 2023;97:101206. doi: 10.1016/j.preteyeres.2023.101206. - DOI - PMC - PubMed

LinkOut - more resources