

Brazilian Green Propolis Carried in Lipid-Based Nanostructures: A Potent Adjuvant Therapy to Non-Surgical Periodontal Treatment in the Management of Experimental Periodontitis
- PMID: 40722716
- PMCID: PMC12292236
- DOI: 10.3390/biomedicines13071643
Brazilian Green Propolis Carried in Lipid-Based Nanostructures: A Potent Adjuvant Therapy to Non-Surgical Periodontal Treatment in the Management of Experimental Periodontitis
Abstract
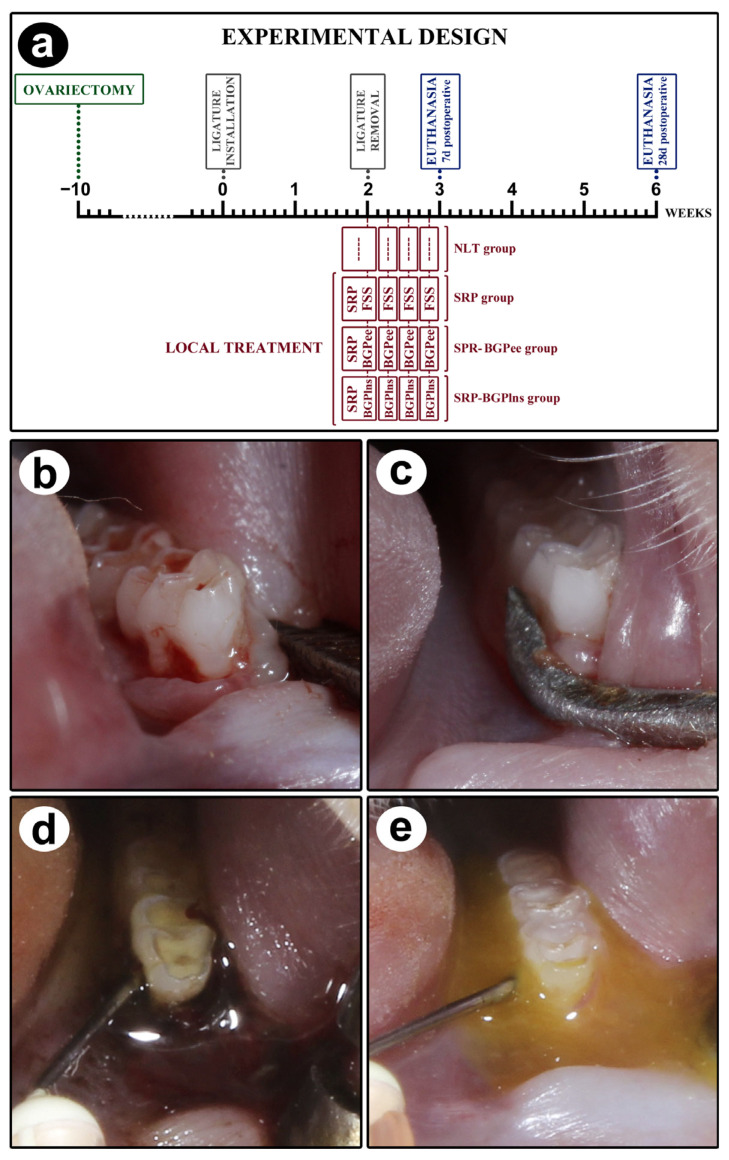
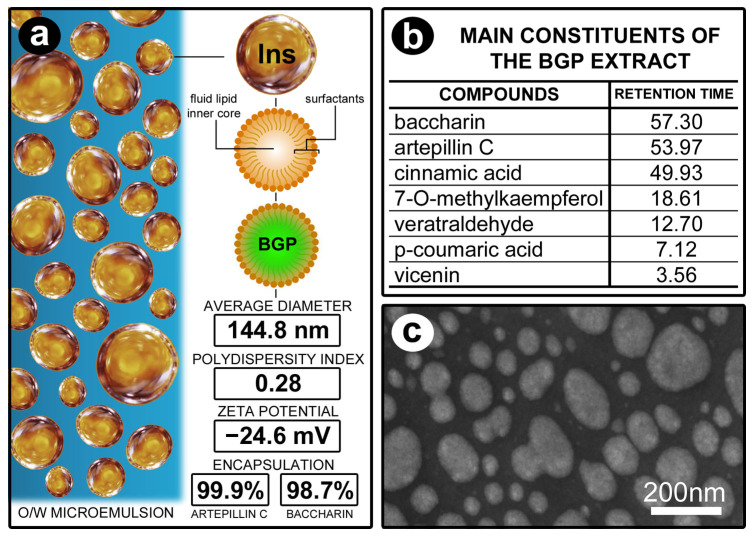
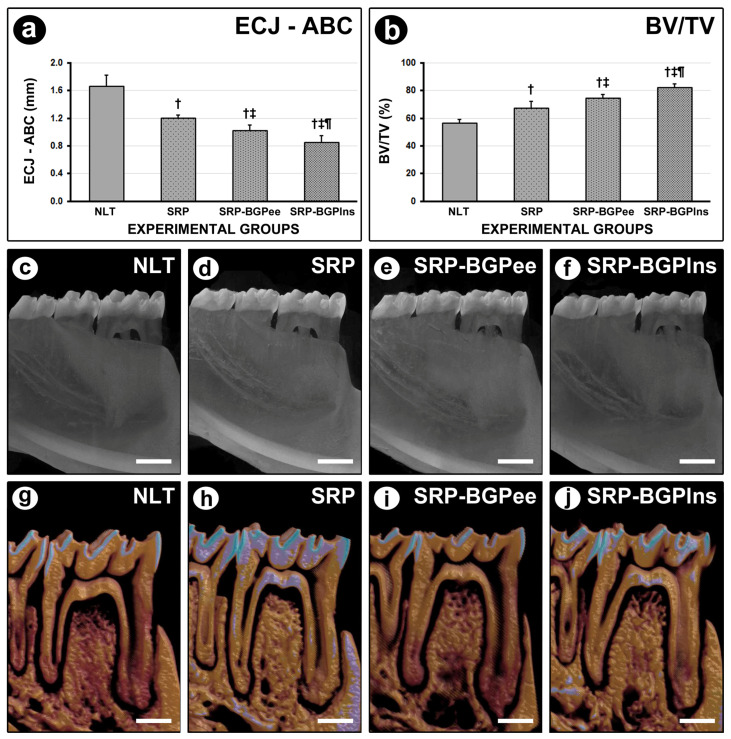
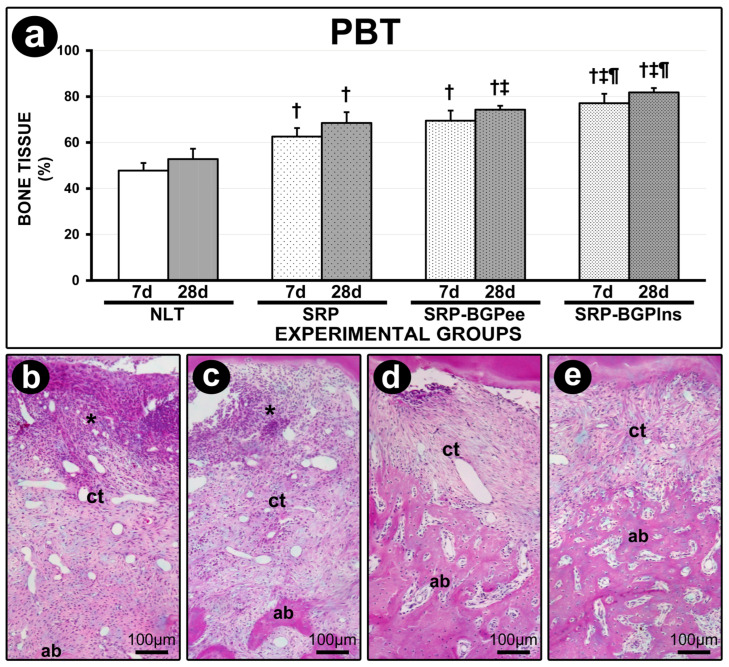
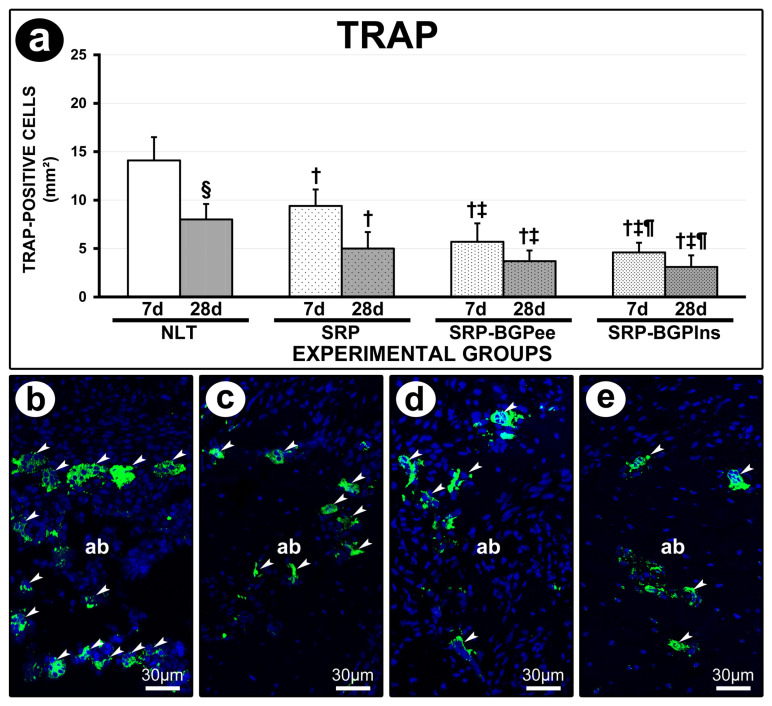
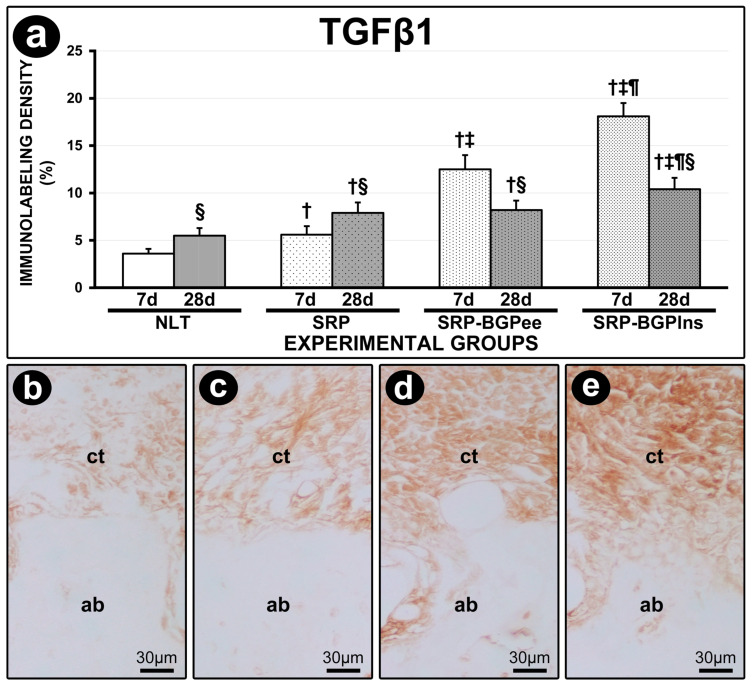
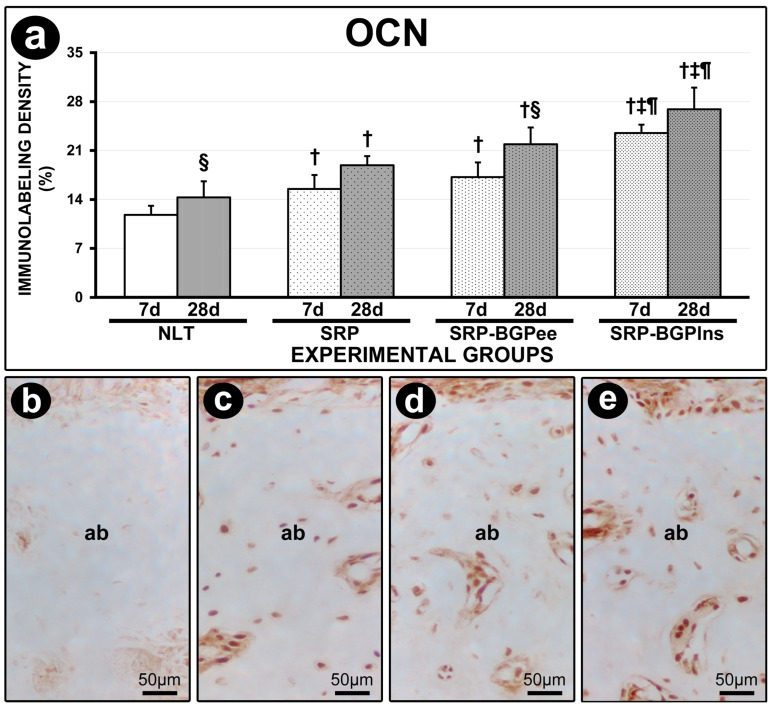
Objective: This study aimed to evaluate the effects of local use of Brazilian Green Propolis (BGP), either as an ethanolic extract (the most common formulation) or incorporated into lipid-based nanostructures, as an adjuvant therapy for non-surgical periodontal treatment in managing experimental periodontitis (EP) in ovariectomized rats. Methods: Fifty-six female Wistar rats underwent bilateral ovariectomies. After 10 weeks, a cotton ligature was placed around the lower first molar and remained in place for two weeks to induce EP. The ligature was removed, and the rats were randomly assigned in the groups NLT (n = 14), SRP (n = 14), SRP-BGPee (n = 14), and SRP-BGPlns (n = 14). In the NLT group, no local treatment was performed. The SRP group received scaling and root planing (SRP), along with irrigation using a physiological saline solution. The SRP-BGPee group underwent SRP and irrigation with ethanolic extract of BGP. The SRP-BGPlns group underwent SRP and irrigation with BGP-loaded lipid nanostructure (BGPlns). Each group received one SRP session followed by four irrigation sessions with the specified solutions, which were conducted immediately after SRP and subsequently after 2, 4, and 6 days. Euthanasia was performed at 7 and 28 days following the removal of the ligatures. The hemimandibles were processed for the following analyses: microtomographic analysis; histological analysis; histometric analysis of the percentage of bone tissue in the furcation region (PBT); and immunohistochemical analysis for tartrate-resistant acid phosphatase activity (TRAP), transforming growth factor beta 1 (TGFβ1), and osteocalcin (OCN). Results: The SRP-BGPlns group demonstrated superior periodontal tissue repair, reduced alveolar bone loss, fewer TRAP-positive cells (at 7 days), and higher levels of immunolabeling for TGFβ1 (at both 7 and 28 days) and OCN (at 28 days) compared to the other experimental groups. Conclusions: The irrigation with BGP is an effective adjuvant therapy for non-surgical periodontal treatment in managing EP in ovariectomized rats. Its application in lipid-based nanostructures proved to be more effective than the ethanolic extract form.
Keywords: green propolis; lipid-based nanostructures; periodontitis; rat; scaling and root planing.
Conflict of interest statement
The authors declare no conflicts of interest.
Figures
Similar articles
-
Full-mouth treatment modalities (within 24 hours) for periodontitis in adults.Cochrane Database Syst Rev. 2022 Jun 28;6(6):CD004622. doi: 10.1002/14651858.CD004622.pub4. Cochrane Database Syst Rev. 2022. PMID: 35763286 Free PMC article.
-
Treatment of periodontal disease for glycaemic control in people with diabetes mellitus.Cochrane Database Syst Rev. 2015 Nov 6;2015(11):CD004714. doi: 10.1002/14651858.CD004714.pub3. Cochrane Database Syst Rev. 2015. Update in: Cochrane Database Syst Rev. 2022 Apr 14;4:CD004714. doi: 10.1002/14651858.CD004714.pub4. PMID: 26545069 Free PMC article. Updated.
-
Local anti-infective therapy: pharmacological agents. A systematic review.Ann Periodontol. 2003 Dec;8(1):79-98. doi: 10.1902/annals.2003.8.1.79. Ann Periodontol. 2003. PMID: 14971250
-
Effectiveness of Local Use of Green Propolis-Loaded Lipid Nanoparticles as Adjuvant Therapy to Scaling and Root Planing in the Management of Periodontitis in Rats Treated with Zoledronate.Int J Mol Sci. 2024 Nov 20;25(22):12443. doi: 10.3390/ijms252212443. Int J Mol Sci. 2024. PMID: 39596508 Free PMC article.
-
Full-mouth treatment modalities (within 24 hours) for chronic periodontitis in adults.Cochrane Database Syst Rev. 2015 Apr 17;2015(4):CD004622. doi: 10.1002/14651858.CD004622.pub3. Cochrane Database Syst Rev. 2015. Update in: Cochrane Database Syst Rev. 2022 Jun 28;6:CD004622. doi: 10.1002/14651858.CD004622.pub4. PMID: 25884249 Free PMC article. Updated.
References
-
- Caton J.G., Armitage G., Berglundh T., Chapple I.L.C., Jepsen S., Kornman K.S., Mealey B.L., Papapanou P.N., Sanz M., Tonetti M.S. A new classification scheme for periodontal and peri-implant diseases and conditions—Introduction and key changes from the 1999 classification. J. Clin. Periodontol. 2018;45((Suppl. 20)):S1–S8. doi: 10.1111/jcpe.12935. - DOI - PubMed
-
- Kassebaum N.J., Smith A.G.C., Bernabé E., Fleming T.D., Reynolds A.E., Vos T., Murray C.J.L., Marcenes W., GBD 2015 Oral Health Collaborators Global, Regional, and National Prevalence, Incidence, and Disability-Adjusted Life Years for Oral Conditions for 195 Countries, 1990–2015: A Systematic Analysis for the Global Burden of Diseases, Injuries, and Risk Factors. J. Dent. Res. 2017;96:380–387. doi: 10.1177/0022034517693566. - DOI - PMC - PubMed
-
- Pannuti C.M., Alarcón M.A., Ramírez Lemus G.M., Yunes Fragoso P., Retamal-Valdes B.S., Cornejo-Ovalle M., Duarte P.M., Leite F.R.M., Gimenez X. Risk factors of periodontal disease: Latin America and the Caribbean Consensus 2024. Braz. Oral. Res. 2024;38((Suppl. 1)):e118. doi: 10.1590/1807-3107bor-2024.vol38.0118. - DOI - PMC - PubMed
Grants and funding
LinkOut - more resources
Full Text Sources
Miscellaneous
