. 2025 Jul 18;14(7):882.
doi: 10.3390/antiox14070882.

Ethanolic Extract of Glycine Semen Preparata Prevents Oxidative Stress-Induced Muscle Damage in C2C12 Cells and Alleviates Dexamethasone-Induced Muscle Atrophy and Weakness in Experimental Mice

Affiliations

Ethanolic Extract of Glycine Semen Preparata Prevents Oxidative Stress-Induced Muscle Damage in C2C12 Cells and Alleviates Dexamethasone-Induced Muscle Atrophy and Weakness in Experimental Mice

Aeyung Kim et al. Antioxidants (Basel). .

Abstract

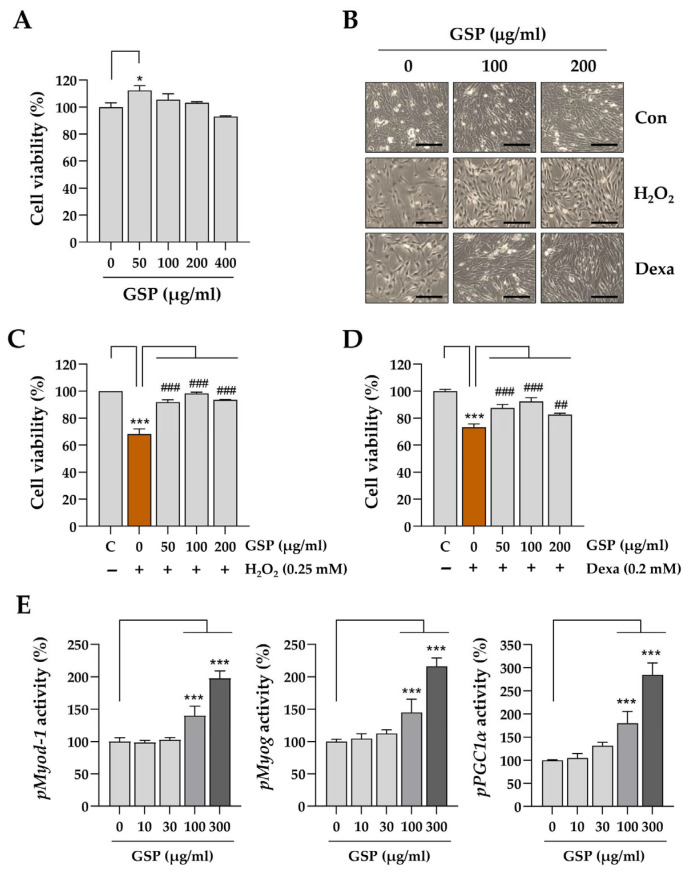
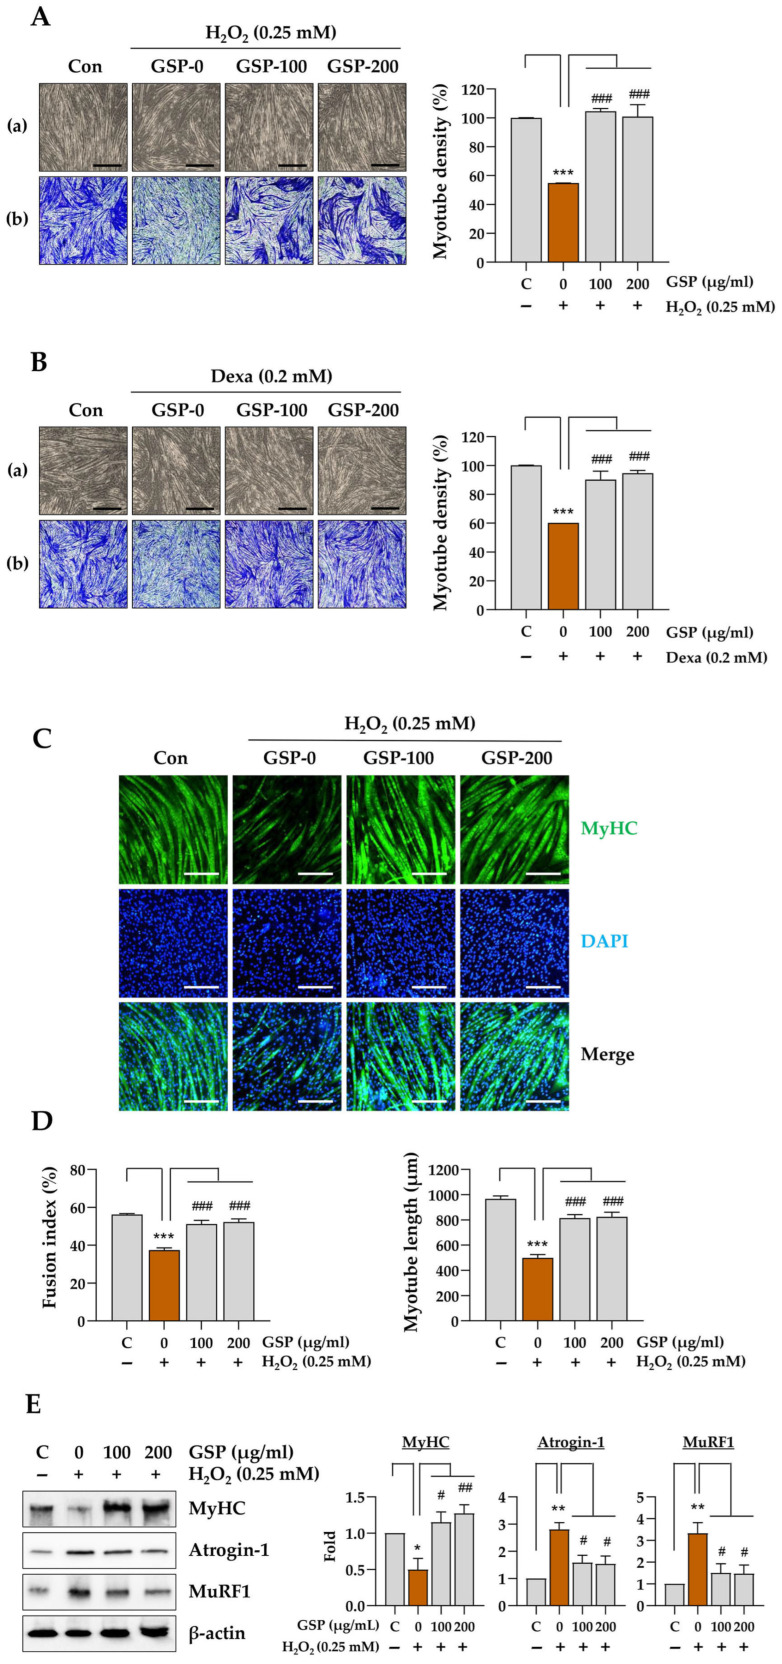
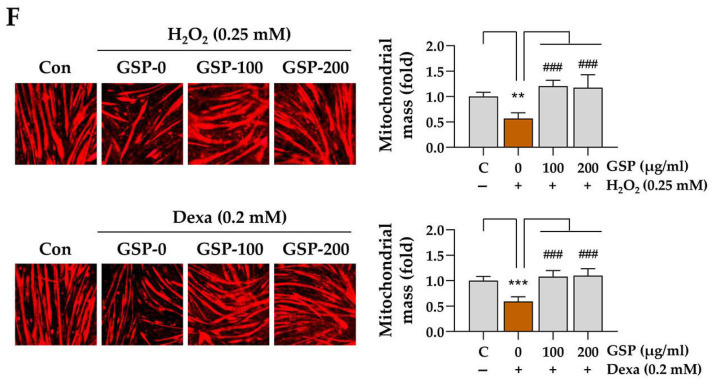
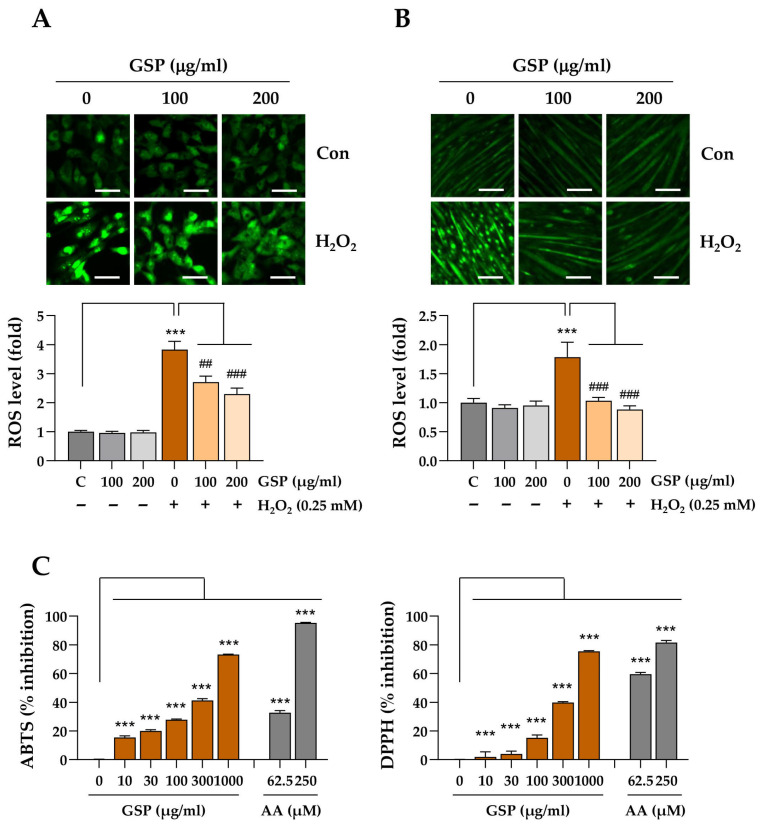
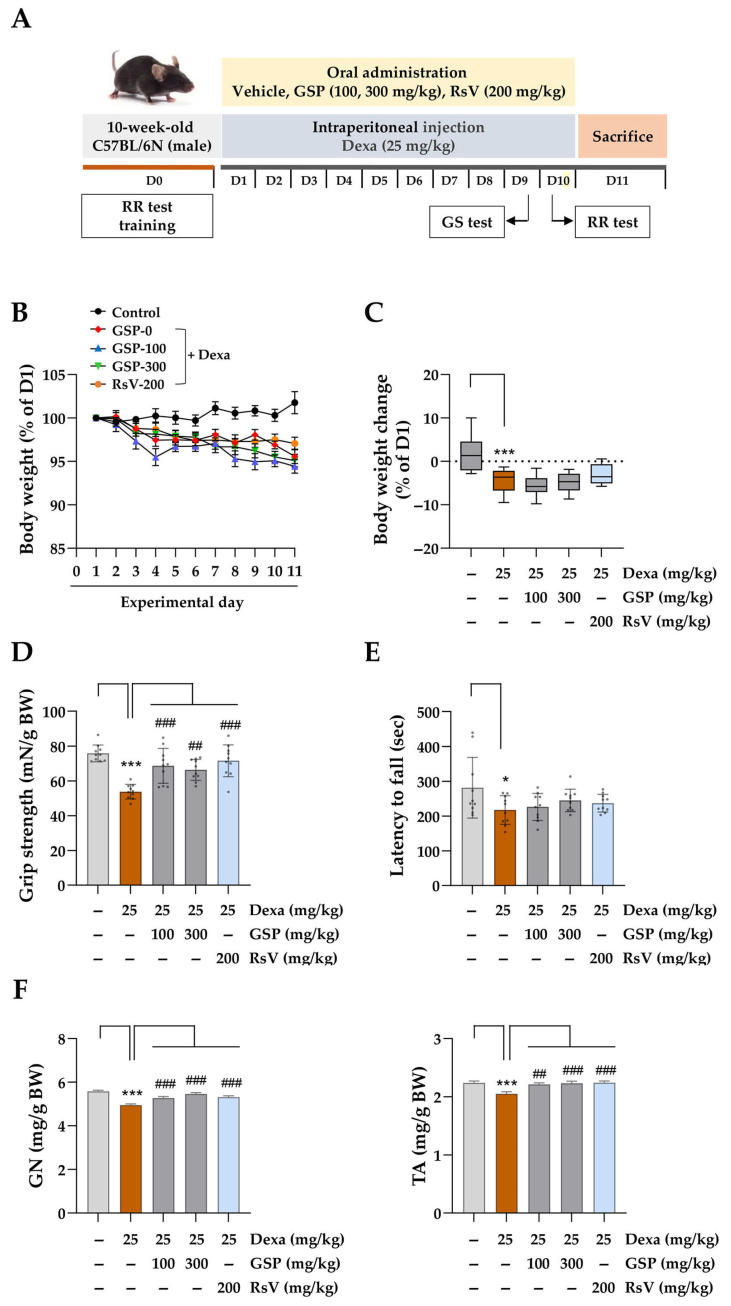
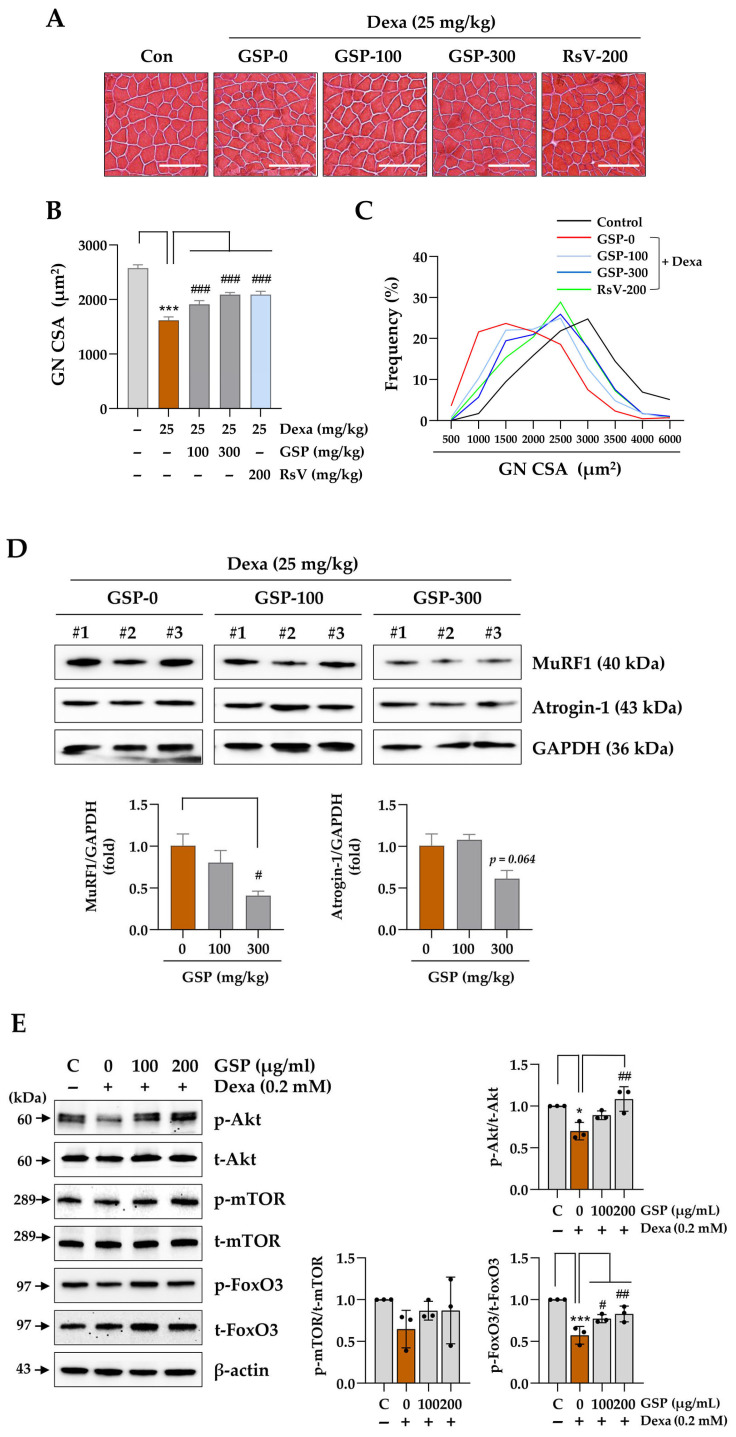
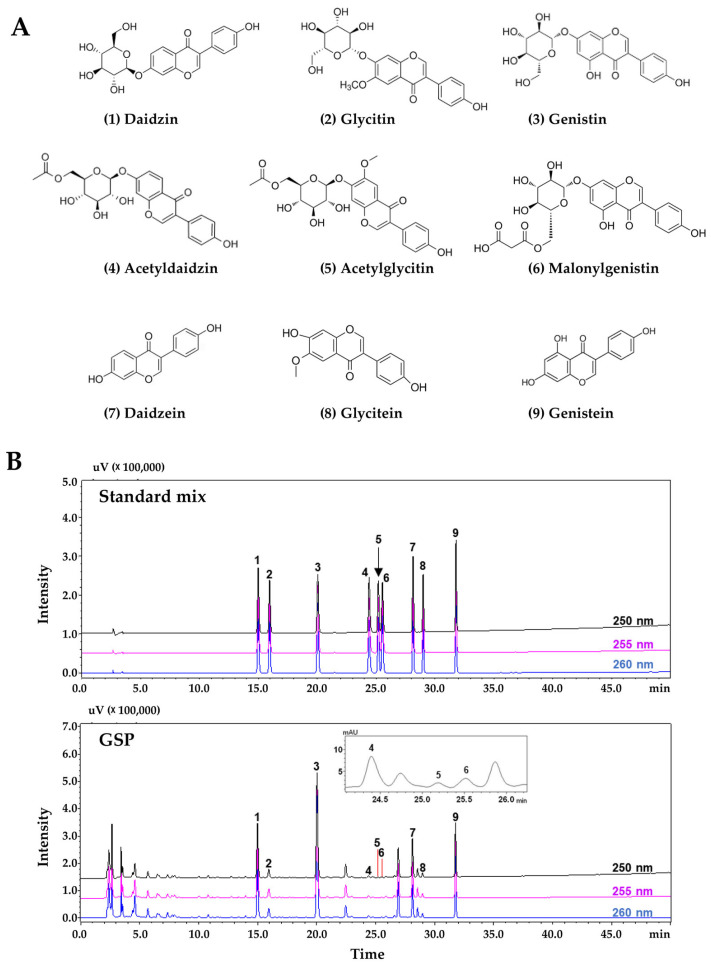
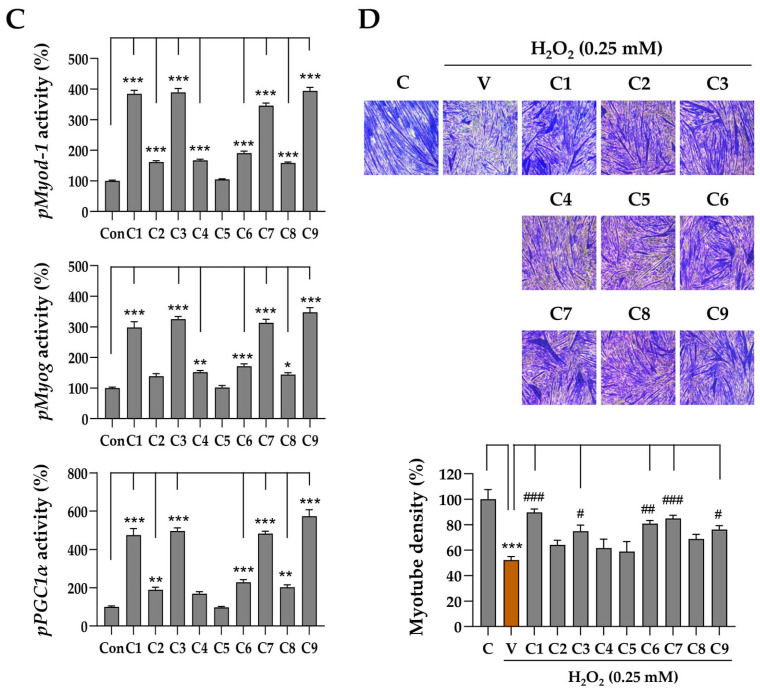
Skeletal muscle atrophy is a debilitating condition characterized by the loss of muscle mass and function. It is commonly associated with aging, chronic diseases, disuse, and prolonged glucocorticoid therapy. Oxidative stress and catabolic signaling pathways play significant roles in the progression of muscle degradation. Despite its clinical relevance, few effective therapeutic options are currently available. In this study, we investigated the protective effects of an ethanolic extract of Glycine Semen Preparata (GSP), i.e., fermented black soybeans, using in vitro and in vivo models of dexamethasone (Dexa)-induced muscle atrophy. In C2C12 myoblasts and myotubes, GSP significantly attenuated both oxidative stress-induced and Dexa-induced damages by reducing reactive oxygen species levels and by suppressing the expression of the muscle-specific E3 ubiquitin ligases MuRF1 and Atrogin-1. Moreover, GSP upregulated key genes involved in muscle regeneration (Myod1 and Myog) and mitochondrial biogenesis (PGC1α), indicating its dual role in muscle protection and regeneration. Oral administration of GSP to mice with Dexa-induced muscle atrophy resulted in improved muscle fiber integrity, increased proportion of large cross-sectional area fibers, and partial recovery of motor function. Isoflavone aglycones, such as daidzein and genistein, were identified as active compounds that contribute to the beneficial effects of GSP through antioxidant activity and gene promoter enhancement. Thus, GSP is a promising nutraceutical that prevents or mitigates muscle atrophy by targeting oxidative stress and promoting myogenesis and mitochondrial function. Further studies are warranted to standardize the bioactive components and explore their clinical applications.

Keywords: Glycine Semen Preparata; fermented black soybean; glucocorticoid; muscle atrophy; oxidative stress.


Conflict of interest statement

The authors declare no conflicts of interest.

Figures

Figure 1
Figure 1
Protective effects of GSP against cytotoxic conditions in C2C12 myoblasts. (A) C2C12 myoblasts were treated with varying concentrations of GSP (0–400 μg/mL) for 24 h, after which cell viability was assessed. The cell viability, relative to vehicle-treated controls, is presented as the mean ± SEM (n = 3). (B) Myoblasts were pretreated with 100 or 200 μg/mL of GSP or vehicle for 12 h and then exposed to 0.25 mM H2O2 or 0.2 mM Dexa for 24 h. Morphological changes were observed using an inverted microscope. (C,D) Myoblasts pretreated with GSP or vehicle were subsequently treated with 0.25 mM H2O2 (C) or 0.2 mM Dexa (D) for an additional 24 h. Cell viability was measured, and the relative values are expressed as means ± SEM (n = 3). (E) Reporter plasmids for Myod1, Myog, and PGC1α promoters were transfected into C2C12 myoblast cells, which were subsequently treated with GSP at concentrations ranging from 0 to 300 μg/mL for 24 h. The promoter activity was assessed using a luciferin substrate reaction, as detailed in the Materials and Methods, and the relative values are expressed as means ± SEM (n = 3). * p < 0.05, *** p < 0.001 vs. vehicle-treated controls; ## p < 0.01, ### p < 0.001 vs. cytotoxic condition + vehicle-treated controls. Scale bar = 100 μm. Dexa, dexamethasone; GSP, Glycine Semen Preparata.
Figure 2
Figure 2
Protective effects of GSP against stressful conditions in C2C12 myotubes. C2C12 myotubes at differentiation day 5 (DD5) were pretreated with 100 and 200 μg/mL of GSP for 24 h and subsequently exposed to 0.25 mM H2O2 (A) or 0.2 mM Dexa (B) for an additional 40 h. Morphological changes were observed using an inverted microscope (a) and subsequently assessed through crystal violet staining to quantify myotube density (b). Following solubilization with 1% SDS, myotube density was quantified as described previously. Relative values, compared to those of vehicle-treated control cells, are presented as means ± SEM (n = 3). (C) Myotubes were pretreated with GSP for 12 h and then treated with 0.25 mM H2O2. After 24 h, cells were subjected to immunofluorescent staining for MyHC (green) and DAPI counterstaining (blue). (D) Fusion index and myotube length were quantitated and presented as means ± SEM (n = 6–11). (E) Protein levels of myosin heavy chain (MyHC), Atrogin-1, and MuRF1 in C2C12 myotubes were quantified using immunoblotting. β-actin served as a loading control. (F) Myotubes were pretreated with GSP for 12 h and further incubated with H2O2. After 24 h, mitochondrial mass was detected using MitoTracker Deep Red dye. The data are expressed as means ± SEM (n = 3). * p < 0.05, ** p < 0.01, *** p < 0.001 vs. vehicle-treated controls; # p < 0.05, ## p < 0.01, ### p < 0.001 vs. stress condition + vehicle-treated controls. Scale bar = 100 μm. Dexa, dexamethasone; GSP, Glycine Semen Preparata.
Figure 2
Figure 2
Protective effects of GSP against stressful conditions in C2C12 myotubes. C2C12 myotubes at differentiation day 5 (DD5) were pretreated with 100 and 200 μg/mL of GSP for 24 h and subsequently exposed to 0.25 mM H2O2 (A) or 0.2 mM Dexa (B) for an additional 40 h. Morphological changes were observed using an inverted microscope (a) and subsequently assessed through crystal violet staining to quantify myotube density (b). Following solubilization with 1% SDS, myotube density was quantified as described previously. Relative values, compared to those of vehicle-treated control cells, are presented as means ± SEM (n = 3). (C) Myotubes were pretreated with GSP for 12 h and then treated with 0.25 mM H2O2. After 24 h, cells were subjected to immunofluorescent staining for MyHC (green) and DAPI counterstaining (blue). (D) Fusion index and myotube length were quantitated and presented as means ± SEM (n = 6–11). (E) Protein levels of myosin heavy chain (MyHC), Atrogin-1, and MuRF1 in C2C12 myotubes were quantified using immunoblotting. β-actin served as a loading control. (F) Myotubes were pretreated with GSP for 12 h and further incubated with H2O2. After 24 h, mitochondrial mass was detected using MitoTracker Deep Red dye. The data are expressed as means ± SEM (n = 3). * p < 0.05, ** p < 0.01, *** p < 0.001 vs. vehicle-treated controls; # p < 0.05, ## p < 0.01, ### p < 0.001 vs. stress condition + vehicle-treated controls. Scale bar = 100 μm. Dexa, dexamethasone; GSP, Glycine Semen Preparata.
Figure 3
Figure 3
Antioxidant activity of GSP. (A,B) C2C12 myoblasts (A) and myotubes (B) were pretreated with GSP (0, 100, and 200 μg/mL) for 12 h and then exposed to 0.25 mM H2O2 for 6 h. Intracellular oxidative stress was evaluated using ROS-sensitive CellROX™ Green dye and visualized under a fluorescent microscope. The fold increase in ROS for each treatment group was compared to vehicle-treated controls. Data are presented as means ± SEM (n = 3). (C) Free radical-scavenging activities of GSP were determined using ABTS and DPPH assays. Ascorbic acid was included in parallel as a positive control in both assays. Data are presented as means ± SEM (n = 2). *** p < 0.001 vs. vehicle-treated controls; ## p < 0.01, ### p < 0.001 vs. H2O2 + vehicle-treated controls. Scale bar = 100 μm. AA, ascorbic acid; Dexa, dexamethasone; GSP, Glycine Semen Preparata.
Figure 4
Figure 4
Effects of oral GSP administration in mice with Dexa-induced muscle atrophy. (A) The experimental schedule, including the induction of muscle atrophy, GSP and positive control administration, and behavioral evaluation, is outlined. (B) Body weight was recorded daily throughout the experimental period, and relative body weight was determined by comparison with the body weight on day 1 (D1). The data are presented as means ± SEM (n = 10). (C) The change in body weight on day 11 (D11) was determined by comparing it to the weight recorded on D1. The dashed line indicates no change in body weight compared to day 1 (baseline, 0%). Data are presented as means ± SEM (n = 10). (D) Grip strength tests were conducted on D9 and normalized by body weight. Data are expressed as means ± SEM (n = 10). Dots indicate individual values. (E) On day 10 (D10), the rotarod test was conducted to evaluate motor coordination capabilities by measuring the time until the mice fell off the rotating rod. Data are expressed as means ± SEM (n = 10). Dots indicate individual values. (F) On day 11 (D11), the mice were euthanized, and the gastrocnemius (GN) and tibialis anterior (TA) muscles were excised and weighed. Muscle weight was normalized to body weight and reported as means ± SEM (n = 10). * p < 0.05, *** p < 0.001 vs. vehicle-treated group, ## p < 0.01, ### p < 0.001 vs. Dexa + vehicle-treated group. Dexa, dexamethasone; GSP, Glycine Semen Preparata.
Figure 5
Figure 5
Effects of oral GSP administration on the myofiber integrity and expression of muscle degradation-related proteins in muscle tissues of mice with Dexa-induced muscle atrophy. (A) To assess muscle atrophy, gastrocnemius (GN) muscle tissue sections were stained with H&E and examined under a microscope. Images depicting cross-sections of myofibers are presented. Scale bar = 100 μm. (B) The cross-sectional area (CSA) of the GN muscle fibers was quantified using ImageJ software, version 1.54f and expressed as means ± SEM (n = 5). A minimum of 500 myofibers were measured in each sample. (C) The frequency distribution of the CSA of myofibers was analyzed. (D) The MuRF1 and Atrogin-1 protein levels in GN muscles were determined by immunoblotting (n = 3). GAPDH served as a loading control. (E) C2C12 myotubes at differentiation day 5 (DD5) were pretreated with 100 and 200 μg/mL of GSP for 15 h and subsequently exposed to 0.2 mM Dexa for 24 h. Protein levels in C2C12 myotubes were quantified using immunoblotting. β-actin served as a loading control. The data are expressed as means ± SEM (n = 3). Dots indicate individual values. * p < 0.05, *** p < 0.001 vs. vehicle-treated group, # p < 0.05, ## p < 0.01, ### p < 0.001 vs. Dexa + vehicle-treated group. CSA, cross-sectional area; Dexa, dexamethasone; GN, gastrocnemius; GSP, Glycine Semen Preparata.
Figure 6
Figure 6
HPLC analysis of GSP and identification of flavonoids exhibiting muscle-protective effects. (A) Chemical structure of nine flavonoids. (B) HPLC chromatograms of standard solutions and GSP samples. Daidzin (1), glycitin (2), genistin (3), acetyldaidzin (4), acetylglycitin (5), malonylgenistin (6), daidzein (7), glycitein (8), and genistein (9). (C) Reporter plasmids for Myod1, Myog, and PGC1α were transfected into C2C12 myoblasts and treated with 20 µM of each flavonoid for 24 h. Promoter activity was measured using a luciferin substrate reaction. (D) C2C12 myotubes on differentiation day 5 were pretreated with 20 µM of each flavonoid for 12 h and then exposed to 0.25 mM H2O2 for 24 h. Myotube density was quantified using crystal violet staining and 1% SDS solubilization; the results are presented as means ± SEM (n = 3) compared to vehicle-treated controls. All microscopic images were captured at ×100 magnification. * p < 0.05, ** p < 0.01, *** p < 0.001 vs. vehicle-treated controls; # p < 0.05, ## p < 0.01, ### p < 0.001 vs. H2O2 + vehicle-treated controls. GSP, Glycine Semen Preparata.
Figure 6
Figure 6
HPLC analysis of GSP and identification of flavonoids exhibiting muscle-protective effects. (A) Chemical structure of nine flavonoids. (B) HPLC chromatograms of standard solutions and GSP samples. Daidzin (1), glycitin (2), genistin (3), acetyldaidzin (4), acetylglycitin (5), malonylgenistin (6), daidzein (7), glycitein (8), and genistein (9). (C) Reporter plasmids for Myod1, Myog, and PGC1α were transfected into C2C12 myoblasts and treated with 20 µM of each flavonoid for 24 h. Promoter activity was measured using a luciferin substrate reaction. (D) C2C12 myotubes on differentiation day 5 were pretreated with 20 µM of each flavonoid for 12 h and then exposed to 0.25 mM H2O2 for 24 h. Myotube density was quantified using crystal violet staining and 1% SDS solubilization; the results are presented as means ± SEM (n = 3) compared to vehicle-treated controls. All microscopic images were captured at ×100 magnification. * p < 0.05, ** p < 0.01, *** p < 0.001 vs. vehicle-treated controls; # p < 0.05, ## p < 0.01, ### p < 0.001 vs. H2O2 + vehicle-treated controls. GSP, Glycine Semen Preparata.

Similar articles

References

    1. Yin L., Li N., Jia W., Wang N., Liang M., Yang X., Du G. Skeletal muscle atrophy: From mechanisms to treatments. Pharmacol. Res. 2021;172:105807. doi: 10.1016/j.phrs.2021.105807. - DOI - PubMed
    1. Landi F., Camprubi-Robles M., Bear D.E., Cederholm T., Malafarina V., Welch A.A., Cruz-Jentoft A.J. Muscle loss: The new malnutrition challenge in clinical practice. Clin. Nutr. 2019;38:2113–2120. doi: 10.1016/j.clnu.2018.11.021. - DOI - PubMed
    1. Evans W.J. Skeletal muscle loss: Cachexia, sarcopenia, and inactivity. Am. J. Clin. Nutr. 2010;91:1123s–1127s. doi: 10.3945/ajcn.2010.28608A. - DOI - PubMed
    1. Schakman O., Kalista S., Barbé C., Loumaye A., Thissen J.P. Glucocorticoid-induced skeletal muscle atrophy. Int. J. Biochem. Cell Biol. 2013;45:2163–2172. doi: 10.1016/j.biocel.2013.05.036. - DOI - PubMed
    1. Anker S.D., Morley J.E., von Haehling S. Welcome to the ICD-10 code for sarcopenia. J. Cachexia Sarcopenia Muscle. 2016;7:512–514. doi: 10.1002/jcsm.12147. - DOI - PMC - PubMed

LinkOut - more resources