

Mapping the Fat: How Childhood Obesity and Body Composition Shape Obstructive Sleep Apnoea
- PMID: 40723105
- PMCID: PMC12293431
- DOI: 10.3390/children12070912
Mapping the Fat: How Childhood Obesity and Body Composition Shape Obstructive Sleep Apnoea
Abstract
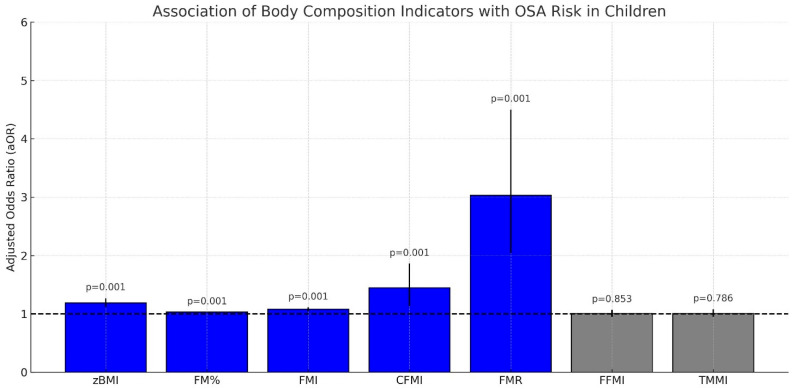
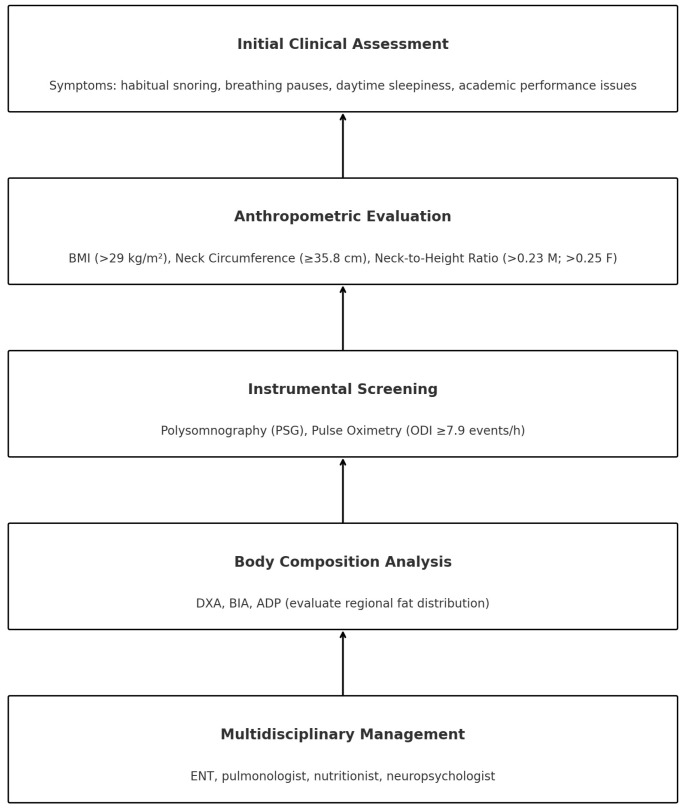
Background/Objectives: Childhood obesity represents a growing public health concern. It is closely associated with obstructive sleep apnoea (OSA), which impairs nocturnal breathing and significantly affects neurocognitive and cardiovascular health. This review aims to analyse differences in fat distribution, anthropometric parameters, and instrumental assessments of paediatric OSA compared to adult OSA to improve the diagnostic characterisation of obese children. Methods: narrative review. Results: While adenotonsillar hypertrophy (ATH) remains a primary cause of paediatric OSA, the increasing prevalence of obesity has introduced distinct pathophysiological mechanisms, including fat accumulation around the pharynx, reduced respiratory muscle tone, and systemic inflammation. Children exhibit different fat distribution patterns compared to adults, with a greater proportion of subcutaneous fat relative to visceral fat. Nevertheless, cervical and abdominal adiposity are crucial in increasing upper airway collapsibility. Recent evidence highlights the predictive value of anthropometric and body composition indicators such as neck circumference (NC), neck-to-height ratio (NHR), neck-to-waist ratio (NWR), fat-to-muscle ratio (FMR), and the neck-to-abdominal-fat percentage ratio (NAF%). In addition, ultrasound assessment of lateral pharyngeal wall (LPW) thickness and abdominal fat distribution provides clinically relevant information regarding anatomical contributions to OSA severity. Among imaging modalities, dual-energy X-ray absorptiometry (DXA), bioelectrical impedance analysis (BIA), and air displacement plethysmography (ADP) have proven valuable tools for evaluating body fat distribution. Conclusions: Despite advances in the topic, a validated predictive model that integrates these parameters is still lacking in clinical practice. Polysomnography (PSG) remains the gold standard for diagnosis; however, its limited accessibility underscores the need for complementary tools to prioritise the identification of children at high risk. A multimodal approach integrating clinical, anthropometric, and imaging data could support the early identification and personalised management of paediatric OSA in obesity.
Keywords: anthropometric measure; body composition; children; fat distribution; obesity; obstructive sleep apnoea; polysomnography; sleep disordered breathing; ultrasonography.
Conflict of interest statement
The authors declare no conflicts of interest.
Figures
Similar articles
-
Tonsillectomy or adenotonsillectomy versus non-surgical management for obstructive sleep-disordered breathing in children.Cochrane Database Syst Rev. 2015 Oct 14;2015(10):CD011165. doi: 10.1002/14651858.CD011165.pub2. Cochrane Database Syst Rev. 2015. PMID: 26465274 Free PMC article.
-
Drug therapy for obstructive sleep apnoea in adults.Cochrane Database Syst Rev. 2013 May 31;2013(5):CD003002. doi: 10.1002/14651858.CD003002.pub3. Cochrane Database Syst Rev. 2013. PMID: 23728641 Free PMC article.
-
Multilevel-Single Stage-Functional Rhinoplasty & BRP (Barb Reposition Palatoplasty) in Surgical Management of Primary Snorers, UARS and Mild OSA.Indian J Otolaryngol Head Neck Surg. 2024 Dec;76(6):5672-5681. doi: 10.1007/s12070-024-05059-y. Epub 2024 Oct 8. Indian J Otolaryngol Head Neck Surg. 2024. PMID: 39559159
-
Drug therapy for obstructive sleep apnoea in adults.Cochrane Database Syst Rev. 2006 Apr 19;(2):CD003002. doi: 10.1002/14651858.CD003002.pub2. Cochrane Database Syst Rev. 2006. Update in: Cochrane Database Syst Rev. 2013 May 31;(5):CD003002. doi: 10.1002/14651858.CD003002.pub3. PMID: 16625567 Updated.
-
Effects of opioid, hypnotic and sedating medications on sleep-disordered breathing in adults with obstructive sleep apnoea.Cochrane Database Syst Rev. 2015 Jul 14;(7):CD011090. doi: 10.1002/14651858.CD011090.pub2. Cochrane Database Syst Rev. 2015. PMID: 26171909
References
-
- Börnhorst C., Ahrens W., De Henauw S., Hunsberger M., Molnár D., Moreno L.A., Russo P., Schreuder A., Sina E., Tornaritis M., et al. Age-Specific Quantification of Overweight/Obesity Risk Factors From Infancy to Adolescence and Differences by Educational Level of Parents. Int. J. Public Health. 2023;68:1605798. doi: 10.3389/ijph.2023.1605798. - DOI - PMC - PubMed
Publication types
LinkOut - more resources
Full Text Sources
