. 2025 Jul 9;17(14):2287.
doi: 10.3390/cancers17142287.

Patient-Derived Gastric Cancer Assembloid Model Integrating Matched Tumor Organoids and Stromal Cell Subpopulations

Affiliations

Patient-Derived Gastric Cancer Assembloid Model Integrating Matched Tumor Organoids and Stromal Cell Subpopulations

Irit Shapira-Netanelov et al. Cancers (Basel). .

Abstract

Background/Purpose: Conventional three-dimensional in vitro tumor models often fail to fully capture the complexity of the tumor microenvironment, particularly the diverse populations of cancer-associated fibroblasts that contribute to poor prognosis and treatment resistance. The purpose of this study is to develop a patient-specific gastric cancer assembloid model that integrates tumor epithelial cells with matched stromal cell subtypes, each derived using tailored growth media to enhance cancer preclinical research and advance personalized therapeutic strategies. Methods: Tumor tissue was dissociated, and cells expanded in media for organoids, mesenchymal stem cells, fibroblasts, or endothelial cells. The resulting tumor-derived subpopulations were co-cultured in an optimized assembloid medium supporting each cell type's growth. Biomarker expression was assessed by immunofluorescence staining, and transcriptomic profiles were analyzed by RNA sequencing. Drug responsiveness was evaluated using cell viability assays following treatment with various therapeutic agents. Results: The optimized co-culture conditions yielded assembloids that closely mimicked the cellular heterogeneity of primary tumors, confirmed by the expression of epithelial and stromal markers. Compared to monocultures, the assembloids showed higher expression of inflammatory cytokines, extracellular matrix remodeling factors, and tumor progression-related genes across different organoids and stromal ratios. Drug screening revealed patient- and drug-specific variability. While some drugs were effective in both organoid and assembloid models, others lost efficacy in the assembloids, highlighting the critical role of stromal components in modulating drug responses. Conclusions: This assembloid system offers a robust platform to study tumor-stroma interactions, identify resistance mechanisms, and accelerate drug discovery and personalized therapeutic strategies for gastric cancer.

Keywords: assembloids; drug resistance; gastric cancer; organoids; personalized medicine; stromal cell subpopulations; tumor microenvironment.


Conflict of interest statement

The authors declare no conflicts of interest.

Figures
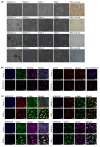
Figure 1
Figure 1
Characterization of gastric tumor-derived PDGCOs and autologous stromal cell subpopulations. (a) Representative brightfield images of matched PDGCOs and stromal cell subpopulations cultured in mesenchymal stem cell medium (MSCM), endothelial cell medium (ECM), and fibroblast medium (FM2), labeled by patient (1–4). Also shown are FM2-cultured cells stained with Oil Red.Scale bar = 100 µm (b) Representative immunofluorescence images of PDGCOs and matched tumor tissue stained for epithelial and stemness markers: CD146/EPCAM, ALDH1A1/CD133, or CDH1. Nuclei were counterstained with Hoechst. (c) Representative immunofluorescence images of stromal cells cultured in MSCM, ECM, or FM2, as well as paired tumor tissue, stained for stromal and mesenchymal markers: Vimentin/αSMA or CD105/CD73. Nuclei were counterstained with Hoechst. Scale bar = 100 µm.
Figure 2
Figure 2
Comparative genomic landscape of gastric tumor-derived PDGCOs and matched stromal cells. (a) Oncoplot showing the distribution and types of somatic mutations associated with gastric adenocarcinoma across tumor tissue and tumor-derived cultured cells. Mutation types are indicated by color: missense (dark green), frameshift deletion (blue), frameshift insertion (violet), splice site (orange), multi-hit (black), in-frame deletion (light green), and in-frame insertion (red). (be) Reactome and KEEG enrichment analysis of pathways affected by mutations in (b) normal stomach tissue, (c) tumor tissue, (d) PDGCOs, and (e) tumor-derived stromal cells cultured in MSCM.
Figure 3
Figure 3
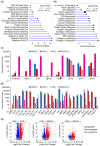
Gene expression analysis of gastric tumor PDGCOs and matched stromal cells. (a) Lollipop chart of Reactome and KEEG pathway enrichment for genes upregulated in PDGCOs compared to stromal cells. (b) The lollipop chart showing pathways enriched in stromal cells compared to PDGCOs. (c) Bar plot comparing expression of epithelial and (d) mesenchymal markers in PDGCOs and stromal cell cultures. (e) Volcano plot displaying differentially expressed genes in stromal cells cultured in FM2 compared to ECM and MSCM, as well as ECM compared to MSCM media. Data are presented as mean ± SEM.
Figure 4
Figure 4
Generation of a gastric cancer assembloid model from matched PDGCOs and stromal cell subpopulations. Representative brightfield and Z-stacks immunofluorescence images of (a) PDGCAs composed of paired stromal cells cultured in MSCM-ECM (blue) and FM2 (magenta) media, along with PDGCOs (green), at a ratio of 1:1:4, under three conditions: no scaffold, matrigel, or matrigel with fibronectin. (b) PDGCAs composed of stromal cells cultured in MSCM-ECM (blue) and FM2 (green) media, as well as PDGCOs (magenta), at different ratios (1:1:1, 1:4:1, 4:1:1, or 1:1:4). (c) Viability of PDGCOs and PDGCAs across different ECM:FM2:PDGCOs ratios. Scale bar = 100 µm. Images acquired using a Zeiss confocal microscope (Zeiss, Oberkochen, Germany). Data are presented as mean ± SEM.
Figure 5
Figure 5
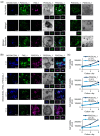
Protein visualization of epithelial and stromal cell markers in PDGCAs. (ad) Representative Z-stack immunofluorescence images showing expression of Vimentin, CD146, and EPCAM in primary tumor tissue, PDCGOs, and PDCGAs from multiple patients. Nuclei were counterstained with Hoechst. Scale bar = 100 µm. Images acquired using a Zeiss confocal microscope.
Figure 6
Figure 6
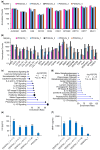
Effect of microenvironment composition on PDGCAs transcriptomic signatures. Bar plot of differentially expressed (a) epithelial and (b) mesenchymal markers in PDGCOs_1 and PDGCAs_1 at various ECM_1:FM2_1:PDGCO_1s ratios (1:1:1 (1), 1:4:1 (2), 4:1:1 (3), or 1:1:4 (4)). Lollipop chart of enriched signaling pathways identified in representative PDGCAs_1 cultured at ECM_1:FM2_1:PDGCOs_1 ratios of (c) 1:1:1 or (d) 1:4:1. Expression levels of IL-8 (e) and MMP-1 (f) in conditioned media from PDGCAs_1 and PDGCOs_1 cultures, quantified using ELISA. Data are presented as mean ± SEM. Statistical significance: ** p < 0.01, *** p < 0.005, **** p < 0.001. Comparisons: PDGCAs versus PDGCOs_1 (*).
Figure 7
Figure 7
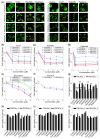
Therapy responsiveness in PDGCAs and matched PDGCOs. (a) Representative immunofluorescence images of paired PDGCAs and PDGCOs treated with FLOT, FOLFIRI, or Paclitaxel for 72 h, stained with Calcein (live cells, green) and Ethidium Homodimer-1 (dead cells, red). Scale bar = 100 µm. Images captured using Zeiss confocal microscope. (bf) Cell viability of PDGCAs and PDGCOs after 72 h exposure to chemotherapies (FLOT, FOLFIRI, Paclitaxel, FOLFOX, or Doxorubicin), measured using CellTiter-Glo. (gj) Cell viability assays evaluating the efficacy of targeted therapies across patient-derived PDGCAs and PDGCOs. Data represent mean ± SEM, (n = 3). Statistical significance: * p < 0.05, **** p < 0.001; ### p < 0.001; #### p < 0.0001. Comparisons: PDGCAs versus PDGCOs (*), treatment versus control (#). Samples 1–4 represent tumors derived from different patients.

References

    1. Bray F., Laversanne M., Sung H., Ferlay J., Siegel R.L., Soerjomataram I., Jemal A. Global cancer statistics 2022: GLOBOCAN estimates of incidence and mortality worldwide for 36 cancers in 185 countries. CA Cancer J. Clin. 2024;74:229–263. doi: 10.3322/caac.21834. - DOI - PubMed
    1. Chen T., Xu X.Y., Zhou P.H. Emerging molecular classifications and therapeutic implications for gastric cancer. Chin. J. Cancer. 2016;35:49. doi: 10.1186/s40880-016-0111-5. - DOI - PMC - PubMed
    1. Ho S.W.T., Tan P. Dissection of gastric cancer heterogeneity for precision oncology. Cancer Sci. 2019;110:3405–3414. doi: 10.1111/cas.14191. - DOI - PMC - PubMed
    1. Hompe E.D., Sachdeva U.M. Updates in Translational Science for Esophageal and Gastric Cancers. Surg. Oncol. Clin. N. Am. 2024;33:571–581. doi: 10.1016/j.soc.2023.12.022. - DOI - PubMed
    1. Korfer J., Lordick F., Hacker U.T. Molecular Targets for Gastric Cancer Treatment and Future Perspectives from a Clinical and Translational Point of View. Cancers. 2021;13:5216. doi: 10.3390/cancers13205216. - DOI - PMC - PubMed

LinkOut - more resources