. 2025 Jun 27;14(7):780.
doi: 10.3390/biology14070780.

Transcriptomic and Functional Validation Reveals PAQR3/P6-55 as Potential Therapeutic Targets in Colon Cancer

Affiliations

Transcriptomic and Functional Validation Reveals PAQR3/P6-55 as Potential Therapeutic Targets in Colon Cancer

Xue You et al. Biology (Basel). .

Abstract

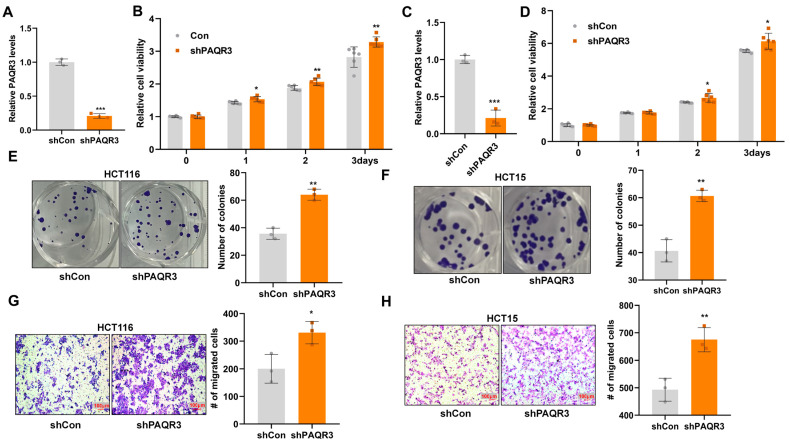
Colon cancer is one of the leading malignant tumors worldwide, and the membrane protein PAQR3 has been identified as a tumor suppressor in multiple cancers. Notably, the peptide synthesized from 6 to 55 amino acids at the N-terminal of PAQR3 (P6-55) has been shown to effectively inhibit the growth of gastric cancer cells. This study aims to elucidate the mechanism of PAQR3 and explore its therapeutic potential in colon cancer. CCK8 cell viability assays, colony formation assays, and transwell migration assays were employed to systematically assess the inhibitory effects of PAQR3 on the proliferation and migration of colon cancer cells. Furthermore, we confirmed that P6-55 exhibits functional similarities to PAQR3, effectively inhibiting the growth of colon cancer in vitro and in vivo. RNA sequencing revealed that PAQR3 suppresses tumor growth via the PI3K-AKT signaling pathway, providing a strong theoretical foundation for therapeutic strategies targeting PAQR3/P6-55. In conclusion, our findings highlight the therapeutic potential of PAQR3/P6-55 as novel colon cancer inhibitors.

Keywords: P6-55; PAQR3; PI3K-AKT; colon cancer.


Conflict of interest statement

The authors declare no conflicts of interest.

Figures

Figure 1
Figure 1
PAQR3 knockdown stimulates the proliferation and migration of colon cancer cells. (A) HCT116 cells were infected with lentivirus to achieve PAQR3 knockdown (PAQR3-KD), with a control group (shCon) for comparison. Following puromycin selection, the knockdown efficiency was confirmed via RNA extraction and subsequent qRT-PCR to measure mRNA expression levels. (B) The CCK8 assay was employed to assess the changes in the growth viability of PAQR3-KD and control HCT116 cells over the indicated time periods. (C) The knockdown efficiency of PAQR3 in HCT15 cells was similarly verified using qRT-PCR. (D) A CCK8 assay was conducted to further evaluate the growth viability of the two cell lines mentioned in (C). (E,F) Clonogenicity was assessed after inoculation of the PAQR3-KD and control HCT116 (E) and HCT15 (F) stable cell lines for 2 weeks. Representative images are displayed, with the number of clones quantified on the right. (G,H) A transwell chamber migration assay was performed to compare the migration capabilities of PAQR3 knockdown and control HCT116 (G) and HCT15 (H) cells. Representative images of crystal violet-stained cells are shown, with the statistical data for the number of migrating cells presented on the right. * indicates p < 0.05, ** indicates p < 0.01, and *** indicates p < 0.001.
Figure 2
Figure 2
PAQR3 overexpression inhibits the proliferation and migration of colon cancer cells. (A) PAQR3 overexpression (PAQR3-OV) was achieved in HCT116 cells using lentiviral infection, with a corresponding control (Con) group being established. The efficiency of PAQR3 overexpression was evaluated via qRT-PCR. (B) After stable overexpression of PAQR3 in HCT116 cells, the stable cell line of A was seeded into 96-well plates, and the cell viability within 3 days was detected via CCK8 assay at a wavelength of 450 nm. (C) Stable cell lines with PAQR3 overexpression in HCT15 cells were constructed using the method described in A, and the expression efficiency of PAQR3 after stable overexpression in HCT15 cells was detected using qRT-PCR. (D) Changes in cell viability following PAQR3 overexpression in HCT15 cells were assessed at a wavelength of 450 nm through CCK8 assay. (E,F) The clonogenic ability of stably PAQR3-overexpressing HCT116 (E) and HCT15 (F) cell lines was assessed two weeks after inoculation. Representative images are displayed, with the number of clones quantified on the right. (G,H) The effect of PAQR3 overexpression on cell migration ability was determined using the transwell method. After stable overexpression of PAQR3 in HCT116 (G) and HCT15 (H) cells, cells were seeded into the upper chamber, and the cells that migrated to the lower chamber were fixed with paraformaldehyde for 20 min and stained with crystal violet for 20 min. After scrubbing, the number of cells migrating from the upper chamber to the lower chamber was determined under a microscope. Representative images are shown, along with statistical data for the number of migrating cells presented on the right. * indicates p < 0.05, ** indicates p < 0.01, and *** indicates p < 0.001.
Figure 3
Figure 3
P6-55 inhibits the proliferation and migration of colon cancer cells. (A,B) HCT116 (A) and HCT15 (B) cells were treated with a control peptide or P6-55 for the indicated time periods, and cell viability was assessed using the CCK8 assay. (C,D) Colony formation was evaluated after treating HCT116 (C) and HCT15 (D) cells with a control peptide or P6-55 for 2 weeks, as demonstrated through crystal violet staining. Representative images are displayed, with the number of colonies quantified on the right. (E,F) The migration ability of the cells was tested using the transwell assay after treatment with a control peptide or P6-55. Representative images of migrating cells are shown, along with the statistical data for the number of migrating cells, presented on the right. * indicates p < 0.05, ** indicates p < 0.01, and *** indicates p < 0.001.
Figure 4
Figure 4
P6-55 inhibits the growth of colon cancer in a nude mouse tumor model. (A) HCT15 cells were injected subcutaneously into the right dorsal region of the mice in an equal number. When the tumor volume reached approximately 100 mm3, the mice were randomly divided into two groups. Both the control peptide and P6-55 were diluted with 50 μL of PBS at a dose of 100 mg, and each group received injections of either the control peptide or P6-55 every day. After 16 days of treatment, the tumors were excised and photographed. (B) The volume measurements of the tumors from mice treated with control peptide versus P6-55. (C) The weight measurements of the excised tumors from both treatment groups. (D) Immunohistochemical staining of Ki67 in paraffin-embedded sections of the tumor tissue shown in the subfigure (scale bar, 50 µm). ** indicates p < 0.01, and *** indicates p < 0.001.
Figure 5
Figure 5
RNA-seq and differential gene enrichment analysis results. (A) A volcano plot illustrating the differential gene expression following RNA sequencing in HCT15 cells with stable PAQR3 knockdown compared with the control group. (B) A heat map comparing the expression profiles of differential genes between the PAQR3 knockdown and control groups. (C) KEGG classification diagram summarizing the pathways associated with differential genes that were impacted by PAQR3 knockdown. The red dashed frame indicates the enrichment of the PI3K-AKT signaling pathway. (D) A KEGG bubble plot highlighting the enrichment of differential genes that were affected by PAQR3 knockdown. (E) A GSEA plot demonstrating the biological functions that were influenced by PAQR3 knockdown.
Figure 6
Figure 6
PAQR3 regulates the PI3K-AKT signaling pathway in colon cancer. (A) qRT-PCR analysis of the mRNA expression levels of differential genes associated with the PI3K-AKT signaling pathway in HCT15 cells with stable PAQR3 knockdown compared with the control group. (B) A correlation scatter plot comparing the results of RNA sequencing and qRT-PCR analyses. (C,D) Western blot (WB) analysis showing changes in protein expression levels following the overexpression (C) and knockdown (D) of PAQR3 in HCT15 cells, as depicted in the figure. The original images are shown in Figure S5. * indicates p < 0.05, ** indicates p < 0.01, and *** indicates p < 0.001.

Similar articles

References

    1. Bray F., Laversanne M., Sung H., Ferlay J., Siegel R.L., Soerjomataram I., Jemal A. Global cancer statistics 2022: GLOBOCAN estimates of incidence and mortality worldwide for 36 cancers in 185 countries. CA Cancer J. Clin. 2024;74:229–263. doi: 10.3322/caac.21834. - DOI - PubMed
    1. Singh M., Morris V.K., Bandey I.N., Hong D.S., Kopetz S. Advancements in combining targeted therapy and immunotherapy for colorectal cancer. Trends Cancer. 2024;10:598–609. doi: 10.1016/j.trecan.2024.05.001. - DOI - PubMed
    1. Fabregas J.C., Ramnaraign B., George T.J. Clinical Updates for Colon Cancer Care in 2022. Clin. Colorectal Cancer. 2022;21:198–203. doi: 10.1016/j.clcc.2022.05.006. - DOI - PubMed
    1. Feng L., Xie X., Ding Q., Luo X., He J., Fan F., Liu W., Wang Z., Chen Y. Spatial regulation of Raf kinase signaling by RKTG. Proc. Natl. Acad. Sci. USA. 2007;104:14348–14353. doi: 10.1073/pnas.0701298104. - DOI - PMC - PubMed
    1. Li X., Li M., Chen D., Shi G., Zhao H. PAQR3 inhibits proliferation via suppressing PI3K/AKT signaling pathway in non-small cell lung cancer. Arch. Med. Sci. 2018;14:1289–1297. doi: 10.5114/aoms.2017.72220. - DOI - PMC - PubMed

LinkOut - more resources