. 2025 Jul 5;14(7):819.
doi: 10.3390/biology14070819.

DIRAS1 Drives Oxaliplatin Resistance in Colorectal Cancer via PHB1-Mediated Mitochondrial Homeostasis

Affiliations

DIRAS1 Drives Oxaliplatin Resistance in Colorectal Cancer via PHB1-Mediated Mitochondrial Homeostasis

Min Long et al. Biology (Basel). .

Abstract

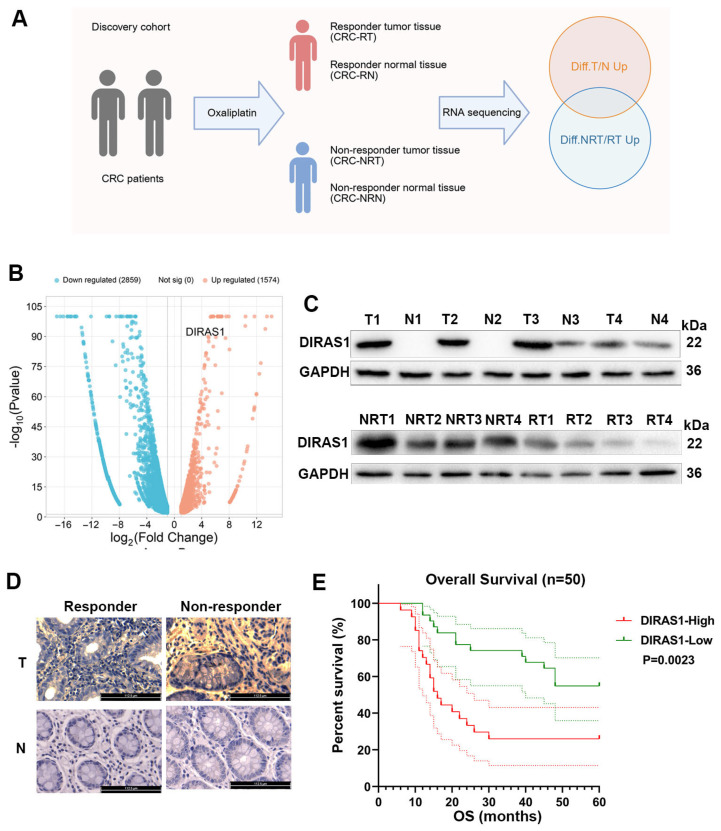
Background: Colorectal cancer (CRC) is a prevalent global malignancy with particularly challenging treatment outcomes in advanced stages. Oxaliplatin (OXA) is a frontline chemotherapeutic agent for CRC. However, 15% to 50% of stage III patients experience recurrence due to drug resistance. Elucidating the molecular mechanisms underlying OXA resistance is, therefore, crucial for improving CRC prognosis. The role of DIRAS1, a RAS superfamily member with reported tumor-suppressive functions in various cancers, remains poorly defined in CRC.

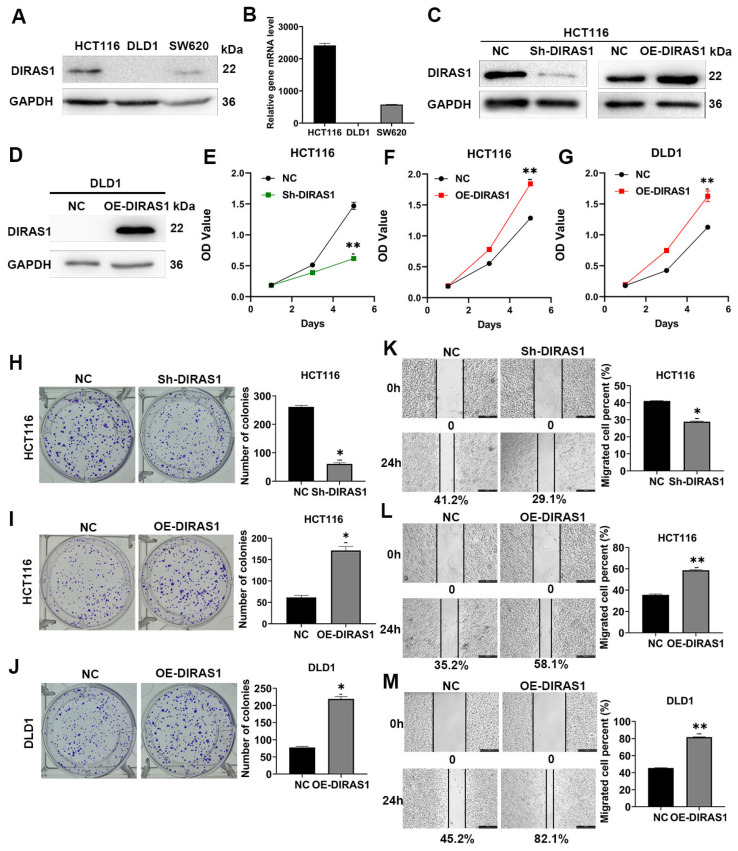
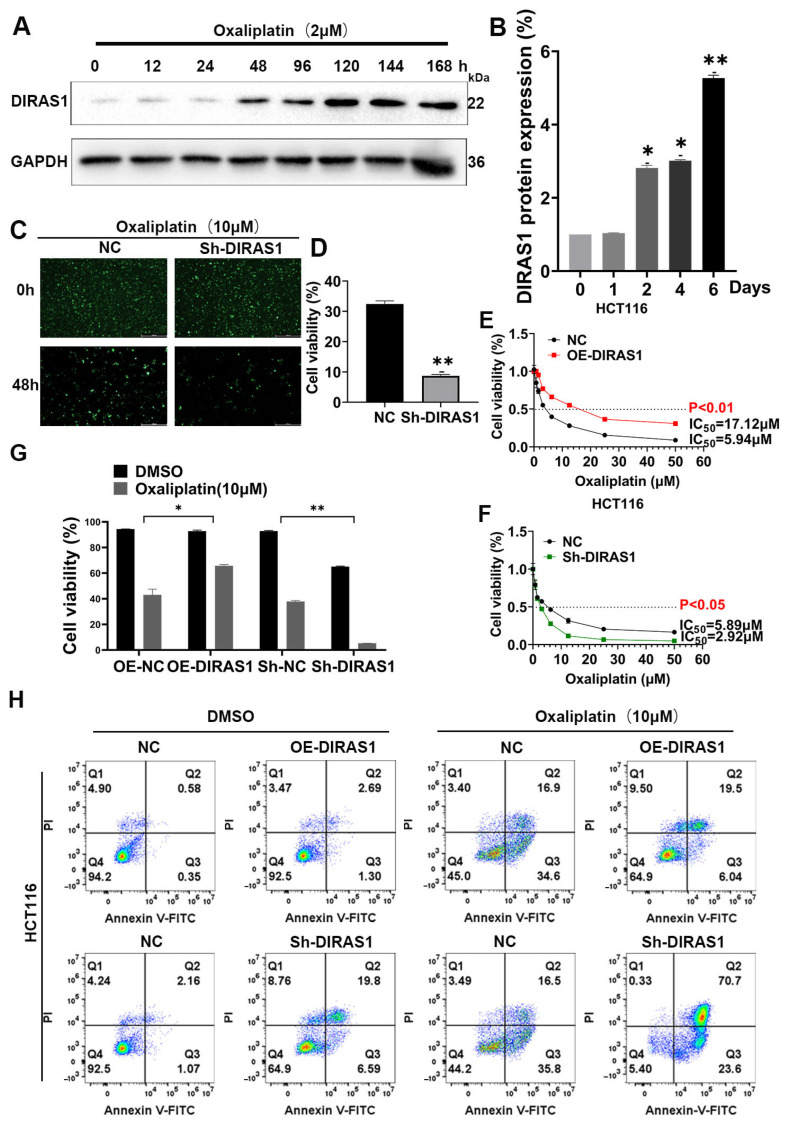
Methods: The effects of DIRAS1 on CRC cell proliferation and migration were evaluated using MTT, wound healing, and colony formation assays. Stable cell lines with knockdown or overexpression of DIRAS1 and PHB1 were established via plasmid and lentiviral systems. Drug sensitivity to OXA was assessed through cytotoxicity assays and IC50 determination. Clinical relevance was validated through immunohistochemical analysis of CRC tissue samples. Transcriptomic sequencing was performed to explore downstream regulatory mechanisms.

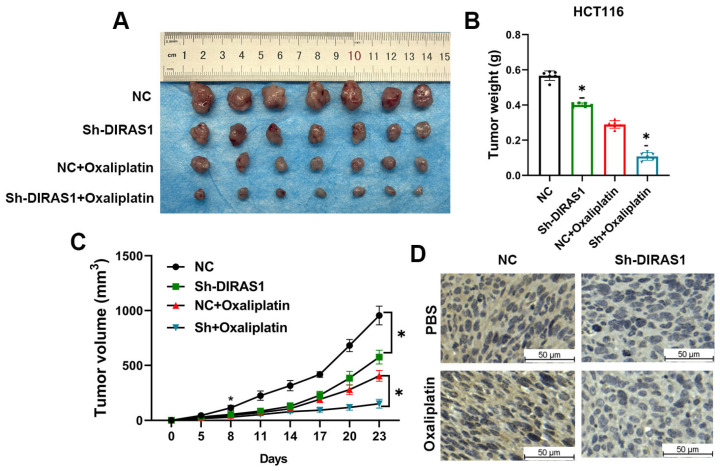
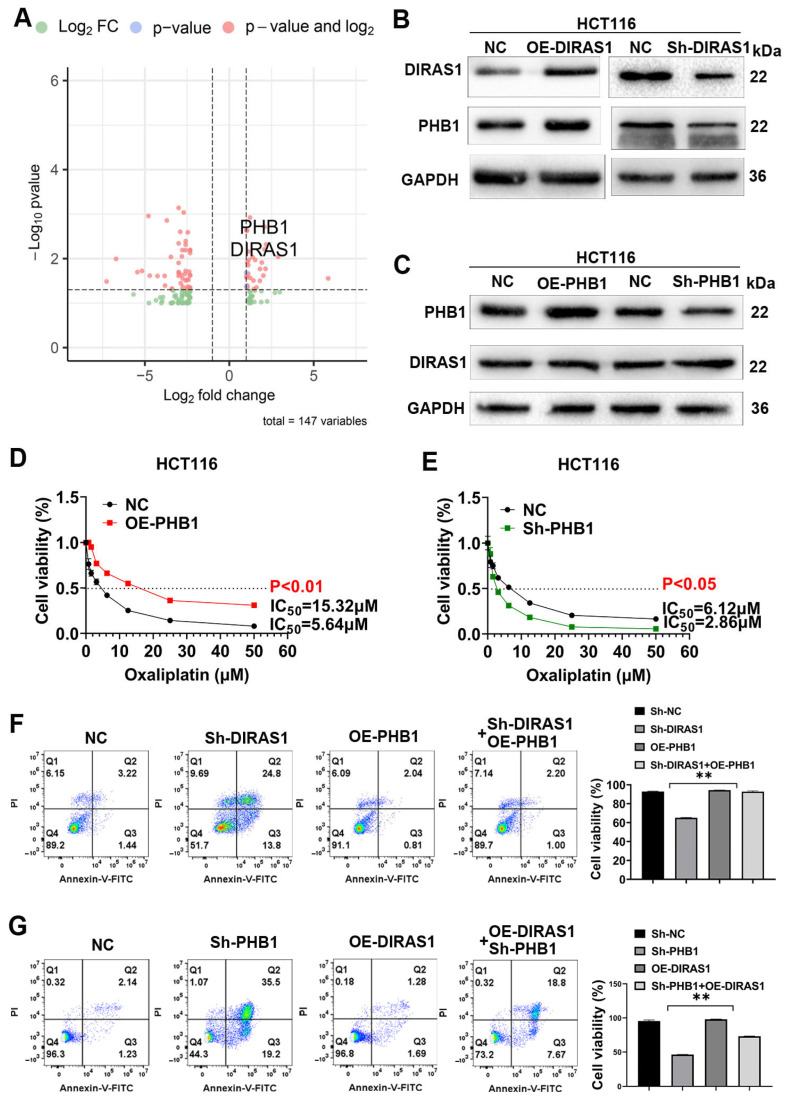
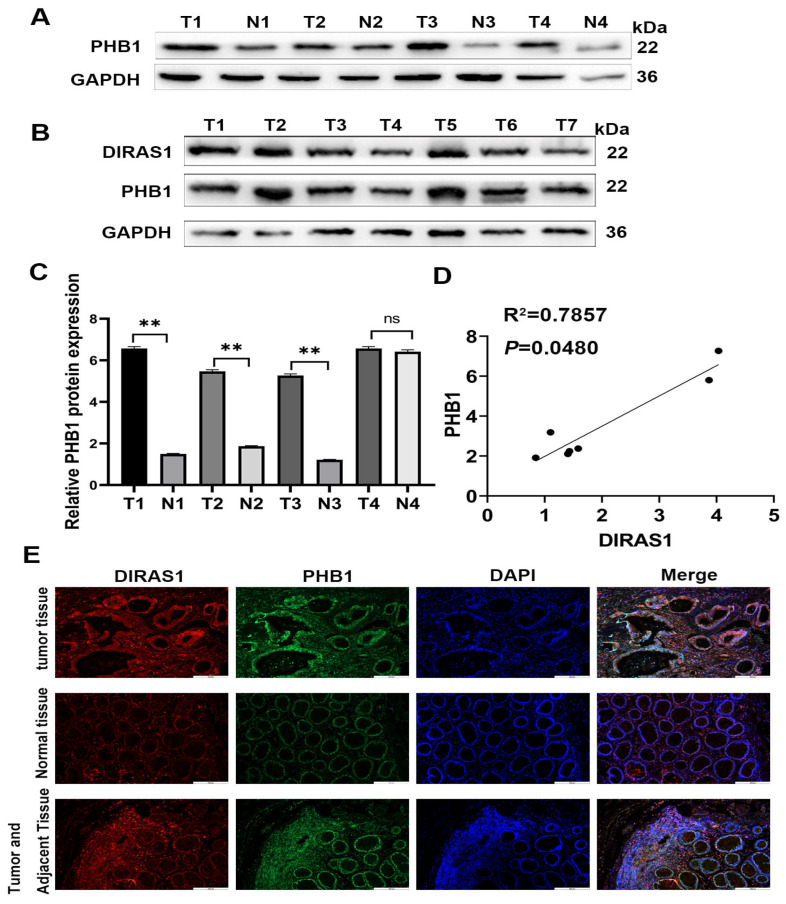
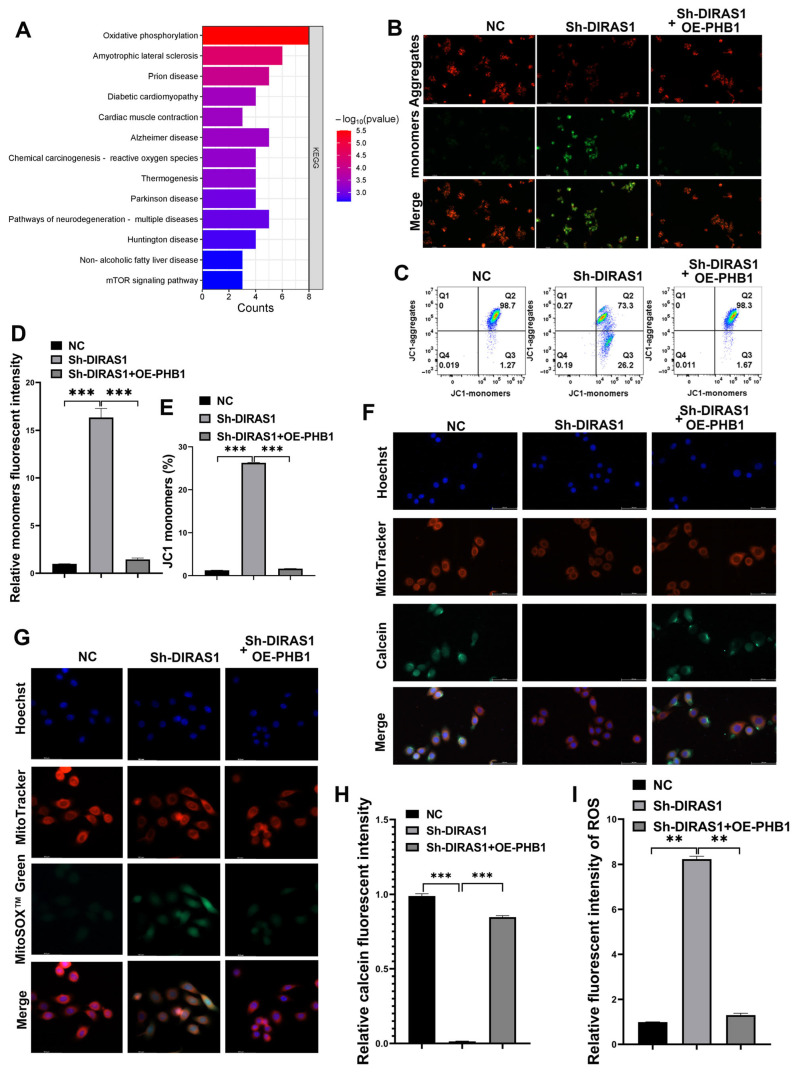
Results: DIRAS1 expression was positively correlated with OXA resistance and was significantly upregulated following prolonged chemotherapy exposure. Silencing DIRAS1 reduced the IC50 of OXA in vitro and increased tumor sensitivity to OXA in vivo. Transcriptome analysis identified PHB1 as a downstream effector of DIRAS1. Functional studies revealed that PHB1 contributes to chemoresistance by maintaining mitochondrial stability.

Conclusions: This study identifies DIRAS1 as a key contributor to OXA resistance in CRC by modulating PHB1 expression and mitochondrial function. Targeting the DIRAS1-PHB1 axis may offer a novel therapeutic strategy to overcome chemoresistance in CRC.

Keywords: DIRAS1; PHB1; colorectal cancer; mitochondrial function; oxaliplatin resistance; targeted therapy.


Conflict of interest statement

The authors declare no conflicts of interest.

Figures

Figure 1
Figure 1
Elevated DIRAS1 expression in clinical CRC samples is associated with oxaliplatin resistance and poor prognosis. (A) Schematic overview of transcriptomic analysis and differential gene expression (DEG) identification. Tumor and matched adjacent normal tissues were collected from 10 CRC patients receiving OXA-based adjuvant chemotherapy. Based on postoperative treatment response, patients were classified as responders (no recurrence/metastasis) or non-responders (recurrence/metastasis), and samples were divided into four groups: responder tumor (RT), responder normal (RN), non-responder tumor (NRT), and non-responder normal (NRN) (n = 5 per group). mRNA was extracted and subjected to high-throughput RNA sequencing. DEGs were identified with thresholds of |log2FC| > 1 and adjusted p < 0.05. Orange circles denote genes upregulated in tumor tissue (RT + NRT) vs. normal tissue (RN + NRN), and blue circles represent genes upregulated in NRT vs. RT. The intersection of these two sets revealed candidate genes associated with OXA resistance. (B) Volcano plot showing DEGs between NRT and RT samples. Genes significantly upregulated in NRT are shown in orange, and those downregulated are in blue (|log2FC| > 1, adjusted p < 0.05). Among the nine most differentially expressed genes (log2FC > 4), DIRAS1 showed the highest upregulation (log2FC = 7.48, indicated). (C) WB analysis of DIRAS1 expression in paired tumor (T) and normal (N) tissues from responder (R) and non-responder (NR) patients (n = 4 per group). GAPDH was used as a loading control. Densitometric quantification (mean ± SEM) indicated significantly higher DIRAS1 protein levels in tumor tissues, particularly in NRT. (unpaired Student’s t-test). (D) IHC staining of DIRAS1 in CRC tissue sections from responder and non-responder patients (n = 50). Representative images and H-score quantification show markedly increased DIRAS1 expression in NRT compared to RT tissues. Scale bar: 112.5 µm. Statistical significance was determined using the Mann–Whitney U test. (E) Kaplan–Meier analysis of overall survival (OS) in 50 CRC patients stratified by DIRAS1 expression levels (high vs. low, based on median IHC H-score). Patients with high DIRAS1 expression had significantly worse OS (log-rank test). Median OS: high DIRAS1 = 15 months; low DIRAS1 = 48 months.
Figure 2
Figure 2
DIRAS1 enhances proliferation and migration in CRC cells. (A) WB analysis of endogenous DIRAS1 protein expression in HCT116, DLD1, and SW620 CRC cell lines. (B) Quantitative analysis of DIRAS1 mRNA expression in HCT116, DLD1, and SW620 cells. Data represent mean ± SD from three independent experiments. (C) Validation of DIRAS1 knockdown and overexpression in HCT116 cells by WB analysis. (D) WB confirmation of DIRAS1 overexpression in DLD1 cells. (EG) MTT assays measuring cell proliferation: (E) DIRAS1 knockdown significantly reduced proliferation in HCT116 cells. (F) DIRAS1 overexpression significantly enhanced proliferation in HCT116 cells. (G) DIRAS1 overexpression significantly enhanced proliferation in DLD1 cells. All data are shown as mean ± SD (n = 3 independent experiments, each in triplicate). Statistical significance was assessed using an unpaired two-tailed Student’s t-test (** p < 0.01). (HJ) Colony formation assays: (H) DIRAS1 knockdown reduced colony formation ability in HCT116 cells (12-day culture). (I) DIRAS1 overexpression increased colony number and size in HCT116 cells (10-day culture). (J) DIRAS1 overexpression enhanced colony formation in DLD1 cells (10-day culture). Representative images and quantification are shown. Data represent mean ± SD (n = 3 independent experiments). Statistical significance: * p < 0.05. (KM) Wound healing assays to assess cell migration: (K) DIRAS1 knockdown significantly impaired migratory capacity of HCT116 cells at 24 h post-scratch. (L) DIRAS1 overexpression significantly enhanced migration in HCT116 cells. (M) DIRAS1 overexpression significantly enhanced migration in DLD1 cells. Representative phase-contrast images at 0 h and 24 h are shown (scale bar = 450 µm), with quantified wound closure rates (mean ± SD, n = 3 independent experiments). Statistical significance: * p < 0.05, ** p < 0.01 by unpaired t-test.
Figure 3
Figure 3
Overexpression of DIRAS1 promotes oxaliplatin resistance in CRC cells in vitro. (A,B) DIRAS1 expression is induced by OXA in a time-dependent manner. (A) WB analysis of DIRAS1 expression in HCT116 cells treated with 2 µM OXA for indicated durations (0–168 h). GAPDH served as a loading control. (B) Quantification of DIRAS1 band intensity normalized to GAPDH (mean ± SD, n = 3 independent experiments) (* p < 0.05, ** p < 0.01). (C,D) Cell viability assessment by GFP fluorescence following OXA exposure. (C) Representative fluorescence microscopy images of GFP-labeled HCT116 cells (control, Sh-DIRAS1, OE-DIRAS1) treated with 2 µM OXA for 48 h. Scale bar: 450 µm. Viable cells display green fluorescence. (D) Quantification of viable GFP-positive cells from (C). Data represent mean ± SD (n = 3 independent experiments). Unpaired two-tailed Student’s t-test (** p < 0.01). (E,F) DIRAS1 modulates OXA sensitivity in CRC cells. (E) MTT assays showing dose–response curves of HCT116 cells (control, Sh-DIRAS1, OE-DIRAS1) treated with increasing concentrations of OXA (0–60 µM) for 24 h. (F) IC50 values calculated from dose–response data (mean ± SD, n = 3). Knockdown of DIRAS1 significantly reduced, while overexpression increased the IC50 for OXA (* p < 0.05, ** p < 0.01; unpaired t-test). (G,H) DIRAS1 influences apoptosis under OXA treatment. (G) Quantification of viable (Annexin V/PI) cells from (H). Data are presented as mean ± SD (n = 3 independent experiments). Statistical significance determined by unpaired t-test (* p < 0.05, ** p < 0.01). (H) Representative flow cytometry plots of Annexin V-FITC/PI dual staining in HCT116 cells (control, Sh-DIRAS1, OE-DIRAS1) treated with 10 µM OXA for 48 h.
Figure 4
Figure 4
DIRAS1 confers oxaliplatin resistance in a CRC xenograft model. (A) Nude mice were subcutaneously injected with HCT116 cells stably expressing either control shRNA or DIRAS1-targeting shRNA (shDIRAS1). Upon tumor establishment (~100 mm3), mice were randomly assigned to receive intravenous OXA (5 mg/kg) or PBS on days 1, 5, and 9 (n = 7 mice/group). Tumor volumes were measured every 3 days. Experimental groups: control (vehicle), control + OXA, ShDIRAS1 (vehicle), ShDIRAS1 + OXA. (B) Final tumor weight at the endpoint. Tumors were harvested and weighed. Data are presented as mean ± SEM (n = 7). OXA treatment significantly reduced tumor weight in control mice (0.58 ± 0.12 g to 0.36 ± 0.08 g, * p < 0.05), and a more pronounced reduction was observed in the ShDIRAS1 group (0.40 ± 0.03 g to 0.10 ± 0.02 g, * p < 0.05 vs. control + OXA). Statistical analysis: two-way ANOVA with Tukey’s post hoc test. (C) Tumor growth kinetics. Tumor volume progression over time was plotted for each group. Data are shown as mean ± SEM (n = 7). Tumor growth was significantly delayed in the ShDIRAS1 + OXA group compared to control + OXA at the experimental endpoint (* p < 0.05; repeated measures two-way ANOVA with Šidák’s post hoc test). (D) Validation of DIRAS1 knockdown by IHC. Representative IHC staining images of DIRAS1 expression in excised tumor tissues from each group. Scale bar: 50 µm. Semi-quantitative H-scoring revealed significantly decreased DIRAS1 expression in ShDIRAS1 tumors compared to controls (* p < 0.05; Mann–Whitney U test, n = 7 tumors/group). Data are shown as mean H-score ± SEM.
Figure 5
Figure 5
PHB1 is a downstream effector of DIRAS1 that mediates oxaliplatin resistance in CRC cells. (A) Transcriptomic identification of DIRAS1-regulated genes. Volcano plot showing DEGs in HCT116 cells overexpressing DIRAS1 (OE-DIRAS1) compared to control, based on high-throughput RNA-seq. Screening criteria: |log2FC| > 1, adjusted p < 0.05. PHB1 (highlighted) was significantly upregulated (log2FC = 2.983, p < 0.05). Upregulated and downregulated genes are shown in red and blue, respectively. (B) DIRAS1 regulates PHB1 protein expression. WB analysis of DIRAS1 and PHB1 protein levels in HCT116 cells following DIRAS1 knockdown (Sh-DIRAS1) or overexpression (OE-DIRAS1). GAPDH was used as a loading control. Densitometric analysis confirmed a positive correlation between DIRAS1 and PHB1 protein levels (mean ± SD, n = 3). (C) PHB1 does not regulate DIRAS1 expression. WB analysis showing DIRAS1 levels in HCT116 cells upon PHB1 knockdown (Sh-PHB1) or overexpression (OE-PHB1) compared to control. GAPDH loading control included. Densitometry revealed no significant change in DIRAS1 levels (p > 0.05, unpaired t-test), indicating unidirectional DIRAS1→PHB1 regulation. (D) PHB1 overexpression promotes OXA resistance. MTT assay showing dose-response curves of OE-PHB1 and control HCT116 cells treated with gradient concentrations of OXA (0–60 µM, 24 h). Calculated IC50: 15.32 µM for OE-PHB1 vs. 5.64 µM for control (p < 0.01, unpaired t-test, n = 3). (E) PHB1 knockdown sensitizes CRC cells to OXA. MTT assay showing enhanced OXA sensitivity in Sh-PHB1 HCT116 cells vs. control. Calculated IC50: 2.86 µM (Sh-PHB1) vs. 6.12 µM (control) (p < 0.05, n = 3, triplicates). Data shown as mean ± SD. (F) PHB1 overexpression rescues DIRAS1 knockdown-induced apoptosis. Flow cytometric analysis of apoptosis in HCT116 cells treated with 10 µM OXA for 48 h. Experimental groups: (1) control; (2) Sh-DIRAS1; (3) OE-PHB1; (4) Sh-DIRAS1 + OE-PHB1. Late apoptotic cells quantified as Annexin V+/PI+ population; viable cells quantified as Annexin V/PI. PHB1 overexpression partially reversed apoptosis induced by DIRAS1 knockdown (** p < 0.01, n = 3). (G) DIRAS1 partially rescues PHB1 knockdown-induced apoptosis. Same experimental design as (F) but with PHB1 knockdown and DIRAS1 overexpression. Groups: (1) control; (2) Sh-PHB1; (3) OE-DIRAS1; (4) Sh-PHB1 + OE-DIRAS1. DIRAS1 overexpression partially restored cell viability in PHB1-silenced cells (** p < 0.01, n = 3).
Figure 6
Figure 6
Correlation of DIRAS1 and PHB1 expression in clinical CRC tissues. (A) PHB1 protein expression in CRC tumor vs. normal tissues. Representative Western blot images showing PHB1 protein levels in paired CRC tumor (T) and adjacent normal (N) tissues (n = 4 pairs). GAPDH served as the loading control. (B) Co-expression analysis of DIRAS1 and PHB1 in CRC tumors. WB analysis of DIRAS1 and PHB1 protein levels in individual CRC tumor tissue lysates (n = 7). GAPDH loading control included. (C) Quantitative analysis of PHB1 expression in paired tissues. Densitometric quantification of PHB1 protein levels from panel (A), normalized to GAPDH. Data are presented as mean ± SEM (n = 4 pairs). Statistical analysis by paired two-tailed Student’s t-test (** p < 0.01, ns: p > 0.05, tumor vs. normal). (D) Positive correlation between DIRAS1 and PHB1 protein levels. Densitometric data from panel (B), normalized to GAPDH, were subjected to Pearson correlation analysis. Linear regression revealed a significant positive correlation between DIRAS1 and PHB1 expression (R2 = 0.7857, p = 0.0480). (E) Co-enrichment of DIRAS1 and PHB1 in CRC tissues by immunofluorescence. Representative confocal microscopy images of CRC tumor (T), adjacent normal (AN), and distal normal (N) tissue sections. DIRAS1 was visualized using a CY3-conjugated secondary antibody (red), PHB1 using a FITC-conjugated secondary antibody (green), and nuclei were stained with DAPI (blue). Scale bar = 225 µm.
Figure 7
Figure 7
DIRAS1 regulates PHB1-mediated mitochondrial homeostasis in CRC cells. (A) KEGG pathway enrichment analysis of DIRAS1-regulated genes. Enrichment analysis of DEGs (|log2FC| > 1.5, p-adj < 0.05) from RNA sequencing of DIRAS1-overexpressing (OE-DIRAS1) vs. control HCT116 cells identified oxidative phosphorylation (OXPHOS) as the top enriched pathway. Dot size reflects gene count; color indicates statistical significance (−log10(p-value)). (B) JC-1 fluorescence microscopy to assess mitochondrial membrane potential (ΔΨm). Representative images of HCT116 cells from the indicated groups (NC, Sh-DIRAS1, Sh-DIRAS1 + OE-PHB1) after JC-1 staining. Red: J-aggregates (intact ΔΨm); green: JC-1 monomers (depolarized ΔΨm). Knockdown of DIRAS1 increased the green signal, indicating ΔΨm loss, which was partially rescued by PHB1 overexpression. Scale bar: 112.5 µm. (C) Flow cytometric analysis of JC-1 staining. Quantification of mitochondrial membrane potential by JC-1 dual-emission ratio in different treatment groups. (D) Quantification of JC-1 monomer signal by fluorescence microscopy. Green fluorescence intensity was measured from (B) using ImageJ V1.8.0.112. Data represent mean ± SEM (n = 9 fields/group from 3 experiments). One-way ANOVA with Tukey’s post hoc test: *** p < 0.001. (E) Quantification of JC-1 monomer-positive cells by flow cytometry. Percentage of cells with low ΔΨm (green fluorescence). Data: mean ± SEM (n = 3). Statistical analysis by unpaired two-tailed Student’s t-test: *** p < 0.001. (F) Assessment of mitochondrial permeability transition pore (mPTP) opening. Representative images of Calcein-AM-labeled HCT116 cells treated with cobalt chloride (quenching cytosolic fluorescence). Increased green fluorescence in the Sh-DIRAS1 group indicates enhanced mPTP opening, which was mitigated by OE-PHB1. Scale bar: 56.3 µm. (G) Measurement of mitochondrial reactive oxygen species (mtROS). Representative images showing MitoSOX Red fluorescence (mtROS) in indicated groups. DAPI: nuclear staining. Sh-DIRAS1 cells exhibited increased mtROS, reduced by PHB1 overexpression. Scale bar: 56.3 µm. (H) Quantification of mtROS intensity. MitoSOX Red signal from panel (G) was analyzed using ImageJ V1.8.0.112. Data are presented as mean ± SEM (n = 9 fields/group from 3 experiments). One-way ANOVA, Tukey’s test: *** p < 0.001. (I) Quantification of Calcein-AM fluorescence. Green fluorescence intensity (inversely reflecting mPTP opening) from panel (F) was quantified using ImageJ V1.8.0.112. Data: mean ± SEM (n = 9 fields/group from 3 experiments). One-way ANOVA, Tukey’s test: ** p < 0.01.

Similar articles

References

    1. Bray F., Laversanne M., Sung H., Ferlay J., Siegel R.L., Soerjomataram I., Jemal A. Global cancer statistics 2022: GLOBOCAN estimates of incidence and mortality worldwide for 36 cancers in 185 countries. CA Cancer J. Clin. 2024;74:229–263. doi: 10.3322/caac.21834. - DOI - PubMed
    1. Abedizadeh R., Majidi F., Khorasani H.R., Abedi H., Sabour D. Colorectal cancer: A comprehensive review of carcinogenesis, diagnosis, and novel strategies for classified treatments. Cancer Metastasis Rev. 2024;43:729–753. doi: 10.1007/s10555-023-10158-3. - DOI - PubMed
    1. Yang L., Zou S., Shu C., Song Y., Sun Y.K., Zhang W., Zhou A., Yuan X., Yang Y., Hu S. CYP2A6 Polymorphisms Associate with Outcomes of S-1 Plus Oxaliplatin Chemotherapy in Chinese Gastric Cancer Patients. Genom. Proteom. Bioinform. 2017;15:255–262. doi: 10.1016/j.gpb.2016.11.004. - DOI - PMC - PubMed
    1. Zhou H., Wang H., Yu M., Schugar R.C., Qian W., Tang F., Liu W., Yang H., McDowell R.E., Zhao J., et al. IL-1 induces mitochondrial translocation of IRAK2 to suppress oxidative metabolism in adipocytes. Nat. Immunol. 2020;21:1219–1231. doi: 10.1038/s41590-020-0750-1. - DOI - PMC - PubMed
    1. Wang X., Xu Z., Wang J., Wu C., Zhang L., Qian C., Luo Y., Gu Y., Wong W.T., Xiang D. A Mitochondria-Targeted Biomimetic Nanomedicine Capable of Reversing Drug Resistance in Colorectal Cancer Through Mitochondrial Dysfunction. Adv. Sci. 2025;12:e2410630. doi: 10.1002/advs.202410630. - DOI - PMC - PubMed

LinkOut - more resources