

Characterizing the Fermentation of Oat Grass (Avena sativa L.) in the Rumen: Integrating Degradation Kinetics, Ultrastructural Examination with Scanning Electron Microscopy, Surface Enzymatic Activity, and Microbial Community Analysis
- PMID: 40723511
- PMCID: PMC12291719
- DOI: 10.3390/ani15142049
Characterizing the Fermentation of Oat Grass (Avena sativa L.) in the Rumen: Integrating Degradation Kinetics, Ultrastructural Examination with Scanning Electron Microscopy, Surface Enzymatic Activity, and Microbial Community Analysis
Abstract
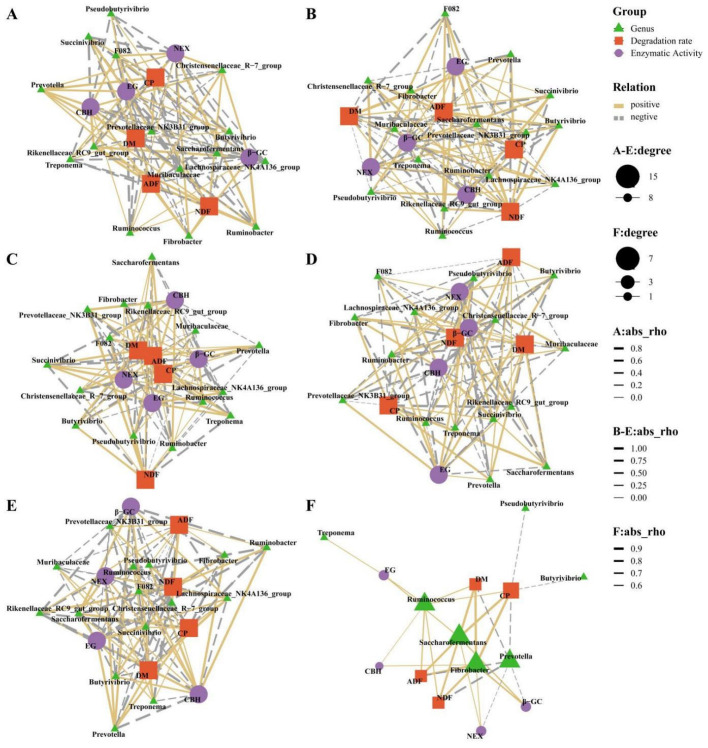
The objective of this study is to investigate the degradation characteristics of oat grass in the rumen of Mindong goats and changes in microbial community attached to the grass surface. Four healthy male goats, aged 14 months, with permanent rumen fistula, in eastern Fujian, were selected as experimental animals. The rumen degradation rate of oat grass was measured at 4, 12, 24, 36, 48, and 72 h using the nylon bag method. Surface physical structure changes in oat grass were observed using scanning electron microscopy (SEM), cellulase activity was measured, and bacterial composition was analyzed using high-throughput 16S rRNA gene sequencing technology. The findings of this study indicate that oat grass had effective degradation rates (ED) of 47.94%, 48.69%, 38.41%, and 30.24% for dry matter (DM), crude protein (CP), neutral detergent fiber (NDF), and acidic detergent fiber (ADF), respectively. The SEM was used to investigate the degradation process of oat grass in the rumen. After 24 h, extensive degradation of non-lignified tissue was observed, resulting in the formation of cavities. At 36 h, significant shedding was observed, and by 72 h, only the epidermis and thick-walled tissue, which exhibited resistance to degradation, remained intact. Surface-attached microorganisms produced β-GC, EG, CBH, and NEX enzymes. The activity of these enzymes exhibited a significant increase between 4 and 12 h and showed a positive correlation with the degradation rate of nutrients. However, the extent of correlation varied. Prevotella and Treponema were identified as key genera involved in the degradation of roughage, with their abundance decreasing over time. Principle Coordinate Analysis (PCOA) revealed no significant differences in the rumen microbial structure across different time points. However, Non-Metric Multidimensional Scaling (NMDS) indicated a discernible diversity order among the samples. According to the Spearman correlation coefficient test, Ruminococcus, Fibrobacter, and Saccharoferments exhibited the closest relationship with nutrient degradation rate and surface enzyme activity, displaying a significant positive correlation. In summary, this study delineates a time-resolved correlative framework linking microbial succession to structural and enzymatic dynamics during oat grass degradation.
Keywords: Avena sativa L.; cellulase; electron microscopy scanning; rumen degradation rate; rumen microbiota.
Conflict of interest statement
The authors declare no conflicts of interest.
Figures


Similar articles
-
Effects of a Bacillus-based direct-fed microbial on digestibility, ruminal in situ nutrient disappearance, microbiome, and fermentation parameters in forage-fed beef cattle.J Anim Sci. 2025 Jan 4;103:skaf093. doi: 10.1093/jas/skaf093. J Anim Sci. 2025. PMID: 40139973
-
Effect of multispecies fungal extract supplementation on growth performance, nutrient digestibility, ruminal fermentation, and the rumen microbiome composition of beef cattle fed forage-based diets.J Anim Sci. 2025 Jan 4;103:skae387. doi: 10.1093/jas/skae387. J Anim Sci. 2025. PMID: 39718972
-
Chestnut tannins impair ruminal fiber degradation through modulation of cellulolytic bacterial activity in sheep: an in vivo and in vitro investigation.J Anim Sci. 2025 Jan 4;103:skaf189. doi: 10.1093/jas/skaf189. J Anim Sci. 2025. PMID: 40457894
-
Intravenous magnesium sulphate and sotalol for prevention of atrial fibrillation after coronary artery bypass surgery: a systematic review and economic evaluation.Health Technol Assess. 2008 Jun;12(28):iii-iv, ix-95. doi: 10.3310/hta12280. Health Technol Assess. 2008. PMID: 18547499
-
Community wide interventions for increasing physical activity.Cochrane Database Syst Rev. 2015 Jan 5;1(1):CD008366. doi: 10.1002/14651858.CD008366.pub3. Cochrane Database Syst Rev. 2015. PMID: 25556970 Free PMC article.
References
-
- Zheng M., Li R., Wang Y., Cui X., Niu D., Yang F., Xu C. Ensiling with rumen fluid promoted Irpex lacteus colonization on the non-sterile naked oat straw for enhanced lignocellulose degradation and enzymatic hydrolysis. Biochem. Eng. J. 2022;183:108462. doi: 10.1016/j.bej.2022.108462. - DOI
-
- Wang Y.L., Wang W.K., Wu Q.C., Zhang F., Li W.J., Li S.L., Wang W., Cao Z.J., Yang H.J. In Situ Rumen Degradation Characteristics and Bacterial Colonization of Corn Silages Differing in Ferulic and p-Coumaric Acid Contents. Microorganisms. 2022;10:2269. doi: 10.3390/microorganisms10112269. - DOI - PMC - PubMed
Grants and funding
- 2023S0007, 2023S0015, 2023S0054; 2023I1009/Fujian Provincial Science and Technology Plan project (University Industry University Cooperation Project
- 11899170139/Fujian Agriculture and Forestry University Rural Revitalization Service Team - Herbivorous Animal Industry Service Team
- CXZX2020057A/Science and Technology Innovation Special Fund of Fujian Agriculture and Forestry University
LinkOut - more resources
Full Text Sources
Research Materials
Miscellaneous
