. 2025 Jul 15;15(7):1019.
doi: 10.3390/biom15071019.

Targeting Sodium Transport Reveals CHP1 Downregulation as a Novel Molecular Feature of Malignant Progression in Clear Cell Renal Cell Carcinoma: Insights from Integrated Multi-Omics Analyses

Affiliations

Targeting Sodium Transport Reveals CHP1 Downregulation as a Novel Molecular Feature of Malignant Progression in Clear Cell Renal Cell Carcinoma: Insights from Integrated Multi-Omics Analyses

Yun Wu et al. Biomolecules. .

Abstract

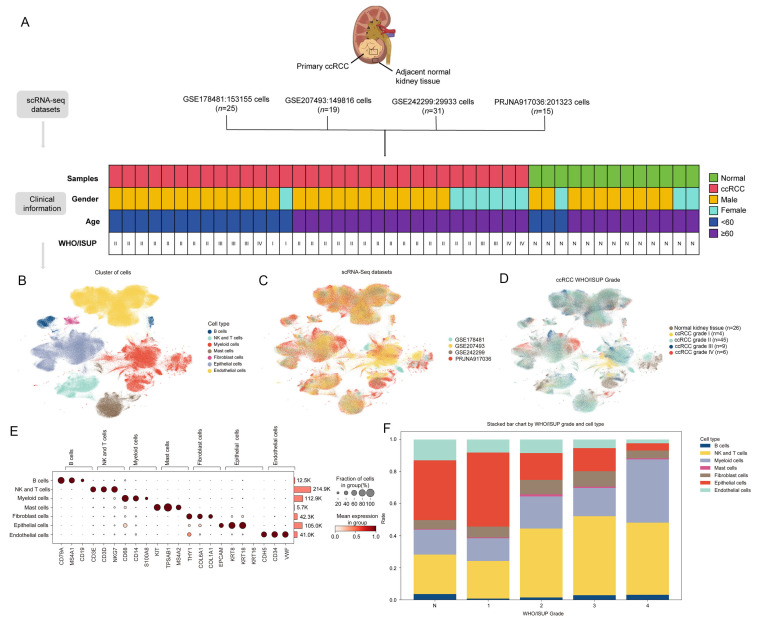
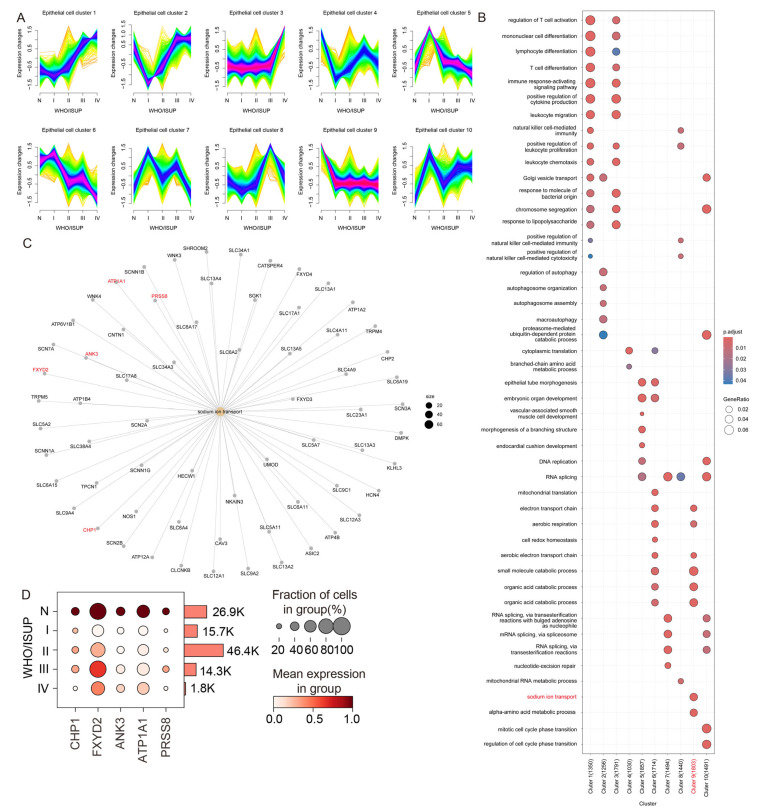
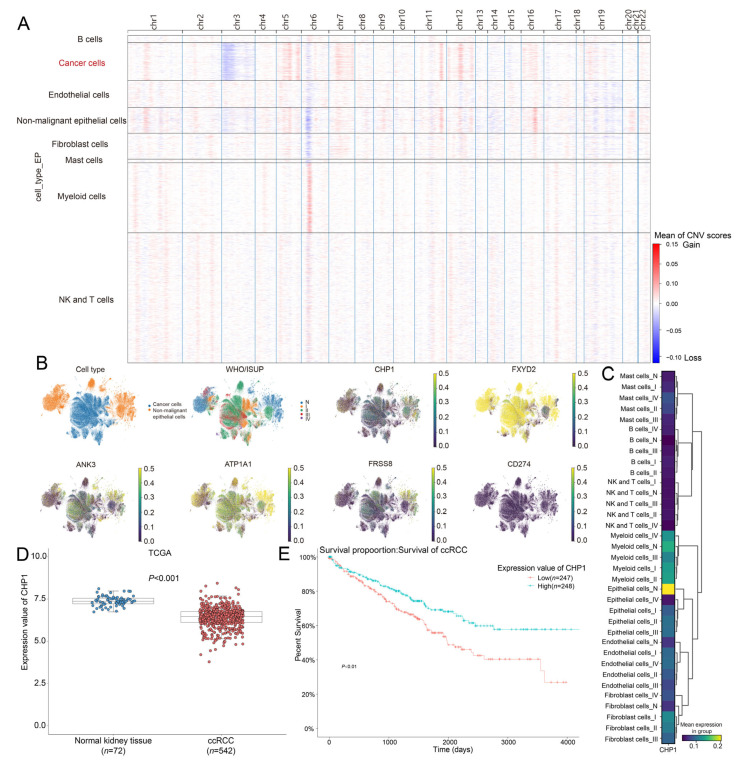
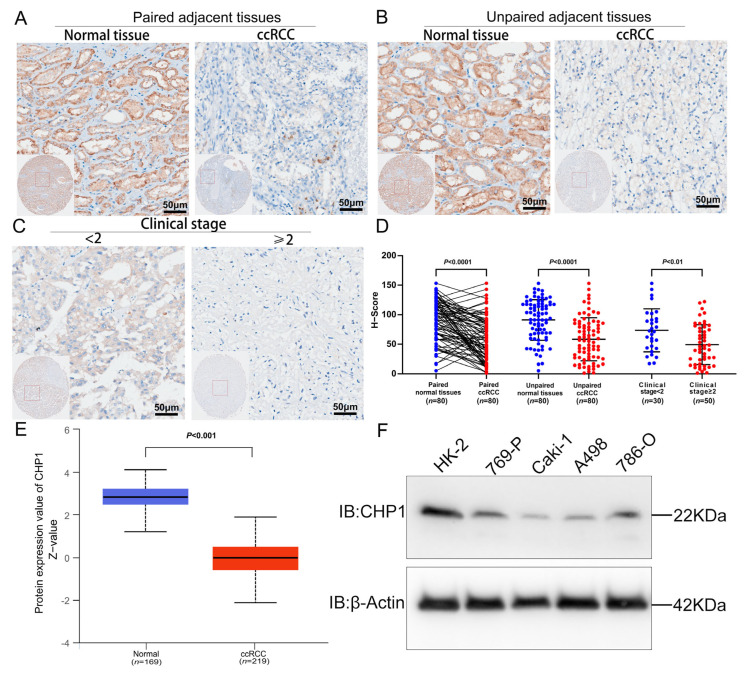
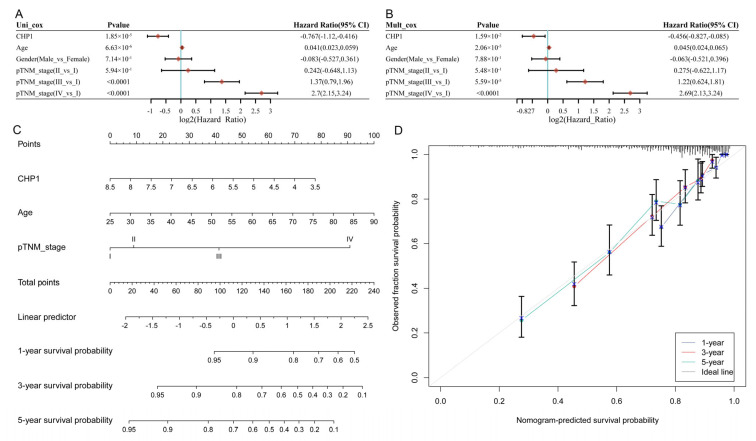
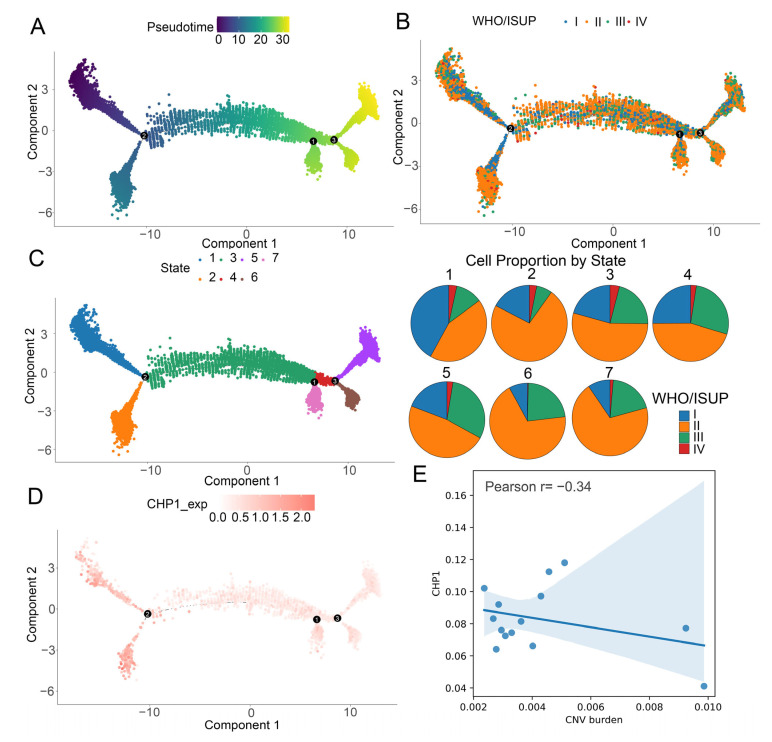
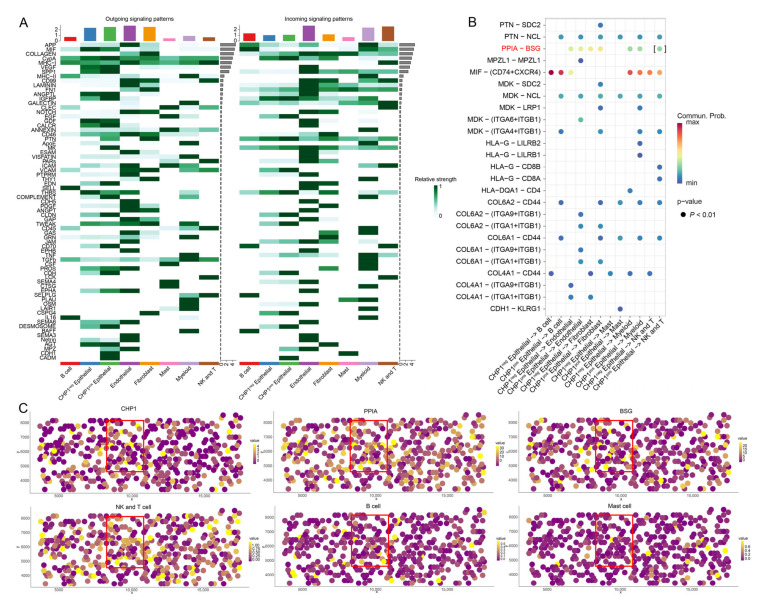
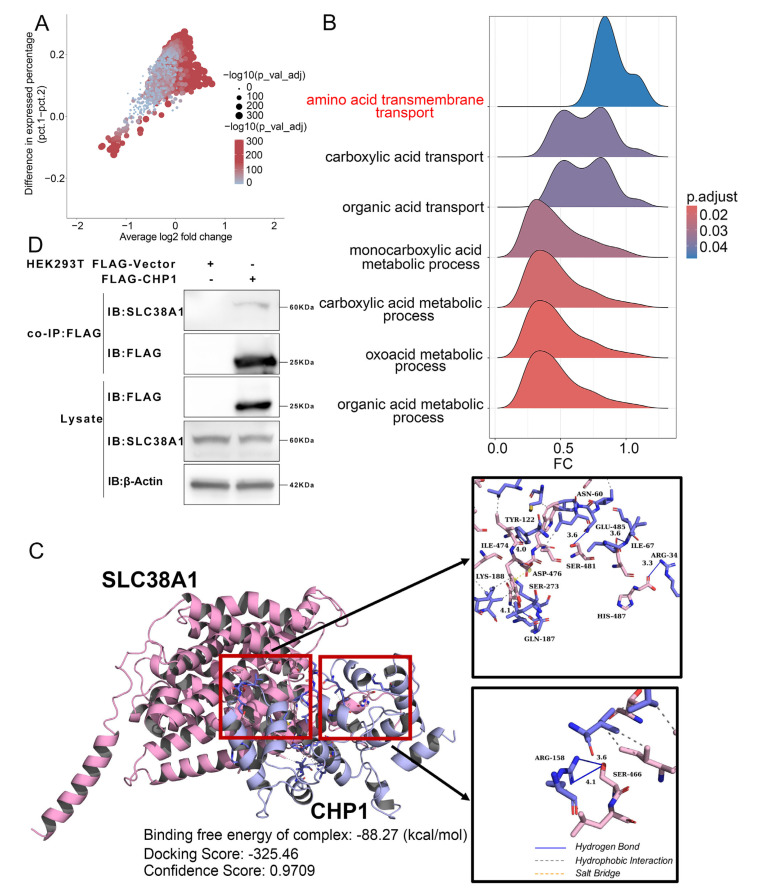
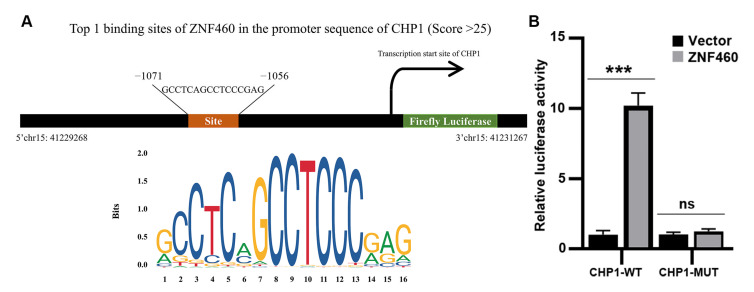
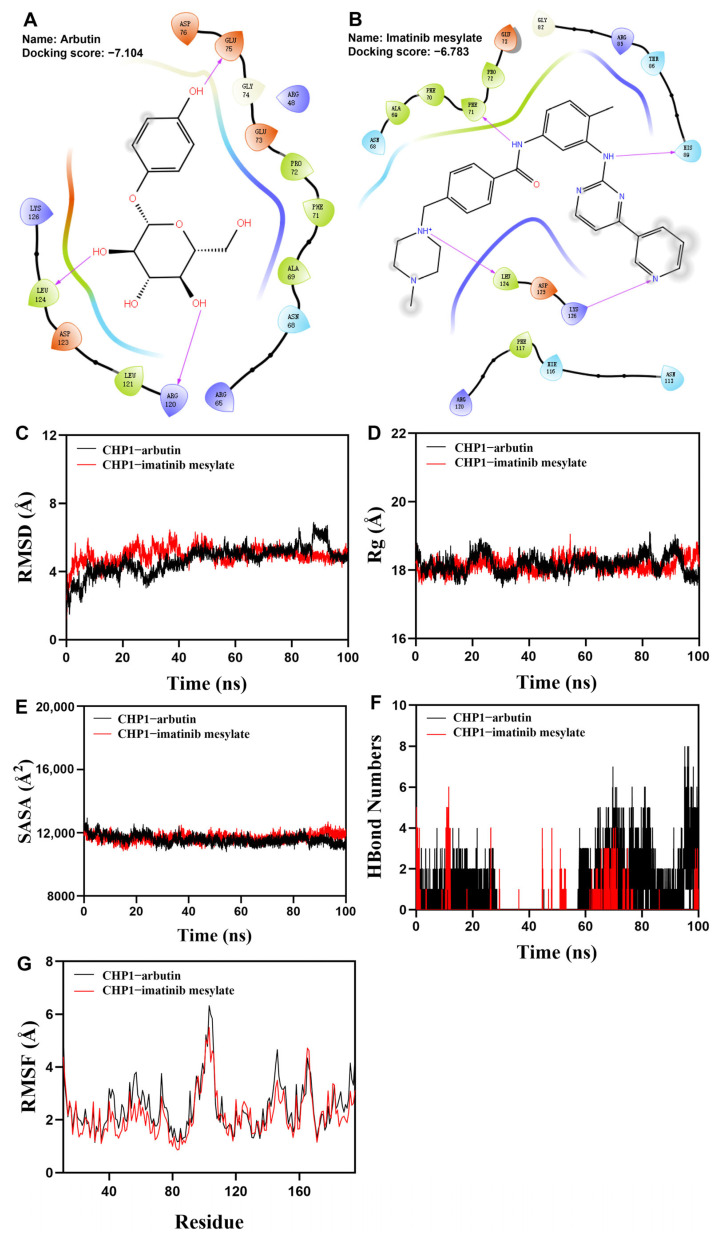
Clear cell renal cell carcinoma (ccRCC), the most common RCC subtype, displays significant intratumoral heterogeneity driven by metabolic reprogramming, which complicates our understanding of disease progression and limits treatment efficacy. This study aimed to construct a comprehensive cellular and transcriptional landscape of ccRCC, with emphasis on gene expression dynamics during malignant progression. An integrated analysis of 90 scRNA-seq samples comprising 534,227 cells revealed a progressive downregulation of sodium ion transport-related genes, particularly CHP1 (calcineurin B homologous protein isoform 1), which is predominantly expressed in epithelial cells. Reduced CHP1 expression was confirmed at both mRNA and protein levels using bulk RNA-seq, CPTAC proteomics, immunohistochemistry, and ccRCC cell lines. Survival analysis showed that high CHP1 expression correlated with improved prognosis. Functional analyses, including pseudotime trajectory, Mfuzz clustering, and cell-cell communication modeling, indicated that CHP1+ epithelial cells engage in immune interaction via PPIA-BSG signaling. Transcriptomic profiling and molecular docking suggested that CHP1 modulates amino acid transport through SLC38A1. ZNF460 was identified as a potential transcription factor of CHP1. Virtual screening identified arbutin and imatinib mesylate as candidate CHP1-targeting compounds. These findings establish CHP1 downregulation as a novel molecular feature of ccRCC progression and support its utility as a prognostic biomarker.

Keywords: calcineurin B homologous protein isoform 1; clear cell renal cell carcinoma; prognostic biomarker; single-cell RNA sequencing; sodium transport; tumor microenvironment.


Conflict of interest statement

The authors declare no conflicts of interest.

Figures

Figure 1
Figure 1
scRNA-seq data collection and identification of cellular subpopulations. (A) Overview of the clinical metadata from four integrated scRNA-seq datasets. The flowchart summarizes the number of cells and samples in each dataset, as well as combined statistics including gender, age, and WHO/ISUP grade distribution. (B) UMAP projection of 534,227 cells from 64 primary tumor and 26 adjacent normal kidney tissue samples. Each dot represents one cell, and different colors indicate distinct cell subpopulations. (C) UMAP plot showing the origin of cells based on the source dataset (GSE178481, GSE207493, GSE242299, or PRJNA917036). Each dataset is represented by a unique color. (D) UMAP plot illustrating the distribution of cells by tumor WHO/ISUP grade, including both adjacent normal and primary tumor tissues. Each cell is colored according to its associated grade. (E) Dot plot displaying the expression patterns of the top three marker genes for each of the seven cell types. The cell counts per type are shown on the right. (F) Bar plot summarizing the relative abundance of each cell type across WHO/ISUP grades. Each bar is segmented by color to represent different cell subpopulations.
Figure 2
Figure 2
Gene expression profiling of epithelial subpopulations during malignant progression in ccRCC. (A) Mfuzz clustering of epithelial cell gene expression across WHO/ISUP tumor grades reveals ten distinct expression patterns. Each curve represents the temporal trend of an individual gene. (B) GO enrichment analysis of gene clusters identified by Mfuzz. (C) Network diagram of genes involved in the “sodium ion transport” pathway. Red-labeled genes are expressed in more than 10% of epithelial cells, highlighting them as potential key regulators. (D) Dot plot showing the expression levels of five representative sodium ion transport-related genes (CHP1, FXYD2, ANK3, ATP1A1, and PRSS8) across WHO/ISUP grades. The dot color indicates average gene expression, and the cell counts for each grade are summarized on the right.
Figure 3
Figure 3
Downregulation of sodium ion transport-related genes in malignant tumor cells and prognostic significance of CHP1 in ccRCC. (A) CNV analysis comparing primary ccRCC and adjacent normal kidney tissues. CNV scores are color-coded by chromosome, with red indicating DNA gains and blue indicating DNA losses. (B) UMAP projections displaying the distribution of malignant versus non-malignant epithelial cells, WHO/ISUP tumor grades, and the expression of five sodium ion transport-related genes (CHP1, FXYD2, ANK3, ATP1A1, PRSS8) and the immune checkpoint marker CD274. The gene expression values have been normalized based on transcript count. (C) Heatmap of CHP1 expression across different cell types and tumor grades. The color intensity reflects the average expression level. (D) Box plot comparing CHP1 expression between adjacent normal kidney tissues (n = 72) and ccRCC tissues (n = 542) in the TCGA-KIRC cohort. Expression values are presented as log2 (TPM + 1); individual dots represent samples. Blue and red dots denote normal and tumor tissues, respectively. (E) KM survival curve of OS in the TCGA-KIRC cohort, stratified by CHP1 expression level. Red and green lines represent CHP1-Low and CHP1-High groups, respectively.
Figure 4
Figure 4
Reduced CHP1 protein expression in ccRCC tissues and cell lines. (A) IHC staining showing CHP1 protein expression in matched ccRCC and adjacent normal kidney tissues. (B) IHC staining comparing CHP1 protein levels in unmatched ccRCC and adjacent normal tissues. (C) IHC results stratified by clinical stage, illustrating CHP1 expression in ccRCC tissues with stages < 2 and ≥2. Scale bar = 50 μm (magnified images). (D) Quantitative analysis of IHC H-scores in 80 matched ccRCC and adjacent kidney tissue pairs. Each dot represents an individual sample. (E) CHP1 protein expression levels in the CPTAC dataset, comparing between ccRCC and adjacent normal kidney tissues using the Wilcoxon rank-sum test. Blue and red indicate adjacent kidney and ccRCC tissues, respectively. (F) Western blot analysis of CHP1 protein levels in 769-P, A498, Caki-1, and 786-O cells relative to HK-2 cells. The original Western blot images can be found in the Supplementary Materials.
Figure 5
Figure 5
Association between CHP1 expression, clinicopathological features, and OS in ccRCC. (A) Forest plot of univariate Cox regression analysis in the TCGA-KIRC cohort, showing the hazard ratios (HRs) and p-values for CHP1 expression and clinical variables. (B) Forest plot of multivariate Cox regression analysis displaying the HRs and p-values for the independent variables—CHP1 expression, age, and TNM stage. (C) Prognostic nomogram constructed using CHP1 expression, age, and pathological TNM stage to estimate the 1-, 3-, and 5-year OS probabilities in ccRCC patients. (D) Calibration curves comparing predicted versus observed OS probabilities at 1, 3, and 5 years, demonstrating the predictive accuracy of the nomogram.
Figure 6
Figure 6
Gradual decrease in CHP1 expression along the developmental trajectory of tumor cells. (A) Pseudotime trajectory of ccRCC tumor cells inferred using Monocle2. Each dot represents a single cell, colored according to pseudotime progression. Numbers in black circles indicate branch points along the trajectory. (B) Distribution of WHO/ISUP tumor grades mapped onto the pseudotime trajectory. Each dot represents a single cell, with different colors corresponding to different WHO/ISUP grades. (C) Cell group classification along the developmental trajectory. Left: cell stages are colored according to group identity; right: corresponding pie charts displaying the proportion of cells for each WHO/ISUP grade. (D) Expression dynamics of CHP1 along the pseudotime trajectory. Each dot represents a single cell, with the color intensity reflecting the expression level of CHP1. (E) The relationship between CNV burden and CHP1 expression.
Figure 7
Figure 7
Impact of CHP1 expression on cell–cell communication in the ccRCC tumor microenvironment. (A) Heatmap showing the strength of outgoing and incoming signaling interactions among seven cell populations. Variation in color intensity represents communication probability. The top bar plot summarizes the total incoming and outgoing signal strengths for each cell population, while the right bar plot indicates the overall contribution of each signaling pathway. (B) Dot plot depicting ligand-derived signals from CHP1neg and CHP1pos tumor cells to six other cell types. Dot color represents communication probability, and dot size reflects statistical significance (p < 0.01). (C) Spatial co-localization analysis using the MISTy framework for three genes (CHP1, peptidylprolyl isomerase A (PPIA), basigin (BSG)) and three cell populations (NK and T cells, B cells, macrophages). Each dot represents a spatial location within the tissue. Red boxes highlight regions where gene expression and cell populations are co-localized. Axes denote spatial coordinates; gene values indicate expression levels, and cell-type values represent spatial deconvolution scores derived from integrated scRNA-seq data.
Figure 8
Figure 8
CHP1 expression influences amino acid transport in tumor cells. (A) Differential expression analysis comparing CHP1neg and CHP1pos tumor cells. Each dot represents an individual gene. (B) GSEA of DEGs between CHP1neg and CHP1pos tumor cells. The colors in the ridge plot correspond to adjusted p-values for pathway enrichment. (C) Structural visualization of the predicted protein–protein interaction between CHP1 and SLC38A1 using PyMOL. The lower left panel summarizes binding free energy (MM/GBSA), docking score, and confidence score. The right panel shows the predicted non-covalent interactions based on PLIP analysis. Color scheme: SLC38A1 (purple), CHP1 (blue); hydrogen bonds (blue solid lines), hydrophobic interactions (gray dashed lines), and salt bridges (yellow dashed lines). (D) CHP1 interacts with SLC38A1. Lysates of HEK-293T cells transfected with FLAG-tagged CHP1 were subjected to immunoprecipitation with anti-FLAG antibody, followed by immunoblotting with anti-FLAG and anti-SLC38A1 antibodies, respectively. The original Western blot images can be found in the Supplementary Materials.
Figure 9
Figure 9
(A) The JASPAR database predicted a putative ZNF460 binding site within the CHP1 promoter region. (B) Luciferase reporter assay confirmed the direct binding of ZNF460 to the CHP1 promoter. (Data are presented as the mean ± SD, *** p < 0.001 and ns, no significance).
Figure 10
Figure 10
Molecular docking analysis of FDA-approved compounds with the CHP1 protein. (A) Predicted binding mode of arbutin with CHP1. (B) Predicted binding mode of imatinib mesylate with CHP1. Top left: docking score; center: chemical structure. Color coding: orange = negative charge; purple = positive charge; white = glycine; green = hydrophobic region; blue = polar region. Interaction types: purple solid lines = hydrogen bonds; blue–red solid lines = salt bridges; red lines = π–cation interactions. (C) Root-mean-square deviation (RMSD) analysis, (D) Radius of gyration (Rg) analysis, (E) Solvent-accessible surface area (SASA) analysis, (F) Hydrogen bond analysis, (G) Root mean square fluctuation (RMSF) analysis of CHP1–arbutin and CHP1–imatinib mesylate.

Similar articles

References

    1. Chen S., Cao Z., Prettner K., Kuhn M., Yang J., Jiao L., Wang Z., Li W., Geldsetzer P., Barnighausen T., et al. Estimates and Projections of the Global Economic Cost of 29 Cancers in 204 Countries and Territories From 2020 to 2050. JAMA Oncol. 2023;9:465–472. doi: 10.1001/jamaoncol.2022.7826. - DOI - PMC - PubMed
    1. Siegel R.L., Giaquinto A.N., Jemal A. Cancer statistics, 2024. CA Cancer J. Clin. 2024;74:12–49. doi: 10.3322/caac.21820. - DOI - PubMed
    1. Lindgren D., Eriksson P., Krawczyk K., Nilsson H., Hansson J., Veerla S., Sjolund J., Hoglund M., Johansson M.E., Axelson H. Cell-Type-Specific Gene Programs of the Normal Human Nephron Define Kidney Cancer Subtypes. Cell Rep. 2017;20:1476–1489. doi: 10.1016/j.celrep.2017.07.043. - DOI - PubMed
    1. Moch H., Amin M.B., Berney D.M., Comperat E.M., Gill A.J., Hartmann A., Menon S., Raspollini M.R., Rubin M.A., Srigley J.R., et al. The 2022 World Health Organization Classification of Tumours of the Urinary System and Male Genital Organs-Part A: Renal, Penile, and Testicular Tumours. Eur. Urol. 2022;82:458–468. doi: 10.1016/j.eururo.2022.06.016. - DOI - PubMed
    1. Jonasch E., Walker C.L., Rathmell W.K. Clear cell renal cell carcinoma ontogeny and mechanisms of lethality. Nat. Rev. Nephrol. 2021;17:245–261. doi: 10.1038/s41581-020-00359-2. - DOI - PMC - PubMed

MeSH terms

LinkOut - more resources