. 2025 Jul 17;15(7):1033.
doi: 10.3390/biom15071033.

Electrophysiological Characterization of Sex-Dependent Hypnosis by an Endogenous Neuroactive Steroid Epipregnanolone

Affiliations

Electrophysiological Characterization of Sex-Dependent Hypnosis by an Endogenous Neuroactive Steroid Epipregnanolone

Tamara Timic Stamenic et al. Biomolecules. .

Abstract

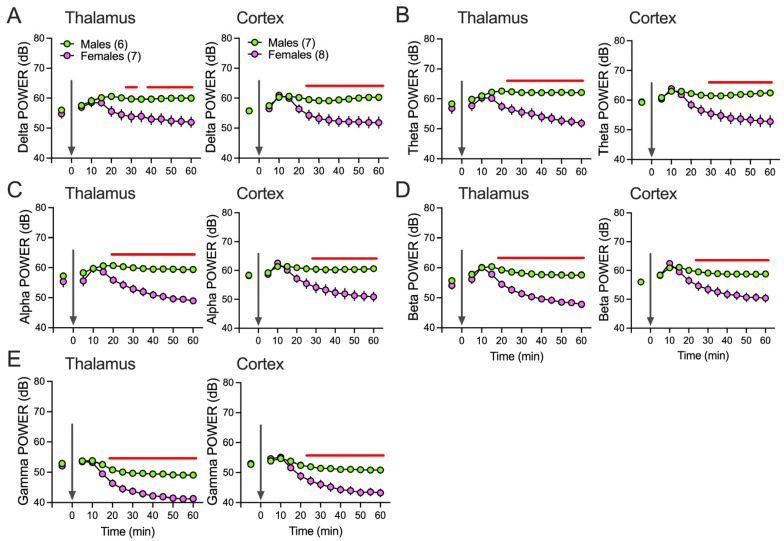
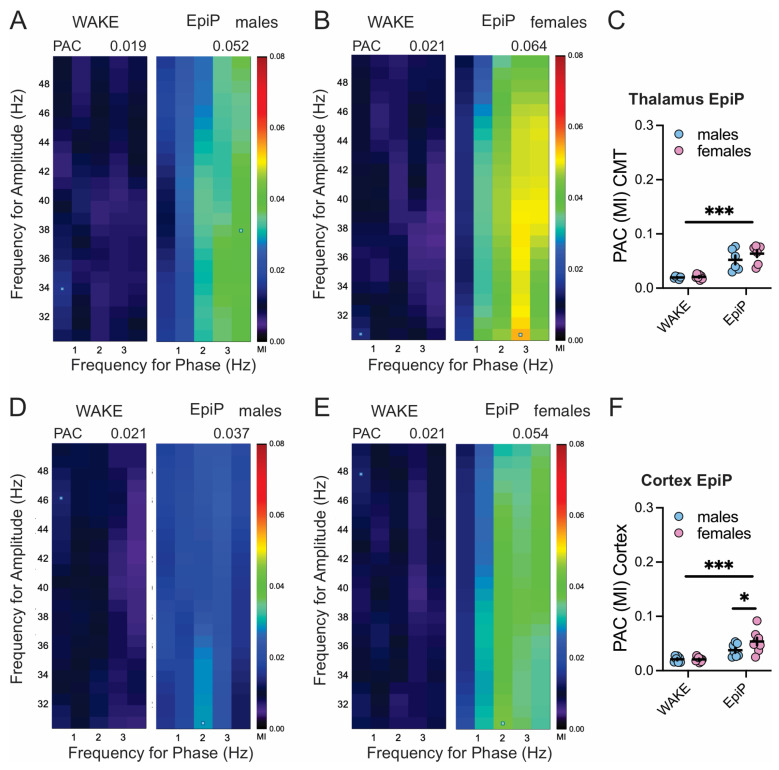
Neuroactive steroids (NAS) have long been recognized for their hypnotic and anesthetic properties in both clinical and preclinical settings. While sex differences in NAS sensitivity are acknowledged, the underlying mechanisms remain poorly understood. Here, we examined sex-specific responses to an endogenous NAS epipregnanolone (EpiP) in wild-type mice using behavioral assessment of hypnosis (loss of righting reflex, LORR) and in vivo electrophysiological recordings. Specifically, local field potentials (LFPs) were recorded from the central medial thalamus (CMT) and electroencephalogram (EEG) signals were recorded from the barrel cortex. We found that EpiP-induced LORR exhibited clear sex differences, with females showing increased sensitivity. Spectral power analysis and thalamocortical (TC) and corticocortical (CC) phase synchronization further supported enhanced hypnotic susceptibility in female mice. Our findings reveal characteristic sex-dependent effects of EpiP on the synchronized electrical activity in both thalamus and cortex. These results support renewed exploration of endogenous NAS as clinically relevant anesthetic agents.

Keywords: electroencephalogram; general anesthetics; hypnosis; neuroactive steroids; sex differences.


Conflict of interest statement

The authors declare no conflicts of interest.

Figures

Figure 1
Figure 1
Neurosteroid synthesis and behavioral (LORR) assessments. (A) Schematic illustrating the synthesis of EpiP from progesterone via 5β-reductase and 3β-hydroxysteroid dehydrogenase (3β-HSD). (B) Dose–response curves showing the percentage of animals exhibiting loss of righting reflex (LORR) following EpiP administration. Note the marked rightward shift in the dose–response curve for the male EpiP group (green). (C) Duration of LORR at varying EpiP doses (11–20 mice per group); mixed-effect model (REML): sex F(1,74) = 23.01, p < 0.001, dose F(3,74) = 74.12, p < 0.001, interaction F(3,74) = 12.52, p < 0.001; Sidak’s post hoc results indicated in the figure. (D) LORR onset following 100 mg/kg EpiP (9 mice per group); unpaired two-tailed t-test: t(16) = 2.74, p = 0.003. Green = males, pink = females, * p < 0.05, **** p < 0.001.
Figure 2
Figure 2
Power changes under EpiP over time. Total thalamic (left) and cortical (right) delta (A), theta (B), alpha (C), beta (D) and low gamma (E) power during wake state and after 100 mg/kg EpiP. Statistical analysis: two-way RM ANOVA for thalamic delta power: interaction F(12,132) = 8.44, p < 0.001, time F(12,132) = 5.63, p < 0.001, sex F(1,11) = 7.71, p = 0.018; two-way RM ANOVA for cortical delta power: interaction F(12,156) = 16.16, p < 0.001, time F(12,156) = 16.00, p < 0.001, sex F(1,13) = 9.4, p = 0.009; two-way RM ANOVA for thalamic theta power: interaction F(12,132) = 10.92, p < 0.001, time F(12,132) = 6.90, p < 0.001, sex F(1,11) = 15.28, p = 0.002; two-way RM ANOVA for cortical theta power: interaction F(12,156) = 16.38, p < 0.001, time F(12,156) = 16.78, p < 0.001, sex F(1,13) = 9.82, p = 0.008; two-way RM ANOVA for thalamic alpha power: interaction F(12,132) = 10.74, p < 0.001, time F(12,132) = 11.94, p < 0.001, sex F(1,11) = 31.11, p < 0.001; two-way RM ANOVA for cortical alpha power: interaction F(12,156) = 18.11, p < 0.001, time F(12,156) = 19.33, p < 0.001, sex F(1,13) = 10.74, p = 0.006; two-way RM ANOVA for thalamic beta power: interaction F(12,132) = 10.84, p < 0.001, time F(12,132) = 21.72, p < 0.001, sex F(1,11) = 45.90, p < 0.001; two-way RM ANOVA for cortical beta power: interaction F(12,156) = 16.70, p < 0.001, time F(12,156) = 28.58, p < 0.001, sex F(1,13) = 12.35, p = 0.004; two-way RM ANOVA for thalamic low gamma power: interaction F(12,132) = 10.61, p < 0.001, time F(12,132) = 53.46, p < 0.001, sex F(1,11) = 35.41, p < 0.001; two-way RM ANOVA for cortical low gamma power: interaction F(12,156) = 16.87, p < 0.001, time F(12,156) = 53.85, p < 0.001, sex F(1,13) = 15.14, p = 0.002. Green—males; pink—females; number of mice per group is presented in figure; Sidak’s post hoc presented in figure as a red line representing statistical significance, arrow—EpiP injection.
Figure 3
Figure 3
Spectral changes and sex differences under EpiP. (A) Representative thalamic (upper panel) and cortical (lower panel) power density heat maps in female animal showing decrease in power density after EpiP-induced LORR. (B) Representative thalamic (upper panel) and cortical (lower panel) power density heat maps in male animal showing increase in power density after EpiP-induced LORR. (C) Thalamic (left panel) and cortical (right panel) power densities during wake state. (D) Thalamic (left panel) and cortical (right panel) power densities 25–30 min after injections of EpiP. Female mice had reduction in 2–10 Hz thalamic and 2–12 Hz cortical power densities in comparison to male mice under EpiP; two-way RM ANOVA for thalamic power density: interaction F(26,286) = 8.81, p < 0.001, frequency F(26,286) = 32.0, p < 0.001, sex F(1,11) = 14.9, p = 0.003, Sidak’s post hoc presented in figure, where red line represents statistical significance; two-way RM ANOVA for cortical power density: interaction F(26,338) = 5.736, p < 0.001, frequency F(26,338) = 27.29, p < 0.001, sex F(1,13) = 6.99, p = 0.020, Sidak’s post hoc presented in figure, where red line represents statistical significance. (E) Thalamic (left panel) and cortical (right panel) powers (dB) during wake state. (F) Thalamic (left panel) and cortical (right panel) powers (dB) 25–30 min after injections of EpiP. Female mice had smaller values of thalamic powers in comparison to the male mice under EpiP; two-way RM ANOVA for thalamic power: interaction F(26,286) = 0.56, p = 0.961, frequency F(26,266) = 384.2, p < 0.001, sex F(1,11) = 22.49, p < 0.001; two-way RM ANOVA for cortical power: interaction F(26,338) = 1.14, p = 0.288, frequency F(26,338) = 1692, p < 0.001, sex F(1,13) = 9.98, p = 0.007. Green—males; pink—females; number of mice per group is presented in figure, ** p < 0.01, *** p < 0.001.
Figure 4
Figure 4
Sex-dependent differences in the cortical brain synchronization under EpiP. (A) Thalamocortical (TC) phase locking values (PLVs) during wake stateg (left), after EpiP (middle) and difference between EpiP and wake-state PLVs (right): sex differences were not observed. (B) Because there was no statistical significance between sexes during wake periods and after EpiP injection, both female and male data were combined for the statistical analysis: two-way RM ANOVA for EpiP: interaction F(4,48) = 34.74, p < 0.001, frequency F(4,48) = 12.58, p < 0.001, EpiP F(1,12) = 98.25, p < 0.001. (C) Corticocortical (CC) PLVs during wake state (left panel), after EpiP (middle panel) and difference between EpiP and wake-state PLVs (right panel). Female animals had lower delta/theta/alpha CC PLVs in comparison to the male EpiP animals (C middle panel), two-way RM ANOVA: interaction F(4,44) = 7.59, p < 0.001, frequency F(4,44) = 48.21, p < 0.001, sex F(1,11) = 15.23, p = 0.002, Sidak’s post hoc presented in figure. (C right panel) CC PLV difference showed lower values in female animals in delta/theta/alpha range; two-way RM ANOVA: interaction F(4,44) = 9.4, p < 0.001, frequency F(4,44) = 75.14, p < 0.001, sex F(1,11) = 9.06, p = 0.012, Sidak’s post hoc presented in figure. (D) Because there was a sex-dependent effect on CC PLVs, data from female and male mice are analyzed separately: two-way RM ANOVA for EpiP females: interaction F(4,24) = 28.63, p < 0.001, frequency F(4,24) = 15.34, p < 0.001, EpiP F(1,6) = 182.2, p < 0.001, Sidak’s post hoc presented in figure; two-way RM ANOVA for EpiP males: interaction F(4,20) = 117.1, p < 0.001, frequency F(4,20) = 198.6, p < 0.001, EpiP F(1,5) = 52.11, p < 0.001, Sidak’s post hoc presented in figure. Green—males; pink—females; gray—wake; blue—EpiP; number of animals per group is presented in figure, * p < 0.05, ** p < 0.01, *** p < 0.001.
Figure 5
Figure 5
PAC under EpiP. Heat maps showing change in thalamic MI after EpiP in male (A left -wake; A right-EpiP) and female (B left-wake; B right-EpiP) mice across different phase modulating (0.5–4 Hz) and amplitude modulating (30–50 Hz) frequencies. (C) Averaged thalamic max PAC MI value during wake state and after injections of EpiP; two-way RM ANOVA: interaction F(1,11) = 1.02, p = 0.334, EpiP F(1,11) = 52.9, p < 0.001, sex F(1,11) = 1.58, p = 0.23. Heat maps showing change in cortical MI after injections of EpiP in male (D left-wake; D right-EpiP) and female (E left-wake; E right-EpiP) mice across different phase modulating (0.5–4 Hz) and amplitude modulating (30–50 Hz) frequencies. (F) Averaged cortical max PAC MI value during wake state and after EpiP; two-way RM ANOVA: interaction F(1,13) = 4.26, p = 0.05, EpiP F(1,13) = 38.28, p < 0.001, sex F(1,13) = 2.44, p = 0.142, Sidak’s post hoc presented in figure. Blue—males; pink—females; dot on heat maps is the max PAC MI; number of mice per group: thalamic: 6 males and 7 females; cortical: 7 males and 8 females; * p < 0.05, *** p < 0.001.

Similar articles

References

    1. Reddy D.S. Neurosteroids: Endogenous Role in the Human Brian and Therapeutic Potentials. Prog. Brain Res. 2010;186:113. doi: 10.1016/B978-0-444-53630-3.00008-7. - DOI - PMC - PubMed
    1. Penning T.M., Covey D.F. 5β-Dihydrosteroids: Formation and Properties. Int. J. Mol. Sci. 2024;25:8857. doi: 10.3390/ijms25168857. - DOI - PMC - PubMed
    1. Coulter I., Timic Stamenic T., Eggan P., Fine B.R., Corrigan T., Covey D.F., Yang L., Pan J.Q., Todorovic S.M. Different Roles of T-Type Calcium Channel Isoforms in Hypnosis Induced by an Endogenous Neurosteroid Epipregnanolone. Neuropharmacology. 2021;197:108739. doi: 10.1016/j.neuropharm.2021.108739. - DOI - PMC - PubMed
    1. Bukanova J., Solntseva E., Kondratenko R., Kudova E. Epipregnanolone as a Positive Modulator of GABAA Receptor in Rat Cerebellar and Hippocampus Neurons. Biomolecules. 2021;11:791. doi: 10.3390/biom11060791. - DOI - PMC - PubMed
    1. Miller P.S., Scott S., Masiulis S., De Colibus L., Pardon E., Steyaert J., Aricescu A.R. Structural Basis for GABAA Receptor Potentiation by Neurosteroids. Nat. Struct. Mol. Biol. 2017;24:986–992. doi: 10.1038/nsmb.3484. - DOI - PMC - PubMed

LinkOut - more resources