

EEG-Based Analysis of Neural Responses to Sweeteners: Effects of Type and Concentration
- PMID: 40724281
- PMCID: PMC12294438
- DOI: 10.3390/foods14142460
EEG-Based Analysis of Neural Responses to Sweeteners: Effects of Type and Concentration
Abstract
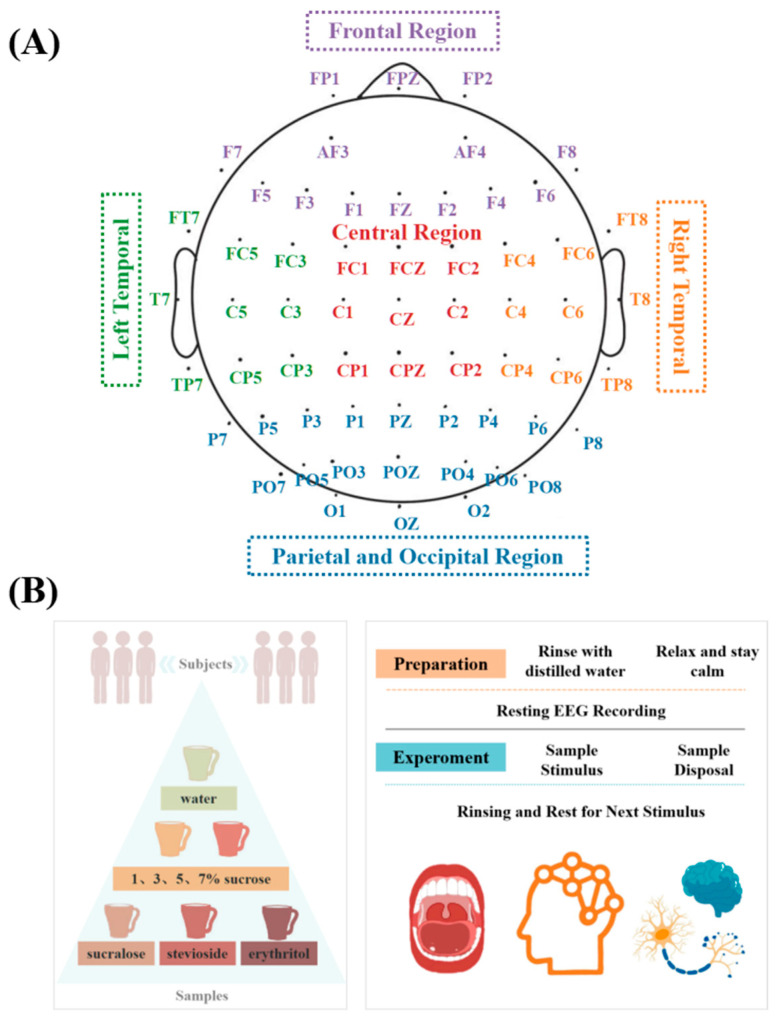
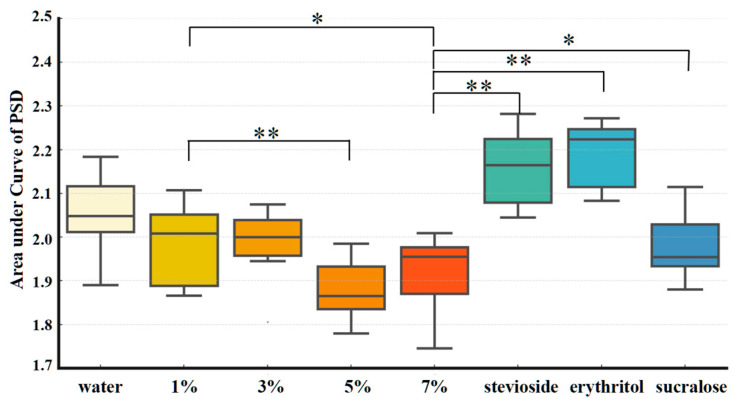
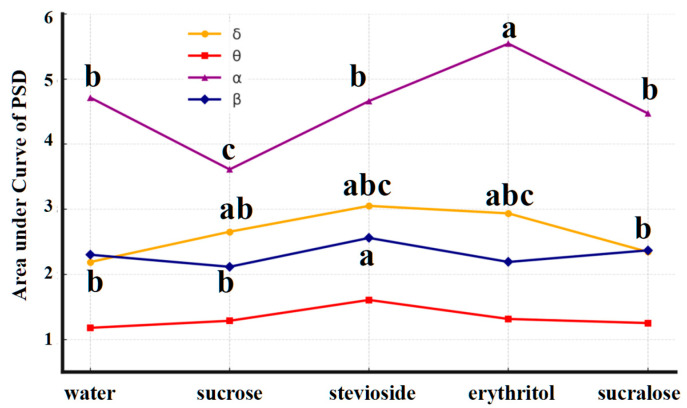
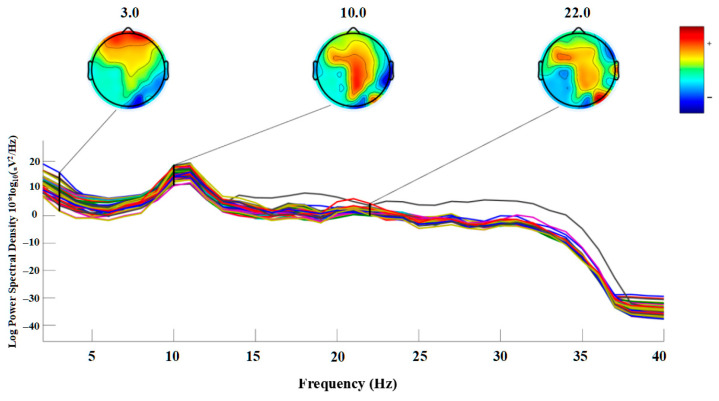
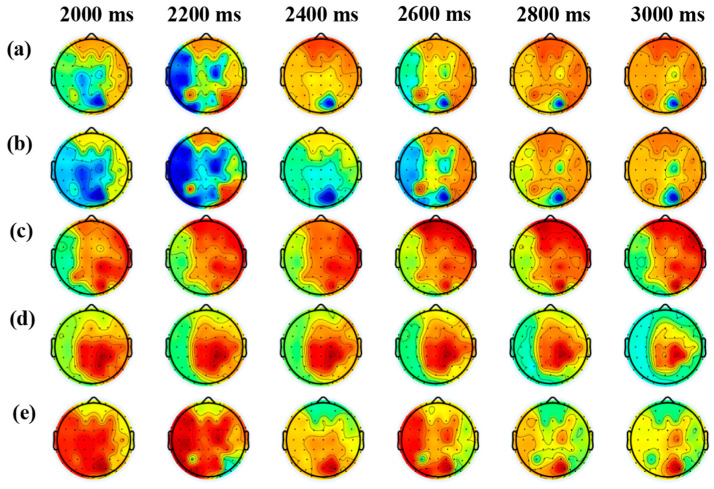
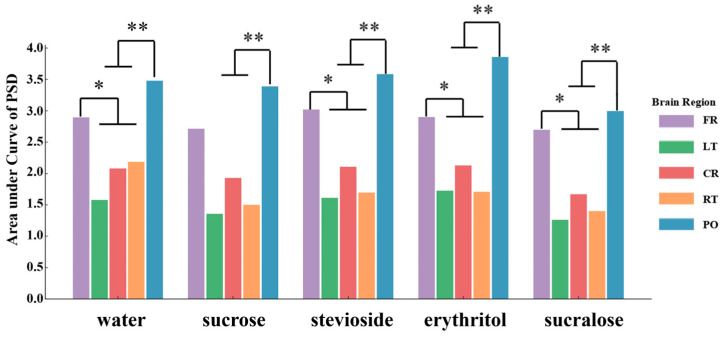
Sweetness is a key dimension of sensory experience in food, and variations in the type and concentration of sweeteners can elicit distinct brain responses. In this study, electroencephalography (EEG) was employed to systematically evaluate neural activity elicited by different concentrations of sucrose solutions (1%, 3%, 5%, and 7%) and by non-nutritive sweeteners matched in perceived sweetness to a 7% sucrose solution (10% erythritol, 0.0133% sucralose, and 0.0368% stevioside). The results revealed that an increased sucrose concentration was associated with progressively weaker EEG signal intensity, suggesting that the brain can effectively distinguish sweetness intensity. Under iso-sweet conditions, different types of sweeteners induced significantly distinct EEG patterns, indicating that the nature of the sweetener modulates flavor perception at the neural level. Further analysis showed increases in both δ- and α-band power following sweet taste stimulation, with prominent activations observed in the frontal, parietal, and right temporal regions. These findings demonstrate the utility of EEG in detecting subtle differences in brain responses to sweeteners, offering new insights into the neural mechanisms underlying sweet taste perception.
Keywords: brain response; non-nutritive sweeteners; scalp electroencephalogram; sweeteners; taste.
Conflict of interest statement
The authors declare no conflicts of interest. The funders had no role in the design of the study; in the collection, analyses, or interpretation of data; in the writing of the manuscript; or in the decision to publish the results.
Figures
Similar articles
-
Artificial Sweeteners in US-Marketed Oral Nicotine Pouch Products: Correlation with Nicotine Contents and Effects on Product Preference.Nicotine Tob Res. 2024 Dec 5:ntae293. doi: 10.1093/ntr/ntae293. Online ahead of print. Nicotine Tob Res. 2024. PMID: 39656927
-
Human brain responses to the artificial sweetener sucralose and sucrose in the presence of flavour modifier.Nutr Neurosci. 2025 Jul 4:1-12. doi: 10.1080/1028415X.2025.2508772. Online ahead of print. Nutr Neurosci. 2025. PMID: 40611719
-
Preclinical Evidence of the Effects of Sweet Flavors: Sweetness Increases Nicotine Intake and Seeking.Nicotine Tob Res. 2025 Mar 24;27(4):666-675. doi: 10.1093/ntr/ntae241. Nicotine Tob Res. 2025. PMID: 39413033
-
Association between consumption of sweeteners and endometrial cancer risk: a systematic review and meta-analysis of observational studies.Br J Nutr. 2024 Jan 14;131(1):63-72. doi: 10.1017/S0007114523001484. Epub 2023 Jul 10. Br J Nutr. 2024. PMID: 37424288
-
Sweet tasting solutions for reduction of needle-related procedural pain in children aged one to 16 years.Cochrane Database Syst Rev. 2015 May 5;2015(5):CD008408. doi: 10.1002/14651858.CD008408.pub3. Cochrane Database Syst Rev. 2015. PMID: 25942496 Free PMC article.
References
-
- Gwak M., Chung S.J., Kim Y.J., Lim C.S. Relative sweetness and sensory characteristics of bulk and intense sweeteners. Food Sci. Biotechnol. 2012;21:889–894. doi: 10.1007/s10068-012-0115-0. - DOI
-
- Lagast S., Gellynck X., Schouteten J.J., De Herdt V., De Steur H. Consumers’ emotions elicited by food: A systematic review of explicit and implicit methods. Trends Food Sci. Technol. 2017;69:172–189. doi: 10.1016/j.tifs.2017.09.006. - DOI
-
- Han P. Advances in research on brain processing of food odors using different neuroimaging techniques. Curr. Opin. Food Sci. 2021;42:134–139. doi: 10.1016/j.cofs.2021.06.002. - DOI
LinkOut - more resources
Full Text Sources
