

A Quantum-like Approach to Semantic Text Classification
- PMID: 40724483
- PMCID: PMC12294526
- DOI: 10.3390/e27070767
A Quantum-like Approach to Semantic Text Classification
Abstract
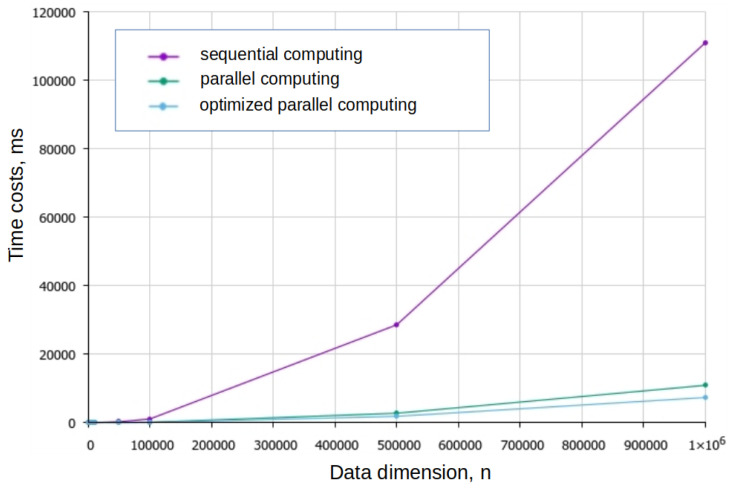
In this work, we conduct a sentiment analysis of English-language reviews using a quantum-like (wave-based) model of text representation. This model is explored as an alternative to machine learning (ML) techniques for text classification and analysis tasks. Special attention is given to the problem of segmenting text into semantic units, and we illustrate how the choice of segmentation algorithm is influenced by the structure of the language. We investigate the impact of quantum-like semantic interference on classification accuracy and compare the results with those obtained using classical probabilistic methods. Our findings show that accounting for interference effects improves accuracy by approximately 15%. We also explore methods for reducing the computational cost of algorithms based on the wave model of text representation. The results demonstrate that the quantum-like model can serve as a viable alternative or complement to traditional ML approaches. The model achieves classification precision and recall scores of around 0.8. Furthermore, the classification algorithm is readily amenable to optimization: the proposed procedure reduces the estimated computational complexity from O(n2) to O(n).
Keywords: interference; quantum-like heuristic algorithms; sentiment analysis; text classification; vector-space language model.
Conflict of interest statement
The authors declare no conflicts of interest.
Figures


Similar articles
-
Short-Term Memory Impairment.2024 Jun 8. In: StatPearls [Internet]. Treasure Island (FL): StatPearls Publishing; 2025 Jan–. 2024 Jun 8. In: StatPearls [Internet]. Treasure Island (FL): StatPearls Publishing; 2025 Jan–. PMID: 31424720 Free Books & Documents.
-
Signs and symptoms to determine if a patient presenting in primary care or hospital outpatient settings has COVID-19.Cochrane Database Syst Rev. 2022 May 20;5(5):CD013665. doi: 10.1002/14651858.CD013665.pub3. Cochrane Database Syst Rev. 2022. PMID: 35593186 Free PMC article.
-
Sexual Harassment and Prevention Training.2024 Mar 29. In: StatPearls [Internet]. Treasure Island (FL): StatPearls Publishing; 2025 Jan–. 2024 Mar 29. In: StatPearls [Internet]. Treasure Island (FL): StatPearls Publishing; 2025 Jan–. PMID: 36508513 Free Books & Documents.
-
The Lived Experience of Autistic Adults in Employment: A Systematic Search and Synthesis.Autism Adulthood. 2024 Dec 2;6(4):495-509. doi: 10.1089/aut.2022.0114. eCollection 2024 Dec. Autism Adulthood. 2024. PMID: 40018061 Review.
-
Comparison of self-administered survey questionnaire responses collected using mobile apps versus other methods.Cochrane Database Syst Rev. 2015 Jul 27;2015(7):MR000042. doi: 10.1002/14651858.MR000042.pub2. Cochrane Database Syst Rev. 2015. PMID: 26212714 Free PMC article.
References
-
- Heylighen F. The Future Information Society. Volume 8. World Scientific; Singapore: 2021. Distributed Intelligence Technologies: Present and future applications; pp. 136–145. (World Scientific Series in Information Studies).
-
- Guy T.V., Homolová J., Gaj A. Indirect Dynamic Negotiation in the Nash Demand Game. IEEE Access. 2022;10:105008–105021. doi: 10.1109/ACCESS.2022.3210506. - DOI
-
- Kárný M., Guy T.V. On the Origins of Imperfection and Apparent Non-rationality. In: Guy T.V., Kárný M., Wolpert D.H., editors. Decision Making: Uncertainty, Imperfection, Deliberation and Scalability. Springer International Publishing; Cham, Switzerland: 2015. pp. 55–89.
-
- Hassan S.U., Ahamed J., Ahmad K. Analytics of machine learning-based algorithms for text classification. Sustain. Oper. Comput. 2022;3:238–248. doi: 10.1016/j.susoc.2022.03.001. - DOI
LinkOut - more resources
Full Text Sources
