. 2025 Jul 17;15(7):1117.
doi: 10.3390/life15071117.

Triangular Fibrocartilage Characterization with Ultrashort Echo Time-T2* MRI: Insights from a Healthy Cohort

Affiliations

Triangular Fibrocartilage Characterization with Ultrashort Echo Time-T2* MRI: Insights from a Healthy Cohort

Sana Boudabbous et al. Life (Basel). .

Abstract

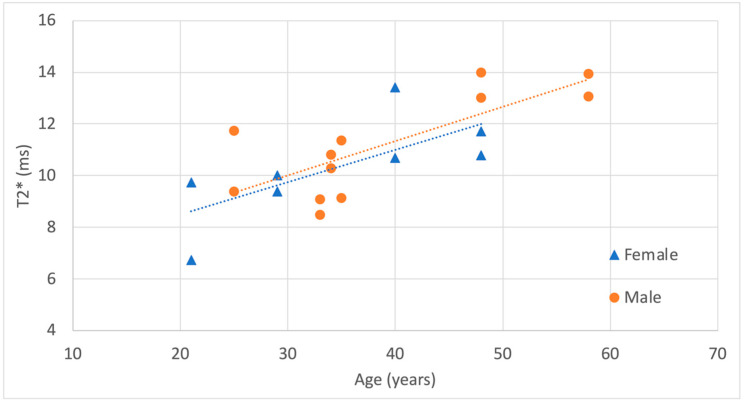
The objective of this study is to measure T2* relaxation time in the triangular fibrocartilage (TFC) disc in asymptomatic volunteers and evaluate its variation with factors such as age, hand dominance, sex, and ulnar variance, using a dedicated MRI sequence. The MRI protocol included anatomical sequences as well as a 3D ultra-short echo time (UTE)-T2* mapping sequence. A linear regression model was used to assess the potential influence of age, sex, and hand dominance on T2* values measured in the TFC disc and to evaluate the correlation between T2* values and ulnar variance. T2* relaxation time was positively correlated with age. The higher T2* relaxation times may reflect early degeneration of the fibrocartilage microstructure, which is associated with both biomechanical factors and the aging process. However, T2* was not significantly influenced by sex or hand dominance, nor was it correlated with ulnar variance (this later being limited by the fact that none of our subject had positive ulnar variance). In conclusion, UTE-T2* is a promising MRI technique showing positive correlation with age in the TFC of healthy subjects. These findings are a first step to establish normative T2* values and will help interpreting deviations observed in patient with suspected pathology in future studies.

Keywords: TFCC; UTE-T2*; age; degeneration; quantitative MRI imaging; ulnar variance.


Conflict of interest statement

The authors declare no conflict of interest.

Figures

Figure 1
Figure 1
Example of all sequences acquired for the right side of a volunteer. (A) T1 TSE in coronal orientation; (B) PD TSE with fat suppression in coronal orientation; (C) PD TSE with fat suppression in sagittal orientation; (D) 3D PD SPACE with fat suppression in coronal orientation; (E) 3D UTE with fat suppression in coronal orientation; (F) and the first echo of the 3D UTE-T2* mapping sequence in coronal orientation (TE = 0.04 ms). Cortical bone appears hypointense on all sequences. Fluids appear hyperintense on T2- and PD-weighted images and hypointense on T1-weighted image. Fat suppression helps distinguish fluids from fat, as the latter is also hyperintense. Blue arrows indicate TFC.
Figure 2
Figure 2
(AD): the same slice of the four different TEs used in the 3D UTE-T2* mapping sequence; (E) the resulting UTE-T2* map in grayscale, and (F) the UTE-T2* map in color (using the “RAINBOW” colormap in Osirix). The scaling is set from 0 to 300 a.u., corresponding to 0 to 30 ms. Increasing TE will cause tissues with short T2 relaxation times (e.g., fat) to appear hypointense, while tissues with long T2 relaxation times (e.g., muscle) will appear hyperintense. Blue arrows indicate TFC.
Figure 3
Figure 3
Visualization of a representative slice of the TFC disc for three different volunteers. (A,C,E): corresponding slice on the 3D UTE-T2* map with windowing parameters set between 0 and 300 a.u., corresponding to 0 and 30 ms. The manual contouring of the disc is shown in color. Stars indicate tendons that were excluded from the disc segmentation. (B,D,F): corresponding 3D PD SPACE with fat suppression in the coronal orientation. Fat suppression helps distinguish fluids from fat, as the latter is also hyperintense. Blue arrows indicate TFC. From top to bottom, the volunteers were 22, 33 and 48 years old, respectively.
Figure 4
Figure 4
Correlation of T2* measurements with subject age, shown separately for dominant and non-dominant hands. Regression lines are included for visualization purposes.
Figure 5
Figure 5
Correlation of T2* measurements with subject age, shown separately for males and females. Regression lines are included for visualization purposes.

References

    1. Palmer A.K., Werner F.W. The Triangular Fibrocartilage Complex of the Wrist—Anatomy and Function. J. Hand Surg. 1981;6:153–162. doi: 10.1016/S0363-5023(81)80170-0. - DOI - PubMed
    1. Kirchberger M.C., Unglaub F., Mühldorfer-Fodor M., Pillukat T., Hahn P., Müller L.P., Spies C.K. Update TFCC: Histology and Pathology, Classification, Examination and Diagnostics. Arch. Orthop. Trauma. Surg. 2015;135:427–437. doi: 10.1007/s00402-015-2153-6. - DOI - PubMed
    1. Unglaub F., Thomas S.B., Kroeber M.W., Dragu A., Fellenberg J., Wolf M.B., Horch R.E. Apoptotic Pathways in Degenerative Disk Lesions in the Wrist. Arthroscopy. 2009;25:1380–1386. doi: 10.1016/j.arthro.2009.04.071. - DOI - PubMed
    1. Unglaub F., Wolf M.B., Thome M.A., Germann G., Sauerbier M., Reiter A. Correlation of Ulnar Length and Apoptotic Cell Death in Degenerative Lesions of the Triangular Fibrocartilage. Arthroscopy. 2008;24:299–304. doi: 10.1016/j.arthro.2007.09.006. - DOI - PubMed
    1. Palmer A.K. Triangular Fibrocartilage Complex Lesions: A Classification. J. Hand Surg. 1989;14:594–606. doi: 10.1016/0363-5023(89)90174-3. - DOI - PubMed

LinkOut - more resources