. 2025 Jul 9;26(14):6587.
doi: 10.3390/ijms26146587.

Peripheral Leukocyte Syndecan-3 Is Elevated in Alzheimer's Disease: Evidence from a Human Study

Affiliations

Peripheral Leukocyte Syndecan-3 Is Elevated in Alzheimer's Disease: Evidence from a Human Study

Anett Hudák et al. Int J Mol Sci. .

Abstract

Syndecan-3 (SDC3), a transmembrane heparan sulfate proteoglycan involved in cell signaling and endocytosis, has recently been implicated in the pathogenesis of neurodegenerative disorders. While preclinical studies have demonstrated its role in Alzheimer's disease (AD), its diagnostic relevance in peripheral blood remains unexplored. In this human cohort study, we measured SDC3 expression in peripheral blood mononuclear cells (PBMCs) from 22 clinically diagnosed AD patients and 20 cognitively unimpaired non-AD controls using a custom ELISA. The findings were compared with plasma p-tau217 levels and a panel of systemic laboratory markers. PBMC-expressed SDC3 was significantly elevated in AD patients and moderately correlated with AD status (r = 0.309, p = 0.0465) independent of age. Notably, SDC3 levels were inversely correlated with systemic inflammatory markers, including C-reactive protein (CRP; r = -0.421, p = 0.0055) and D-dimer (r = -0.343, p = 0.038), suggesting an AD-associated immune phenotype distinct from acute-phase or vascular inflammation. Conversely, plasma p-tau217 levels did not significantly differ between groups but correlated with markers of tissue injury and inflammation (LDH, GOT, and ferritin), potentially reflecting systemic influences in non-AD controls. A multivariable logistic regression model incorporating SDC3, p-tau217, and age demonstrated high diagnostic accuracy (AUC = 0.85). These findings identify PBMC-expressed SDC3 as a promising blood-based biomarker candidate for AD, warranting further validation in larger, biomarker-confirmed cohorts.

Keywords: Alzheimer’s disease; biomarker; immune remodeling; neuroinflammation; p-tau217; peripheral blood mononuclear cells; syndecan-3.


Conflict of interest statement

Anett Hudák and Tamás Letoha were employed in Pharmacoidea Ltd. The authors declare that this research was conducted in the absence of any commercial or financial relationships that could be construed as a potential conflict of interest. The funders had no role in the design of the study; in the collection, analyses, or interpretation of data; in the writing of the manuscript; or in the decision to publish the results.

Figures
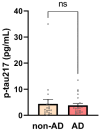
Figure 1
Figure 1
Plasma p-tau217 concentrations in non-AD and AD participants. Mean ± SEM plasma p-tau217 levels are shown for non-AD (n = 20) and AD (n = 22) participants. Each dot represents an individual participant. No significant difference was observed between groups (unpaired two-tailed t-test, p = 0.75, ns = non-significant).
Figure 2
Figure 2
Correlation of plasma p-tau217 with platelet parameters. Plasma p-tau217 concentrations were correlated with platelet indices in participants (n = 42). (A) p-tau217 showed a moderate negative correlation with THR (r = −0.32, p = 0.036), suggesting that higher p-tau217 concentrations are associated with lower platelet counts. (B) p-tau217 exhibited a moderate positive correlation with MPV (r = 0.34, p = 0.02570), suggesting potential platelet activation in participants with higher p-tau217 concentrations. Scatter plots show individual data points, linear regression lines, and Pearson correlation coefficients (r) with p-values.
Figure 3
Figure 3
Correlation of plasma p-tau217 with inflammatory and hepatic stress biomarkers. Plasma p-tau217 concentrations were correlated with markers of systemic inflammation, iron metabolism, and hepatic stress in study participants (n = 42). Scatter plots show individual data points, linear regression lines, and Pearson correlation coefficients (r) with corresponding p-values. (A) Ferritin correlated moderately with p-tau217 (r = 0.512, p = 0.0012), suggesting a link to systemic inflammation or iron dysregulation. (B) LDH showed a strong positive correlation (r = 0.595, p < 0.00004), consistent with tissue damage and systemic inflammation. (C) GOT exhibited a moderate positive correlation (r = 0.455, p = 0.0028), indicating potential hepatic involvement.
Figure 4
Figure 4
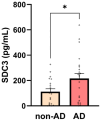
SDC3 concentrations in PBMCs are higher in AD participants. Bar plots show mean + SEM SDC3 concentrations in peripheral blood mononuclear cells (PBMCs; 1 × 10⁵ cells/sample) for non-AD (n = 20) and AD (n = 22) participants with individual data points. SDC3 concentrations were significantly higher in AD vs. non-AD participants (unpaired two-tailed t-test, * p = 0.03).
Figure 5
Figure 5
SDC3 concentrations in PBMCs are higher in female participants. Bar plots show mean ± SEM SDC3 concentrations in PBMCs (1 × 10⁵ cells/sample) for female (n = 28) and male (n = 14) participants with individual data points. SDC3 concentrations were significantly higher in female vs. male participants (unpaired two-tailed t-test, * p = 0.02).
Figure 6
Figure 6
Correlation of leukocyte-expressed SDC3 with systemic laboratory markers. SDC3 expression in peripheral blood leukocytes was correlated with systemic markers in participants (n = 42). Scatter plots show individual data points, linear regression lines, and Pearson correlation coefficients (r) with p-values. (A) CRP concentrations showed moderate negative correlation (r = −0.43, p = 0.004), suggesting reduced SDC3 expression with elevated inflammation. (B) D-dimer concentrations correlated weakly and negatively (r = −0.34, p = 0.038), potentially indicating dissociation from vascular injury.
Figure 7
Figure 7
ROC curves comparing the diagnostic performance of PBMC-expressed SDC3 alone versus a multivariable model. The ROC curves illustrate the classification performance of SDC3 alone (blue) and the multivariable logistic regression model (green), which includes SDC3, plasma p-tau217, and age. The SDC3-only model yielded an area under the curve (AUC) of 0.68, indicating moderate diagnostic performance. In contrast, the multivariable model achieved an AUC of 0.85, reflecting excellent discrimination between AD and non-AD participants. The x-axis represents the false positive rate (1 − specificity), and the y-axis represents the true positive rate (sensitivity).

References

    1. Kamatham P.T., Shukla R., Khatri D.K., Vora L.K. Pathogenesis, diagnostics, and therapeutics for Alzheimer’s disease: Breaking the memory barrier. Ageing Res. Rev. 2024;101:102481. doi: 10.1016/j.arr.2024.102481. - DOI - PubMed
    1. 2024 Alzheimer’s disease facts and figures. Alzheimers Dement. 2024;20:3708–3821. doi: 10.1002/alz.13809. - DOI - PMC - PubMed
    1. Zhang J., Zhang Y., Wang J., Xia Y., Zhang J., Chen L. Recent advances in Alzheimer’s disease: Mechanisms, clinical trials and new drug development strategies. Signal Transduct. Target. Ther. 2024;9:211. doi: 10.1038/s41392-024-01911-3. - DOI - PMC - PubMed
    1. Li H., Wang Z. Blood biomarkers for clinical applications in Alzheimer’s disease: A narrative review. NeuroMarkers. 2025;2:100078. doi: 10.1016/j.neumar.2025.100078. - DOI
    1. Hameed S., Fuh J.L., Senanarong V., Ebenezer E.G.M., Looi I., Dominguez J.C., Park K.W., Karanam A.K., Simon O. Role of Fluid Biomarkers and PET Imaging in Early Diagnosis and its Clinical Implication in the Management of Alzheimer’s Disease. J. Alzheimers Dis. Rep. 2020;4:21–37. doi: 10.3233/ADR-190143. - DOI - PMC - PubMed