Comparative Study
. 2025 Jul 10;26(14):6631.
doi: 10.3390/ijms26146631.

Comparing DNA Methylation Landscapes in Peripheral Blood from Myalgic Encephalomyelitis/Chronic Fatigue Syndrome and Long COVID Patients

Affiliations
Comparative Study

Comparing DNA Methylation Landscapes in Peripheral Blood from Myalgic Encephalomyelitis/Chronic Fatigue Syndrome and Long COVID Patients

Katie Peppercorn et al. Int J Mol Sci. .

Abstract

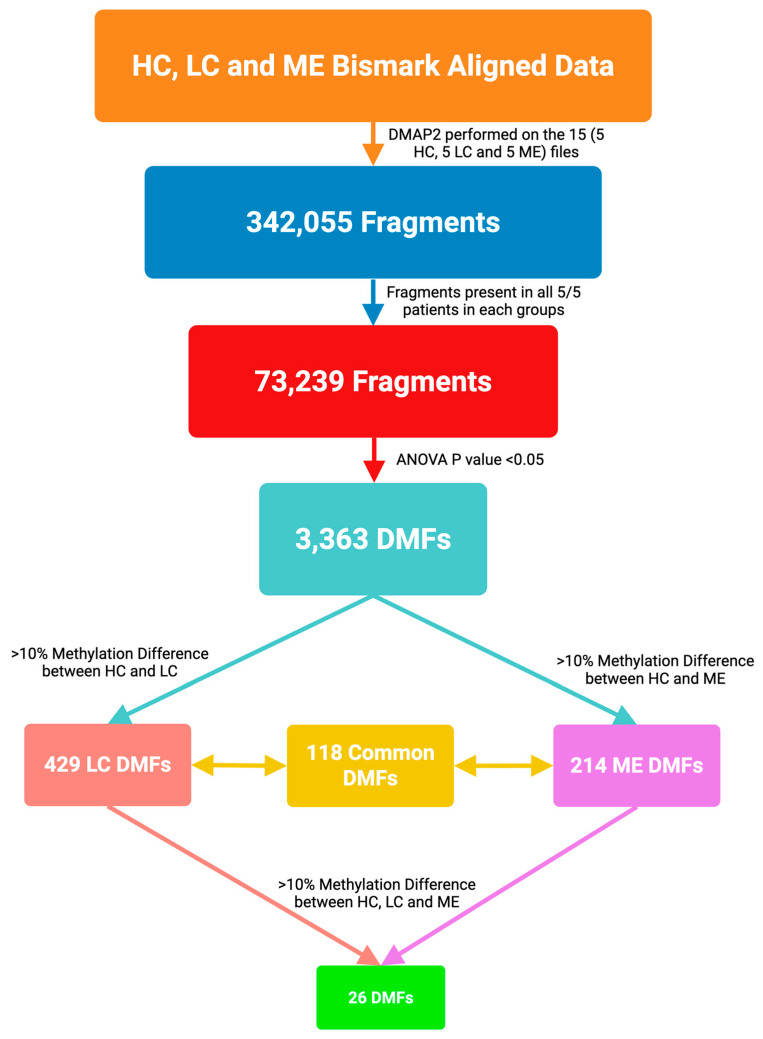
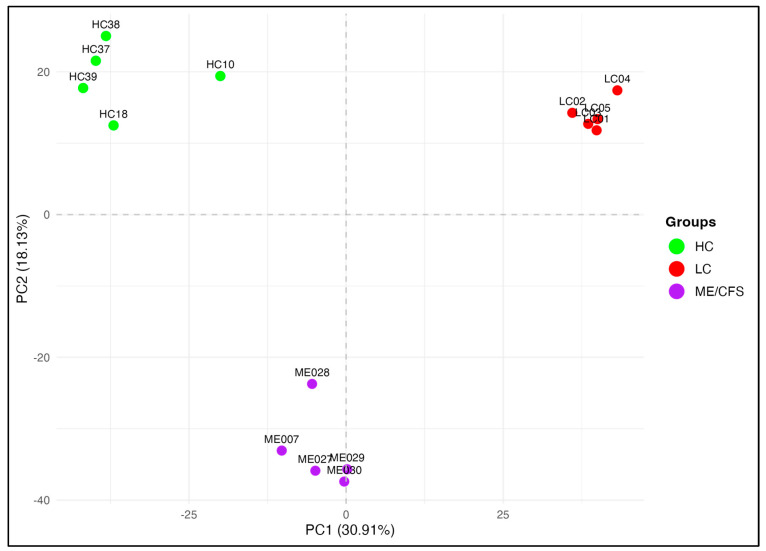
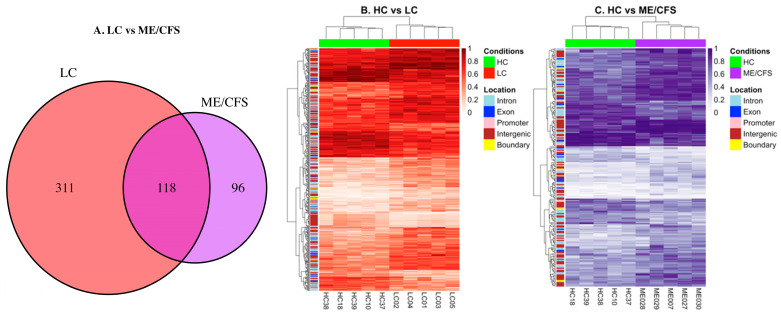
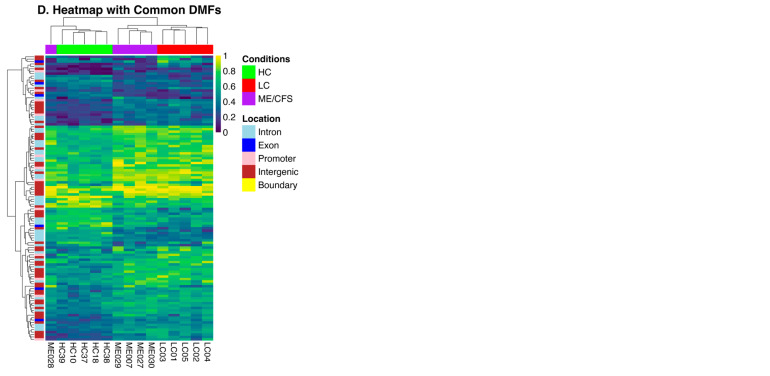
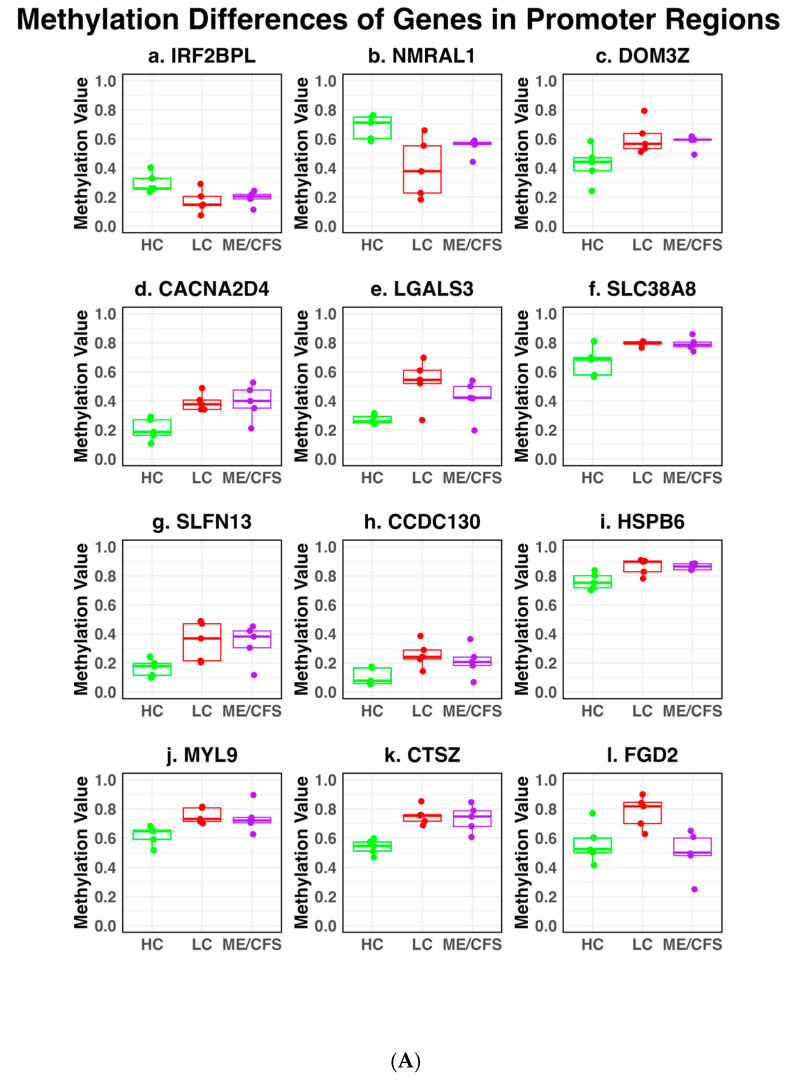
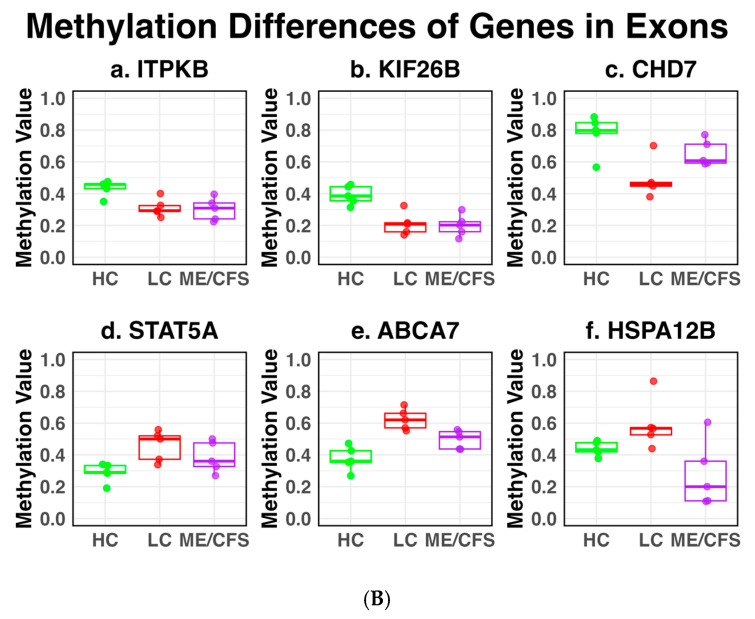
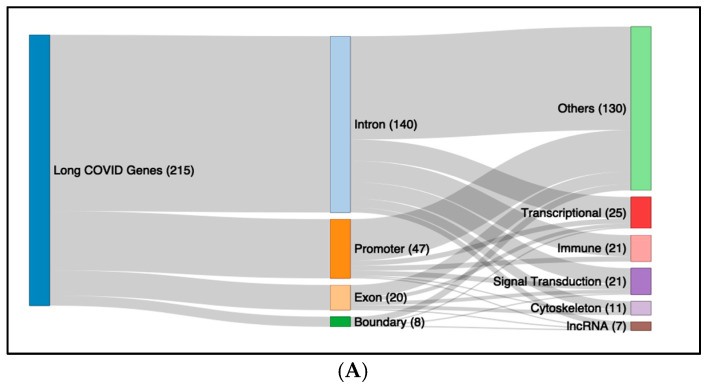
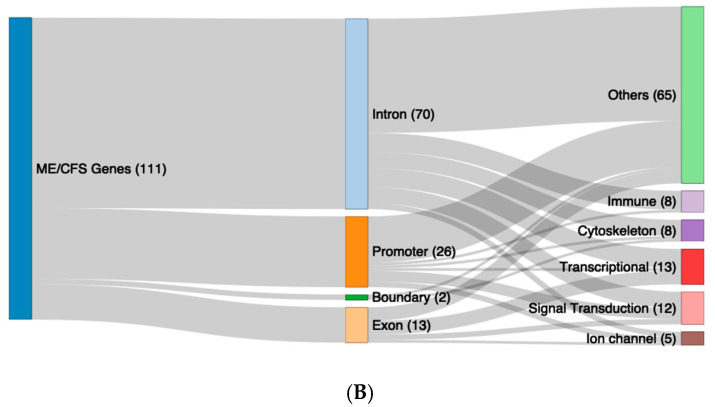
Post-viral conditions, Myalgic Encephalomyelitis/Chronic Fatigue Syndrome (ME/CFS) and Long COVID (LC), share > 95% of their symptoms, but the connection between disturbances in their underlying molecular biology is unclear. This study investigates DNA methylation patterns in peripheral blood mononuclear cells (PBMC) from patients with ME/CFS, LC, and healthy controls (HC). Reduced Representation Bisulphite Sequencing (RRBS) was applied to the DNA of age- and sex-matched cohorts: ME/CFS (n = 5), LC (n = 5), and HC (n = 5). The global DNA methylomes of the three cohorts were similar and spread equally across all chromosomes, except the sex chromosomes, but there were distinct minor changes in the exons of the disease cohorts towards more hypermethylation. A principal component analysis (PCA) analysing significant methylation changes (p < 0.05) separated the ME/CFS, LC, and HC cohorts into three distinct clusters. Analysis with a limit of >10% methylation difference and at p < 0.05 identified 214 Differentially Methylated Fragments (DMF) in ME/CFS, and 429 in LC compared to HC. Of these, 118 DMFs were common to both cohorts. Those in promoters and exons were mainly hypermethylated, with a minority hypomethylated. There were rarer examples with either no change in methylation in ME/CFS but a change in LC, or a methylation change in ME/CFS but in the opposite direction in LC. The differential methylation in a number of fragments was significantly greater in the LC cohort than in the ME/CFS cohort. Our data reveal a generally shared epigenetic makeup between ME/CFS and LC but with specific, distinct changes. Differences between the two cohorts likely reflect the stage of the disease from onset (LC 1 year vs. ME/CFS 12 years), but specific changes imposed by the SARS-CoV-2 virus in the case of the LC patients cannot be discounted. These findings provide a foundation for further studies with larger cohorts at the same disease stage and for functional analyses to establish clinical relevance.

Keywords: DNA methylation; Myalgic Encephalomyelitis/Chronic Fatigue Syndrome; differentially methylated fragments; hypermethylation; hypomethylation; long COVID; peripheral blood mononuclear cells.


Conflict of interest statement

The authors declare no conflicts of interest.

Figures

Figure 1
Figure 1
Flow diagram of the analysis of the DMFs in the ME/CFS, LC cohorts compared with age/sex matched HCs. Bam files were created from the Reduced Representation Bisulphite Sequencing (RRBS) data, the 15 samples analysed by DMAP2 [31] to give 342,055 methylated fragments, those fragments found in all five patients of each of the three cohorts made were sub-selected (73,239 fragments), and those significantly different (p < 0.05) comparing the ME/CFS and LC cohorts with HCs identified (3363 DMFs). Applying a limit of 10% change in differential methylation from the HCs gave 429 LC DMFs and 214 ME/CFS DMFs, of which 118 were in common between the two disease cohorts. Twenty-six of these 118 had a >10% methylation difference between the two patient cohorts.
Figure 2
Figure 2
PCA of differentially methylated fragments in all members of the HC, LC, and ME/CFS cohorts. PCA plot illustrating three distinct clusters representing HC, ME/CFS, and LC based on 3363 DMFs common to all cohorts filtered by p < 0.05, without considering methylation difference.
Figure 3
Figure 3
Heatmaps of differential methylation on fragments in the LC and ME/CFS patient cohorts compared with HCs. (A) Venn diagram showing overlapping DMFs in LC and ME (p < 0.05, >10% methylation difference). Heatmaps show DMFs between (B) LC and HC, (C) ME/CFS and HC (p < 0.05, >10% methylation difference). The annotation column bar at the top of each heat map represents the cohort group (LC-red, HC-green, ME/CFS-purple), and the annotation on the Y axis shows the genome region of the DMF (colour coded in the key). The colour gradient shown in the key indicates the methylation level of the fragments, with the darker colours representing the higher degree of methylation. The locations of the DMFs are annotated beside the heatmaps, gene promoters (−1 kb to +5 kb from the TSS), exons, introns, and intergenic elements (>5 kb upstream from the nearest TSS), and intron-exon boundary elements. (D) Heatmap showing the methylation values of the 118 common DMFs in the ME/CFS and LC cohorts and illustrating the methylation differences in the LC and ME/CFS patient groups compared with the HC group. The annotation column bar at the top of the heat map represents the cohort groups (LC-red, HC-green, ME/CFS-purple), and the annotation row bar on the left side shows the genome region of the DMFs (colour coded in the key). The colour gradient from yellow to indigo shown in the key ranges from hypermethylation (yellow) to hypomethylation (indigo). It indicates the colours matching specific methylation values.
Figure 3
Figure 3
Heatmaps of differential methylation on fragments in the LC and ME/CFS patient cohorts compared with HCs. (A) Venn diagram showing overlapping DMFs in LC and ME (p < 0.05, >10% methylation difference). Heatmaps show DMFs between (B) LC and HC, (C) ME/CFS and HC (p < 0.05, >10% methylation difference). The annotation column bar at the top of each heat map represents the cohort group (LC-red, HC-green, ME/CFS-purple), and the annotation on the Y axis shows the genome region of the DMF (colour coded in the key). The colour gradient shown in the key indicates the methylation level of the fragments, with the darker colours representing the higher degree of methylation. The locations of the DMFs are annotated beside the heatmaps, gene promoters (−1 kb to +5 kb from the TSS), exons, introns, and intergenic elements (>5 kb upstream from the nearest TSS), and intron-exon boundary elements. (D) Heatmap showing the methylation values of the 118 common DMFs in the ME/CFS and LC cohorts and illustrating the methylation differences in the LC and ME/CFS patient groups compared with the HC group. The annotation column bar at the top of the heat map represents the cohort groups (LC-red, HC-green, ME/CFS-purple), and the annotation row bar on the left side shows the genome region of the DMFs (colour coded in the key). The colour gradient from yellow to indigo shown in the key ranges from hypermethylation (yellow) to hypomethylation (indigo). It indicates the colours matching specific methylation values.
Figure 4
Figure 4
Box plots showing individual patient differential methylation characteristics at gene-associated sites. Box plots of (A) DMFs associated with gene promoters; (B) DMFs associated with gene exons within the 118 fragments in common between LC and ME/CFS patients. The plots show the individual patient values of the LC, ME/CFS, and the HC cohorts. In both (A,B), the HC is coloured green, the LC red, and ME/CFS purple. Individual patients are indicated by the points on the plots. The medians are indicated by the bold line, and the box indicates the first and third quartiles. Associated gene IDs are displayed at the top of each sub plot.
Figure 4
Figure 4
Box plots showing individual patient differential methylation characteristics at gene-associated sites. Box plots of (A) DMFs associated with gene promoters; (B) DMFs associated with gene exons within the 118 fragments in common between LC and ME/CFS patients. The plots show the individual patient values of the LC, ME/CFS, and the HC cohorts. In both (A,B), the HC is coloured green, the LC red, and ME/CFS purple. Individual patients are indicated by the points on the plots. The medians are indicated by the bold line, and the box indicates the first and third quartiles. Associated gene IDs are displayed at the top of each sub plot.
Figure 5
Figure 5
Sankey Plot showing the effects of differential methylation at regions of specific genes on molecular physiology of LC and ME/CFS. The figure demonstrates the connection of the differential methylation to gene regions of specific genes in (A). Long COVID and (B). ME/CFS. The locations of the sites within the genes (intron, exon, promoter, exon/intron boundary) and the main functional categories of molecular physiology affected, categorized by AI based on the functions derived from Gene Cards.
Figure 5
Figure 5
Sankey Plot showing the effects of differential methylation at regions of specific genes on molecular physiology of LC and ME/CFS. The figure demonstrates the connection of the differential methylation to gene regions of specific genes in (A). Long COVID and (B). ME/CFS. The locations of the sites within the genes (intron, exon, promoter, exon/intron boundary) and the main functional categories of molecular physiology affected, categorized by AI based on the functions derived from Gene Cards.

Similar articles

References

    1. WHO COVID-19 Cases, World. 2025. [(accessed on 3 April 2025)]. Available online: https://data.who.int/dashboards/covid19/cases.
    1. Tate W.P., Walker M.O.M., Peppercorn K., Blair A.L.H., Edgar C.D. Towards a Better Understanding of the Complexities of Myalgic Encephalomyelitis/Chronic Fatigue Syndrome and Long COVID. Int. J. Mol. Sci. 2023;24:5124. doi: 10.3390/ijms24065124. - DOI - PMC - PubMed
    1. Davis H.E., McCorkell L., Vogel J.M., Topol E.J. Long COVID: Major findings, mechanisms and recommendations. Nat. Rev. Microbiol. 2023;23:133–146. doi: 10.1038/s41579-022-00846-2. - DOI - PMC - PubMed
    1. National Academies of Sciences, Engineering, and Medicine. Health and Medicine Division. Board on Global Health. Board on Health Sciences Policy. Committee on Examining the Working Definition for Long COVID . In: A Long COVID Definition: A Chronic, Systemic Disease State with Profound Consequences. Goldowitz I., Worku T., Brown L., Fineberg H.V., editors. National Academies Press (US); Washington, DC, USA: 2024. - PubMed
    1. Collins F.S. NIH Launches New Initiative to Study “Long COVID”. [(accessed on 1 April 2025)];2021 Available online: https://www.nih.gov/about-nih/who-we-are/nih-director/statements/nih-lau....

Publication types

LinkOut - more resources