. 2025 Jul 10;26(14):6632.
doi: 10.3390/ijms26146632.

Vitamin D Reshapes Genomic Hierarchies in Skin Cells: lncRNA-Driven Responses in Carcinoma Versus Transcription Factor-Based Regulation in Healthy Skin

Affiliations

Vitamin D Reshapes Genomic Hierarchies in Skin Cells: lncRNA-Driven Responses in Carcinoma Versus Transcription Factor-Based Regulation in Healthy Skin

Anna M Olszewska et al. Int J Mol Sci. .

Abstract

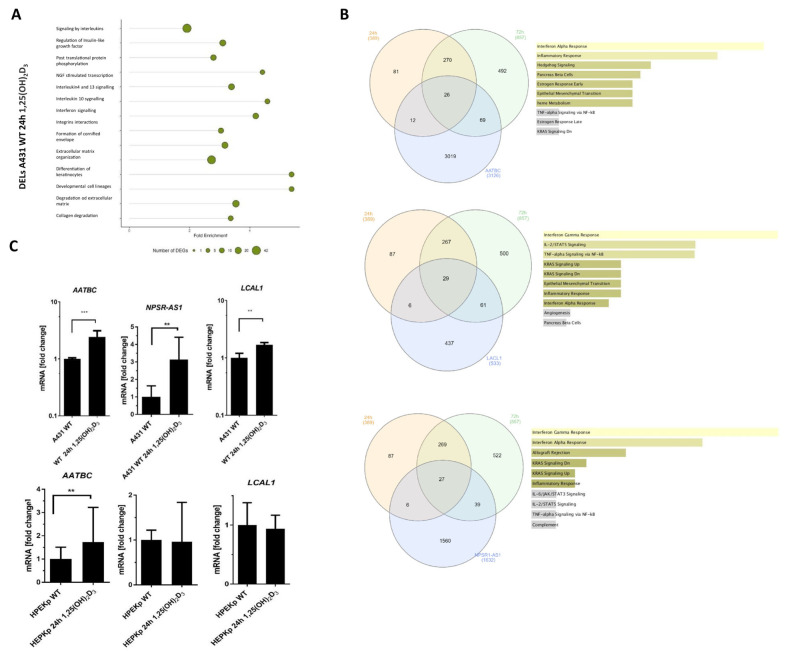
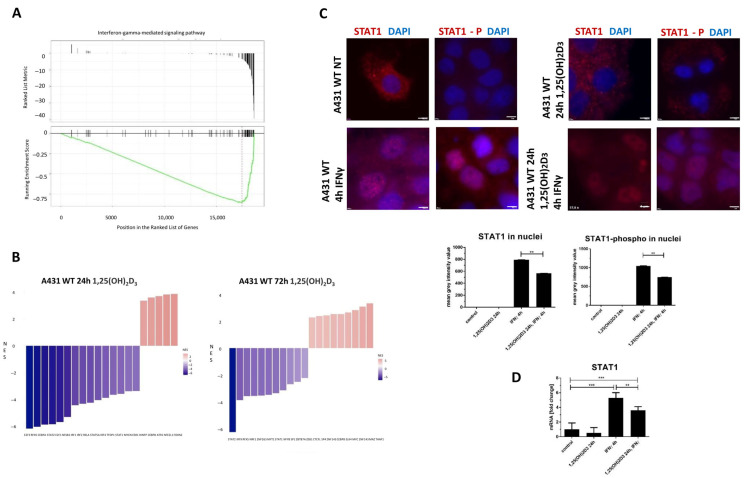
The active form of vitamin D3, 1,25(OH)2D3, exerts hierarchical control over gene expression, initially targeting transcription factors (TFs) that drive downstream responses. Here, we profile the transcriptional landscape of primary keratinocytes (HPEKp) and squamous cell carcinoma (SCC) cells in response to 1,25(OH)2D3, revealing a distinct shift in regulatory targets. While TFs accounted for 9.23% of differentially expressed genes (DEGs) in keratinocytes, this proportion dropped to 4.9% with prolonged exposure. In contrast, SCC cells displayed a five-fold reduction in TFs deregulation and a concurrent enrichment of long non-coding RNAs (lncRNAs), which comprised 22.25% of DEGs after 24 h treatment, with 81% upregulated. Integrative transcriptomic and in silico analyses showed that lncRNA induction was predominantly VDR-dependent, partially RXRA-dependent, and PDIA3-independent. Notably, 90% of deregulated lncRNAs were atypical for head and neck SCC. Several of these lncRNAs exhibit potential antitumor properties and may modulate SCC cell responsiveness to interferon-gamma (IFN-γ). In conclusion, these findings suggest that in SCC cells, the regulation of lncRNA expression-rather than transcription factor modulation-may represent a mechanism of the cellular response to 1,25(OH)2D3.

Keywords: long non-coding RNAs; squamous cell carcinoma; vitamin D3.


Conflict of interest statement

The authors declare no conflicts of interest.

Figures

Figure 1
Figure 1
Analysis of VDR translocation and VDR-RXRA colocalization level after different 1,25(OH)2D3 time points treatment of squamous carcinoma cell line A431 WT, and primary culture keratinocytes HPEKp. (A) Images of A431 cells, non-treated and treated with 1,25(OH)2D3 at different time points, showing VDR fluorescence translocation and colocalization of VDR (anti-VDR; red) with RXRA protein (anti-RXRA; green) in nuclei (DAPI; blue). (B) Pearson’s correlation coefficient values for colocalization of VDR and RXRA in the nucleus of the A431 cells at different time points of 1,25(OH)2D3 treatment. (C) Images of HPEKp cells, non-treated and treated with 1,25(OH)2D3 at different time points, showing VDR fluorescence translocation and colocalization of VDR (anti-VDR; red) with RXRA protein (anti-RXRA; green) in nuclei (DAPI; blue). (D) Pearson’s correlation coefficient values for colocalization of VDR and RXRA in the nucleus of the HPEKp cells at different time points of 1,25(OH)2D3 treatment. To analyze colocalization in cell nuclei, they were marked with a white dashed line using a dedicated neural network (cellSense, Olympus, Tokyo, Japan). Statistically significant differences are denoted with asterisks: * p < 0.05, *** p < 0.005, **** p < 0.0001. Scale bar 5 μm.
Figure 2
Figure 2
Time-dependent changes of differentially expressed lncRNAs (DELs) and differentially expressed transcription factors (DETFs) in a human squamous carcinoma cell line (A431) treated with 1,25(OH)2D3 for 24 h and 72 h. (A) Venn diagram showing the distribution of the DELs from A431 cells treated for 24 h or 72 h with 1,25(OH)2D3. (B) Classification of DELs from A431 cell line after 1,25(OH)2D3 treatment for 24 h and 72 h. (C,D) CiiiDER enrichment analysis showing the transcription factor binding sites (TFBSs) that are significantly over-represented (greater than zero) and under-represented (less than zero) for the DELs in A431 cell line after 1,25(OH)2D3 treatment for 24 h or 72 h compared with the background sequences. The plot shows the proportion of regions bound for each TF. The y-axis shows the enrichment (ratio of proportion bound), and the x-axis shows the average log proportion bound. The sizes and colors of the circles indicate the ±log10 (p-value). (E) LncSEA platform annotation analysis results show DEL-protein interactions in the A431 cell line after 1,25(OH)2D3 treatment for 24 h or 72 h. (F) Venn diagram showing the distribution of the DETFs in A431 WT cells treated for 24 h with 1,25(OH)2D3. (G) Heat map of RNA-seq expression data showing the DETFs in A431 WT cell line after 1,25(OH)2D3 treatment for 72 h.
Figure 3
Figure 3
Time-dependent changes of differentially expressed lncRNAs (DELs) and differentially expressed transcription factors (DETFs) in normal keratinocytes (HPEKp) treated with 1,25(OH)2D3 for 4 h and 24 h. (A) Venn diagram showing the distribution of the DELs from HPEKp cells treated for 4 h or 24 h with 1,25(OH)2D3. (B) Classification of DELs from HPEKp cell line after 1,25(OH)2D3 treatment for 4 h and 24 h. (C,D) CiiiDER enrichment analysis showing the transcription factor binding sites (TFBSs) that are significantly over-represented (greater than zero) and under-represented (less than zero) for the DELs in HPEKp cell line after 1,25(OH)2D3 treatment for 4 h or 24 h compared with the background sequences. The plot shows the proportion of regions bound for each TF. The y-axis shows the enrichment (ratio of proportion bound), and the x-axis shows the average log proportion bound. The sizes and colours of the circles indicate the ±log10 (p-value). (E) LncSEA platform annotation analysis results show DEL-protein interactions in the HPEKp cell line after 1,25(OH)2D3 treatment for 24 h. (F) Venn diagram showing the distribution of the DETFs in HPEKp cells treated for 4 h and 24 h with 1,25(OH)2D3. (G) Heat map of RNA-seq expression data showing the DETFs in A431 WT cell line after 1,25(OH)2D3 treatment for 4 h and 24 h.
Figure 4
Figure 4
Comparative analysis of DELs from 1,25(OH)2D3-treated A431 cells to DELs from healthy cells, A431 cells lacking functional VDR, RXRA, and PDIA3 genes, and lncRNAs typical of head and neck squamous cell carcinoma (HNSC). (A) Venn diagrams showing the differences in DELs and DETs between healthy cells and cancerous cells treated with 1,25(OH)2D3. (B) Venn diagrams showing the distribution of the DELs and DETFs in A431 WT, A431 ΔRXRA, and A431 ΔPDIA3 cells treated for 24 h with 1,25(OH)2D3. (C) Percentage distribution of RXRA dependent/independent genes and/or PDIA3 after 24 h 1,25(OH)2D3 treatment. (D) Venn diagram showing the distribution of the DELs between DELs from HNSC databases lnc2Cancer3.0 and lncRNAfunc and DELs from A431 cells treated with 1,25(OH)2D3 for 24 h and 72 h.
Figure 5
Figure 5
The possible impact of lncRNAs on interferon-gamma signaling after 1,25(OH)2D3 treatment of squamous cell carcinoma line A431. (A) Reactome analysis of DELs in A431 cells treated with 1,25(OH)2D3 for 24 h. (B) The Venn diagrams show AATBC, NPSR1-AS, and LCAL1 target genes (downloaded from the lncRNAfunc tool) with all DEGs from A431 cells treated with 1,25(OH)2D3 for 24 h and 72 h, and the ontology of genes is common to the three defined groups mentioned above. (C) mRNA expression of AATBC, NPSR1-AS1, LCAL1 before and after treated with 1,25(OH)2D3 of A431 and HPEKp cells. Statistically significant differences are denoted with asterisks: ** p < 0.01, *** p < 0.005.
Figure 6
Figure 6
The impact of 1,25(OH)2D3 on interferon-gamma-mediated signaling pathway. (A) GSEA analyses of the DEGs after 72 h 1,25(OH)2D3. (B) Top 20 transcription factors showing the greatest changes compared to A431 1,25(OH)2D3 treated for 24 h or 72 h vs. non-treated cells. Negative values indicate a decrease in expression of 1,25(OH)2D3 compared to non-treated A431 cells, while positive values indicate an increase (analyses made on all DEGs). (C) Images of A431 cells (control, non-treated with 1,25(OH)2D3; NT) treated with 1,25(OH)2D3 for 24 h, with IFNγ for 4 h, or pretreated with 1,25(OH)2D3 for 24 h. Images show: STAT1 (red) or STAT1-phospho (red) with DAPI (blue) signals. The lower panel shows mean grey intensity values (fluorescence intensity) of STAT1 and STAT1-phospho in A431 cells at different treatment combinations. (D) mRNA expression pattern of STAT1 treated with 1,25(OH)2D3 and IFNγ at different combinations. Statistically significant differences are denoted with asterisks: ** p < 0.01, *** p < 0.005. Scale bar 5 μm.

Similar articles

References

    1. Geidel G., Heidrich I., Kött J., Schneider S.W., Pantel K., Gebhardt C. Emerging precision diagnostics in advanced cutaneous squamous cell carcinoma. NPJ Precis. Oncol. 2022;6:17. doi: 10.1038/s41698-022-00261-z. - DOI - PMC - PubMed
    1. Meng X., Lou Q.Y., Yang W.Y., Wang Y.R., Chen R., Wang L., Xu T., Zhang L. The role of non-coding RNAs in drug resistance of oral squamous cell carcinoma and therapeutic potential. Cancer Commun. 2021;41:981–1006. doi: 10.1002/cac2.12194. - DOI - PMC - PubMed
    1. Wang Y., Sun B., Wen X., Hao D., Du D., He G., Jiang X. The Roles of lncRNA in Cutaneous Squamous Cell Carcinoma. Front. Oncol. 2020;10:158. doi: 10.3389/fonc.2020.00158. - DOI - PMC - PubMed
    1. Tang J., Fang X., Chen J., Zhang H., Tang Z. Long Non-Coding RNA (lncRNA) in Oral Squamous Cell Carcinoma: Biological Function and Clinical Application. Cancers. 2021;13:5944. doi: 10.3390/cancers13235944. - DOI - PMC - PubMed
    1. Yu G.J., Sun Y., Zhang D.W., Zhang P. Long non-coding RNA HOTAIR functions as a competitive endogenous RNA to regulate PRAF2 expression by sponging miR-326 in cutaneous squamous cell carcinoma. Cancer Cell Int. 2019;19:270. doi: 10.1186/s12935-019-0992-x. - DOI - PMC - PubMed

MeSH terms