. 2025 Jul 11;26(14):6642.
doi: 10.3390/ijms26146642.

Optimal Horseshoe Crab Blood Collection Solution That Inhibits Cellular Exocytosis and Improves Production Yield of Limulus Amoebocyte Lysate for Use in Endotoxin Tests

Affiliations

Optimal Horseshoe Crab Blood Collection Solution That Inhibits Cellular Exocytosis and Improves Production Yield of Limulus Amoebocyte Lysate for Use in Endotoxin Tests

Mengmeng Zhang et al. Int J Mol Sci. .

Abstract

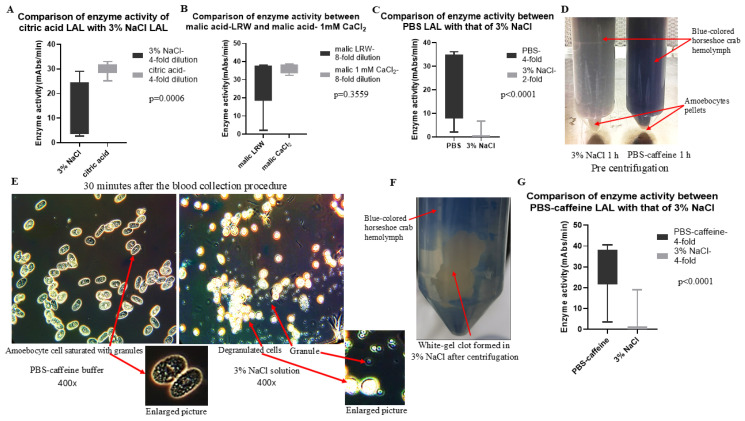
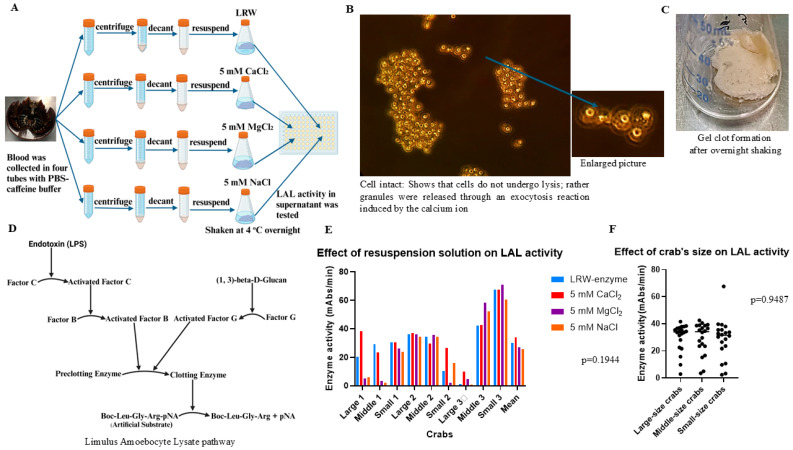
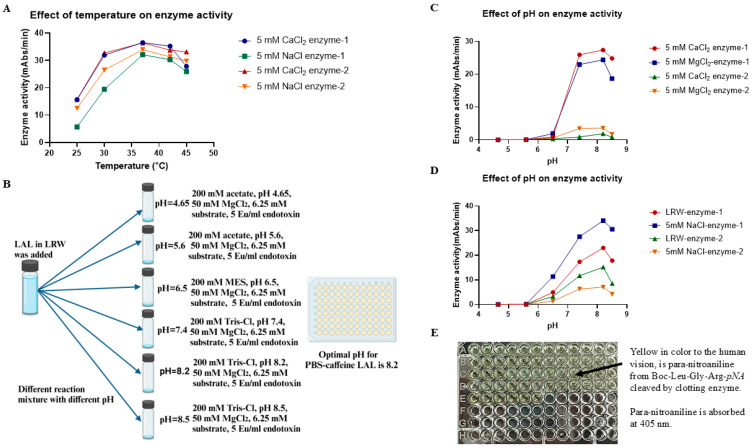
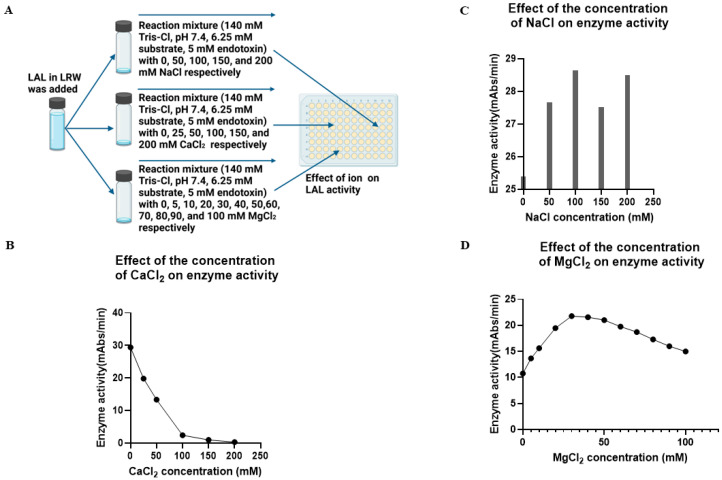
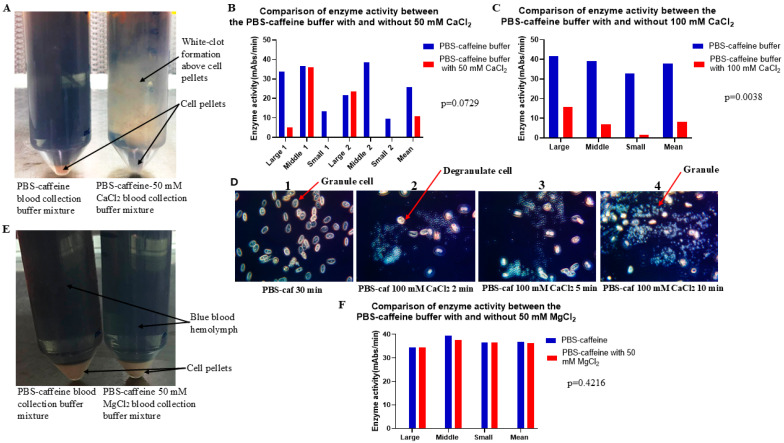
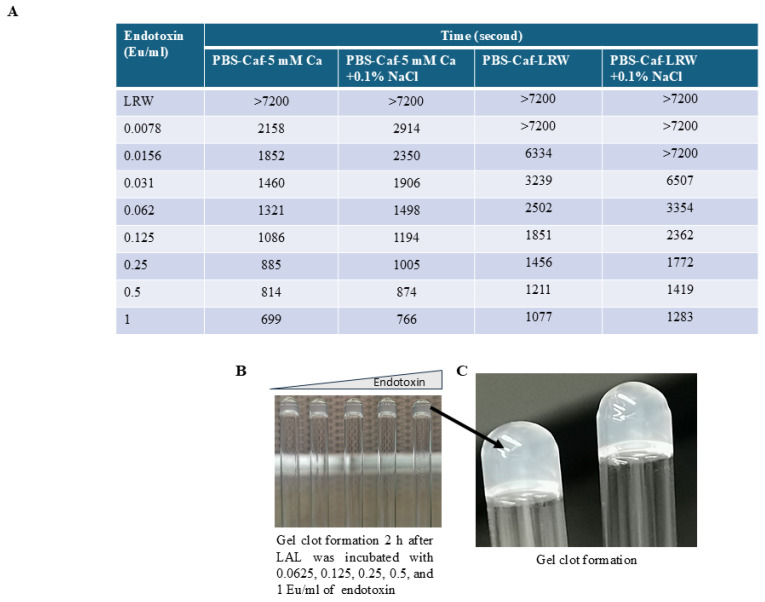
Limulus amoebocyte lysate (LAL) assays have emerged as among the most effective approaches for detecting endotoxins and fungi in vitro since they were first tested 50 years ago. Although detailed protocols are publicly available, conventional LAL collection methods (3% sodium chloride) waste as much as 80% of the total LAL during blood accumulation, confirming the incompatibility of these methods with the lasting survival of the American horseshoe crab. For this reason, new implementations of blood collection-suspension buffer combinations are critical. Here, we evaluated the ability of different blood collection solutions to inhibit exocytosis and subsequently treated the cells with CaCl2 to stimulate exocytosis and improve the yield of LAL. Two test methods, chromogenic and turbidimetric tests for LAL activity, were evaluated. Crabs were bled during the bleeding season. The crab blood samples were collected with the following blood collection solutions: citric acid buffer, malic acid buffer, PBS buffer, and PBS-caffeine buffer. The cell pellets were washed with 3% NaCl and subsequently resuspended in LRW or CaCl2 to facilitate degranulation. Both the chromogenic test and the turbidimetric assay were used to evaluate the LAL enzyme activity. Citric acid buffer, malic acid buffer, PBS buffer, and PBS-caffeine buffer blocked exocytosis, resulting in the high yields of LAL. There was no observable effect on the activity output of crab size via a chromogenic test with PBS-caffeine buffer during the bleeding season. This protocol substantially benefited prior processes, as the PBS-caffeine collection mixture decreased amoebocyte aggregation/clot formation during processing. Furthermore, we evaluated the specific biochemical parameters of PBS-caffeine-derived LAL. We developed an accessible, promising phosphate-caffeine-based blood collection buffer that prevents amoebocyte degranulation during blood collection, maximizing the LAL yield. Moreover, our analysis revealed that phosphate-caffeine-derived LAL is uniquely adaptable to compatibility with chromogenic and turbidimetric assay techniques. By employing this method for LAL blood extraction, our same-cost approach fostered significantly greater LAL yields, simultaneously ensuring a healthy limulus polyphemus population.

Keywords: PBS–caffeine; chromogenic assay; endotoxin; exocytosis; limulus amoebocyte lysate (LAL) assays.


Conflict of interest statement

The authors declare no conflict of interest.

Figures

Figure 1
Figure 1
The effects of the use of citric acid buffer, malic acid buffer, PBS buffer, and PBS–caffeine buffer on the inhibition of degranulation during hemolymph collection were evaluated. The blood of the crabs was collected in citric acid buffer, malic acid buffer, PBS buffer, PBS–caffeine buffer, and 3% NaCl solution. Microscopy images of the amoebocyte cells in the blood were taken thirty minutes after collection. After 1 h of incubation at room temperature, the blood–buffer mixture was centrifuged at 1000 rpm (180× g) for 5 min. The cell pellets were washed twice with 3% NaCl, resuspended in 5 mM CaCl2 resuspension solution, and shaken at 4 °C overnight. The enzyme activity of the supernatants was tested via chromogenic tests, and statistical tests were performed via the GraphPad Prism 10.2 software t-test. (A) The comparison of the enzyme activity of citric acid LAL with that of 3% NaCl LAL (29.42 ± 2.53 vs. 11.32 ± 11.23 mAbs/min, p = 0.0006). (B) The comparison of the enzyme activity of malic acid (LAL) resuspended in LAL with that of malic acid (LAL) resuspended in 1 mM CaCl2 (29.46 ± 15.35 vs. 36.28 ± 2.66 mAbs/min, p = 0.3559). (C) The comparison of the enzyme activity of PBS LAL with that of 3% NaCl LAL (23.16 ± 13.44 vs. 0.88 ± 1.85 mAbs/min, p < 0.001). (D) Blood from horseshoe crabs was collected with 3% NaCl and PBS–caffeine buffer and incubated at room temperature for 1 h. (E) The microscopic observation of amoebocytes collected with PBS–caffeine buffer and 3% NaCl solution. (F) Gel clot formation in 3% NaCl solution after centrifugation. (G) The comparison of the enzyme activity of the PBS–caffeine LAL with that of the 3% NaCl LAL (28.48 ± 12.1 vs. 2.88 ± 6.55 mAbs/min, p < 0.001).
Figure 2
Figure 2
CaCl2 (5 mM) improved the yield of LAL. For each crab, 15 mL of blood was collected in four Corning tubes from 60 mL of total blood drawn from each crab. These four Corning tubes were prefilled with 15 mL of PBS–caffeine buffer prior to the collection of blood from each crab. The blood–buffer mixture was centrifuged at 1000 rpm for 5 min. The cell pellets were washed twice with 3% NaCl solution and resuspended in LRW, 5 mM CaCl2, 5 mM MgCl2, or 5 mM NaCl. After shaking at 4 °C overnight, we tested the enzyme activity via the chromogenic method. One-way ANOVA was conducted via GraphPad Prism 10.2 software to compare the enzyme activity. (A) Experimental procedure. (B) Microscopy image after the cell pellet was resuspended overnight. (C) Gel clot formation after shaking overnight. (D) Limulus amoebocyte lysate pathway. (E) The comparison of enzyme activity in the supernatant when the cell pellets were resuspended in LRW (30.1 ± 19.15), 5 mM CaCl2 (33.88 ± 15.9), 5 mM MgCl2 (26.91 ± 25.52), or 5 mM NaCl (25.54 ± 21.59) mAbs/min overnight, p = 0.1944. (F) The comparison of LAL activity in different sizes of crabs. The average enzyme activities of large crabs, mid-sized crabs, and small crabs were 29.99 ± 10.32, 29.22 ± 11.62, and 28.74 ± 14.71 mAbs/min, respectively (p = 0.9487).
Figure 3
Figure 3
The effects of temperature and pH on enzyme activity. (A) The effects of temperature on enzyme activity. Fifty microliters of PBS–caffeine LAL was incubated with 50 µL of the reaction mixture (140 mM Tris-Cl, pH 7.4, 50 mM MgCl2, 6.25 mM substrate, 5 Eu/mL endotoxin) in four 96-well plates. The plates were put into four plate readers set at 25 °C, 30 °C, 37 °C, and 42 °C. The reaction was monitored for 1 h. (B) Experimental procedure for determining the effects of pH on enzyme activity. Fifty microliters of PBS–caffeine-treated LAL were incubated with 10 µL of buffer at six different pH values (200 mM acetate, pH 4.65, 200 mM acetate, pH 5.6, 200 mM MES, pH 6.5, 200 mM Tris-Cl, pH 7.4, 200 mM Tris-Cl, pH 8.2, and 200 mM Tris-Cl, pH 8.5) in a 96-well plate at room temperature for 5 min. Then, 40 µL of each reaction mixture (50 mM MgCl2, 6.25 mM substrate, and 5 Eu/mL endotoxin) was added, and the plate was subsequently placed in a plate reader at 37 °C. The reaction was monitored for 1 h. (C,D) The effects of pH on enzyme activity. Eight different kinds of PBS–caffeine LAL were incubated with buffers at six different pH values as described in (B). The reaction mixture was added, and the plate was subsequently placed in a plate reader at 37 °C. The reaction was monitored for 1 h. (E) The reaction was performed on a 96-well pyro plate. The color of the reaction mixture turned yellow 1 h after the reaction when para-nitroaniline from Boc-Leu-Gly-Arg-pNA was released by clotting enzyme cleavage.
Figure 4
Figure 4
The effect of ions on enzyme activity. (A) Experimental procedure. (B) The effect of CaCl2 on enzyme activity. The PBS–caffeine enzyme mixture was incubated with 0, 25, 50, 100, 150, or 200 mM CaCl2 in 96-well plates at room temperature for 5 min, after which 50 µL of the reaction mixture (140 mM Tris-Cl, pH 7.4, 6.25 mM substrate, and 5 Eu/mL endotoxin) was added. The plate was placed in a plate reader, and the reaction was monitored at 37 °C for 1 h. (C) The effect of NaCl on enzyme activity. The PBS–caffeine enzyme mixture was incubated with 0, 50, 100, 150, or 200 mM NaCl in 96-well plates at room temperature for 5 min, after which 50 µL of the reaction mixture (140 mM Tris-Cl, pH 7.4, 6.25 mM substrate, and 5 Eu/mL endotoxin) was added. The plate was placed in a plate reader, and the reaction was monitored at 37 °C for 1 h. (D) The effect of MgCl2 on enzyme activity. The PBS–caffeine enzyme mixture was incubated with 0, 5, 10, 20, 30, 40, 50, 60, 70, 80, 90, or 100 mM MgCl2 in 96-well plates at room temperature for 5 min, after which 50 µL of the reaction mixture (140 mM Tris-Cl, pH 7.4, 6.25 mM substrate, and 5 Eu/mL endotoxin) was added. The plate was placed in a plate reader, and the reaction was monitored at 37 °C for 1 h.
Figure 5
Figure 5
CaCl2 inhibited the effect of the PBS–caffeine buffer on exocytosis. Blood from two large, two middle-sized, and two small crabs was collected with PBS–caffeine buffer or PBS–caffeine buffer supplemented with 50 mM CaCl2. The blood buffer mixture was processed as described in the Materials and Methods Section. The cell pellets were resuspended in 5 mM CaCl2 resuspension solution, and the mixture was shaken at 4 °C overnight. The enzyme activity of the supernatant was tested via the chromogenic method, and the statistical test was performed via the GraphPad Prism 10.2 software t-test. The same procedure was used for the other two experiments: PBS–caffeine buffer and PBS–caffeine buffer with 100 mM CaCl2 or PBS–caffeine buffer and PBS–caffeine buffer with 50 mM MgCl2. (A) Blood was collected in PBS–caffeine buffer or PBS–caffeine buffer supplemented with 50 mM CaCl2. One hour after blood collection, the blood buffer mixture was centrifuged at 1000 rpm (180× g) at 10 °C for 5 min. (B) The comparison of enzyme activity when blood was collected in PBS–caffeine buffer or PBS–caffeine buffer supplemented with 50 mM CaCl2 (25.68 ± 12.47 vs. 10.93 ± 15.32 mAbs/min, p = 0.0729). (C) The comparison of enzyme activity when blood was collected in PBS–caffeine buffer or PBS–caffeine buffer supplemented with 100 mM CaCl2 (37.88 ± 4.544 vs. 8.171 ± 7.179 mAbs/min, p = 0.0038). (D) The microscopic observation of the amoebocyte degranulation process. As shown in the picture, more granules were increasingly released with increasing time in the presence of 100 mM CaCl2. (E) Blood was collected in PBS–caffeine buffer or PBS–caffeine buffer with 50 mM MgCl2. One hour later, the blood buffer mixture was centrifuged at 1000 rpm (180× g) at 10 °C for 5 min. (F) The comparison of enzyme activity when blood was collected in PBS–caffeine buffer or PBS–caffeine buffer supplemented with 50 mM MgCl2 (36.81 ± 2.47 vs. 36.2 ± 1.61 mAbs/min, p = 0.4216).
Figure 6
Figure 6
PBS–caffeine LAL functioned in the turbidimetric assay. Six milliliters of PBS–caffeine LAL was incubated with 240 µL of 1 M MgCl2 for 10 min, after which the mixture was divided into two parts (3 mL each). To one part of the LAL mixture, 100 µL of 30% NaCl was added; to the other part, 100 µL of LAL reagent water was added. After being shaken for 10 min, the mixture was lyophilized at −50 °C. The enzyme activity was tested via the turbidimetric method via a PKFLEX tube reader. (A) The onset time of the PBS–caffeine enzyme with or without NaCl at different concentrations of endotoxin; (B,C) Gels were formed 2 h after LAL was incubated with 0.0625, 0.125, 0.25, 0.5, or 1 Eu/mL endotoxin.

Similar articles

References

    1. Tamura H., Reich J., Nagaoka I. Outstanding Contributions of LAL Technology to Pharmaceutical and Medical Science: Review of Methods, Progress, Challenges, and Future Perspectives in Early Detection and Management of Bacterial Infections and Invasive Fungal Diseases. Biomedicines. 2021;9:536. doi: 10.3390/biomedicines9050536. - DOI - PMC - PubMed
    1. He S., Hang J.-P., Zhang L., Wang F., Zhang D.-C., Gong F.-H. A systematic review and meta-analysis of diagnostic accuracy of serum 1,3-β-D-glucan for invasive fungal infection: Focus on cutoff levels. J. Microbiol. Immunol. Infect. 2015;48:351–361. doi: 10.1016/j.jmii.2014.06.009. - DOI - PubMed
    1. Bloos F., Held J., Kluge S., Simon P., Kogelmann K., de Heer G., Kuhn S.-O., Jarczak D., Motsch J., Hempel G., et al. (1→ 3)-β-D-Glucan-guided antifungal therapy in adults with sepsis: The CandiSep randomized clinical trial. Intensive Care Med. 2022;48:865–875. doi: 10.1007/s00134-022-06733-x. - DOI - PMC - PubMed
    1. Tran T., Beal S.G. Application of the 1,3-β-D-Glucan (Fungitell) Assay in the Diagnosis of Invasive Fungal Infections. Arch. Pathol. Lab. Med. 2016;140:181–185. doi: 10.5858/arpa.2014-0230-RS. - DOI - PubMed
    1. Hamilton D.O., Lambe T., Howard A., Crossey P., Hughes J., Duarte R., Welters I.D. Can Beta-D-Glucan testing as part of the diagnostic pathway for invasive fungal infection reduce anti-fungal treatment costs? Med. Mycol. 2022;60:myac034. doi: 10.1093/mmy/myac034. - DOI - PMC - PubMed

LinkOut - more resources