. 2025 Jul 11;26(14):6659.
doi: 10.3390/ijms26146659.

Organ-Specific Small Protein Networks in 100 kDa Ultrafiltrates: Functional Analysis and Implications for Neuroregenerative Medicine

Affiliations

Organ-Specific Small Protein Networks in 100 kDa Ultrafiltrates: Functional Analysis and Implications for Neuroregenerative Medicine

Jakub Peter Slivka et al. Int J Mol Sci. .

Abstract

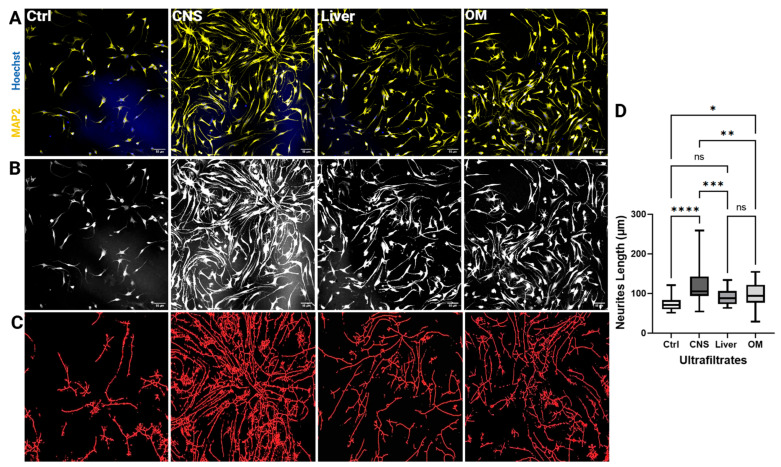
In this research, the proteomic landscape of 100 kDa protein extract sourced from rabbit brain was compared to extracts from liver and from organ mixture (OM). Our aim was to compare the efficacy of Nanomised Organo Peptides (NOP) ultrafiltrates from two different tissues and a tissue mixture for inducing neurite outgrowth, and subsequently to identify the molecular networks and proteins that could explain such effects. Proteins were isolated by gentle homogenization followed by crossflow ultrafiltration. Proteomic evaluation involved gel electrophoresis, complemented by mass spectrometry and bioinformatics. GO (Gene Ontology) and protein analysis of the mass spectrometry results identified a diverse array of proteins involved in critical specific biological functions, including neuronal development, regulation of growth, immune response, and lipid and metal binding. Data from this study are accessible from the ProteomeXchange repository (identifier PXD051701). Our findings highlight the presence of small proteins that play key roles in metabolic processes and biosynthetic modulation. In vitro outgrowth experiments with neural stem cells (NSCs) showed that 100 kDa protein extracts from the brain resulted in a greater increase in neurite length compared to the liver and organ mixture extracts. The protein networks identified in the NOP ultrafiltrates may significantly improve biological therapeutic strategies related to neural differentiation and outgrowth. This comprehensive proteomic analysis of 100 kDa ultrafiltrates revealed a diverse array of proteins involved in key biological processes, such as neuronal development, metabolic regulation, and immune response. Brain-specific extracts demonstrated the capacity to promote neurite outgrowth in NSCs, suggesting potential application for neuroregenerative therapies. Our findings highlight the potential of small proteins and organ-specific proteins in the development of novel targeted treatments for various diseases, particularly those related to neurodegeneration and aging.

Keywords: organ specificity; proteomics; small proteins; ultrafiltration.


Conflict of interest statement

Authors M.K.S.C. and M.B.F.W. affiliated with Stellar Biomolecular Research GmbH and EW European Wellness International GmbH are not involved in formal analysis and investigation. Author J.P.S. is an employee of the company Reviva s.r.o. Author C.B. was an employee of the company MicroDiscovery GmbH at the time of preparing and writing of the manuscript. The remaining authors declare that the research was conducted in the absence of any commercial or financial relationships that could be construed as a potential conflict of interest. The authors have no other relevant affiliations or financial involvement with any organization or entity with a financial interest in or financial conflict with the subject matter or materials discussed in the manuscript apart from those disclosed.

Figures

Figure 1
Figure 1
Tris-Tricine-PAGE analysis of three independent samples of 100 kDa ultrafiltrates from the brain (CNS), liver (LI) and organ mixture (OM). The right side shows the M12 protein standard.
Figure 2
Figure 2
Venn diagram showing overlap of OM, liver and CNS proteins. Numbers represent the number of proteins that are present in two different samples, or in all samples.
Figure 3
Figure 3
Comparison of organelle-based distribution of proteins measured in this experiment with the general distribution of all proteins. (A) “All proteins” represents all known proteins for this species as provided by UniProt. “This Study” represents proteins measured in this experiment. To be able to compare the organelle-based distribution of the proteins from this study with all proteins relative values have been used, otherwise the comparison of the results would be inadequate. (B) The same distribution is now shown for each OSP100 (Liver, OM, CNS). LI: Liver, CNS: Brain, OM: Organ mix.
Figure 4
Figure 4
Significant GO terms. The heatmap depicts the significance of Gene Ontology (GO) terms across the various tissues. Each column represents a distinct organ or tissue, while rows correspond to specific GO terms. The intensity of each cell reflects the −log10 (p-value) of the enrichment for the GO term in that tissue. The darker the colors, the higher the enrichement. Only the highly significant terms (p < 1 × 10⁻⁵) are displayed. LI: Liver, CNS: Brain, OM: Organ mix.
Figure 5
Figure 5
Significant KEGG pathways. Heatmap of significantly enriched KEGG pathways (pFDR < 0.001) in different tissues. Columns represent organs or tissues, and rows correspond to KEGG pathways, with cell colors indicating −log10 transformed p-values. The darker the colors, the higher the enrichement. The analysis highlights pathways with significant enrichment in at least one tissue, revealing tissue-specific functional patterns. LI: Liver, CNS: Brain, OM: Organ mix.
Figure 6
Figure 6
Liver-specific protein analysis. (A) Heatmap showing the top 50 proteins with the highest differential expression (highest absolute log2 fold-change) between liver and other tissues. Proteins were included if detected in ≥33% of the liver samples and ≥33% of the other samples. The color intensity represents log-transformed LFQ intensities, with raw values (in millions) annotated. Gray indicates missing data. (B) Bar plot of the 10 most significant GO terms enriched in liver tissue, based on proteins with a fold-change > 2. Only proteins detected in this study were used as reference. The x-axis shows the enrichment p-value obtained by functional enrichment (logarithmic scale). (C) MA plot of liver tissue protein quantifications. The y-axis shows the log2 fold-change between liver and the other tissues, while the x-axis shows the sum of the log2 intensities, corresponding to the total protein abundance. The 10 proteins with the highest differential expression are labeled. LI: Liver, CNS: Brain, OM: Organ mix.
Figure 7
Figure 7
OM-specific protein analysis. (A) Heatmap showing the top 50 proteins with the highest differential expression (highest absolute log2 fold-change) between OM and other tissue samples. Proteins were included if detected in ≥33% of liver samples and in ≥33% of other samples. The color intensity represents log-transformed LFQ intensities, with raw values (in millions) annotated. Gray indicates missing data. (B) Bar plot of the 10 most significant GO terms enriched in OM samples, based on proteins with a fold-change > 2. Only proteins detected in this study were used as reference. The x-axis shows the enrichment p-value obtained by functional enrichment (on a logarithmic scale). (C) MA plot of OM protein quantifications. The y-axis shows the log2 fold-change between OM and the other tissues, while the x-axis shows the sum of the log2 intensities, corresponding to the total protein abundance. The 10 proteins with the highest differential expression are labeled. LI: Liver, CNS: Brain, OM: Organ mix.
Figure 8
Figure 8
Brain-specific protein analysis. (A) Heatmap showing the top 50 proteins with the highest differential expression (highest absolute log2 fold-change) between brain and other tissue samples. Proteins were included if detected in ≥33% of liver samples and ≥33% of the other samples. The color intensity represents log-transformed LFQ intensities, with raw values (in millions) annotated. Gray indicates missing data. (B) Bar plot of the 10 most significant GO terms enriched in brain tissue samples, based on proteins with a fold-change > 2. Only proteins detected in this study were used as reference. The x-axis shows the enrichment p-value obtained by functional enrichment (on a logarithmic scale). (C) MA plot of brain tissue protein quantification. The y-axis shows the log2 fold-change between brain and the other tissues, while the x-axis shows the sum of the log2 intensities, corresponding to the total protein abundance. The 10 proteins with the highest differential expression are labeled. LI: Liver, CNS: Brain, OM: Organ mix.
Figure 9
Figure 9
Heatmap of the top 50 small proteins expressed at high levels in all samples (<150 amino acids). Gray color indicates missing values (protein not measured). Protein quantification values are annotated in the cells (LFQ/1M). LI: Liver, CNS: Brain, OM: Organ mix.
Figure 10
Figure 10
Measurement of neurite length. (A) NSCs treated with ultrafiltrates (Ctrl, CNS, Liver, and OM) were immunostained for MAP2 (yellow), while the nuclei were stained with Hoechst 33,342 (blue). Scale bar: 50 μm. (B) Black and white micrographs showing the growth of neurites after treatment of NSCs with ultrafiltrates: Ctrl, CNS (brain), Liver, and OM (organ mixture). Scale bar: 50 µm. (C) Skeletonized micrographs for a zoomed-in view of NSCs in the figures shown in (B), the red color represents the branches of Neurons. (D) The boxplot shows the neurite length in μm of 30 different cells from each of the four groups (Ctrl, CNS, Liver, and OM). Measurements shown are the mean ± SD; *, p < 0.05; **, p < 0.01; ***, p < 0.001; ****, p < 0.0001; ns, not significant. OM: Organ Mix.

Similar articles

References

    1. Steinberg R., Koch H.-G. The Largely Unexplored Biology of Small Proteins in Pro- and Eukaryotes. FEBS J. 2021;288:7002–7024. doi: 10.1111/febs.15845. - DOI - PubMed
    1. Wang L., Wang N., Zhang W., Cheng X., Yan Z., Shao G., Wang X., Wang R., Fu C. Therapeutic Peptides: Current Applications and Future Directions. Signal Transduct. Target. Ther. 2022;7:48. doi: 10.1038/s41392-022-00904-4. - DOI - PMC - PubMed
    1. Zhou J., Liu K., Bauer C., Bendner G., Dietrich H., Slivka J.P., Wink M., Wong M.B.F., Chan M.K.S., Skutella T. Modulation of Cellular Senescence in HEK293 and HepG2 Cells by Ultrafiltrates UPla and ULu Is Partly Mediated by Modulation of Mitochondrial Homeostasis under Oxidative Stress. Int. J. Mol. Sci. 2023;24:6748. doi: 10.3390/ijms24076748. - DOI - PMC - PubMed
    1. Bhat Z.F., Kumar S., Bhat H.F. Bioactive Peptides of Animal Origin: A Review. J. Food Sci. Technol. 2015;52:5377–5392. doi: 10.1007/s13197-015-1731-5. - DOI - PMC - PubMed
    1. Morozov G., Khavinson V.K. Natural and Synthetic Thymic Peptides as Therapeutics for Immune Dysfunction. Int. J. Immunopharmacol. 1997;19:501–505. doi: 10.1016/S0192-0561(97)00058-1. - DOI - PubMed

LinkOut - more resources