. 2025 Jul 11;26(14):6675.
doi: 10.3390/ijms26146675.

LightSpot Fluorescent Conjugates as Highly Efficient Tools for Lysosomal P-gp Quantification in Olaparib-Treated Triple-Negative Breast Cancer Cells

Affiliations

LightSpot Fluorescent Conjugates as Highly Efficient Tools for Lysosomal P-gp Quantification in Olaparib-Treated Triple-Negative Breast Cancer Cells

Antoine Goisnard et al. Int J Mol Sci. .

Abstract

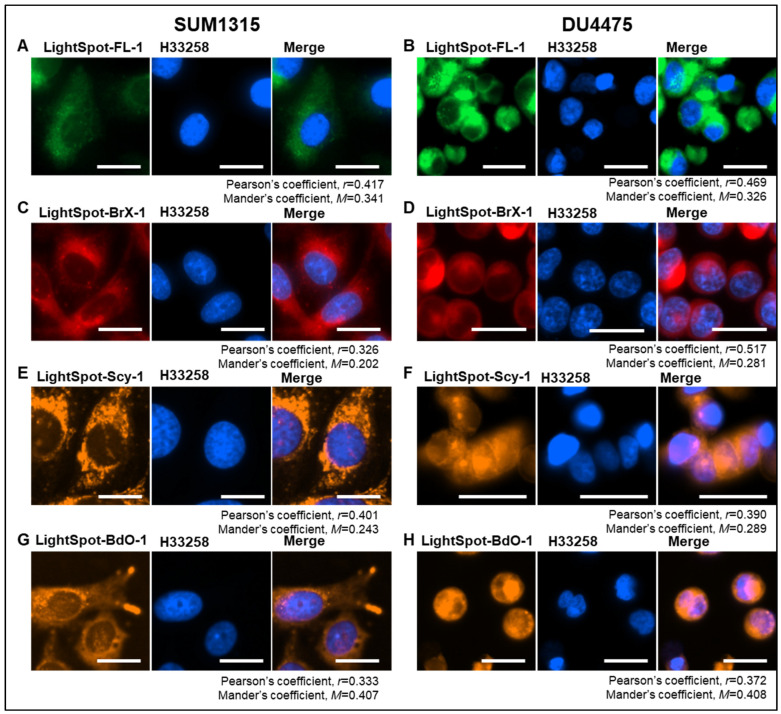
P-glycoprotein (P-gp) is a key element of cancer treatment resistance, actively extruding cytotoxic drugs from cells and diminishing their efficacy. While its role at the plasma membrane is well established, its intracellular localization, particularly on lysosomes, is increasingly recognized as a critical contributor to drug resistance. This study investigates four innovative LightSpot fluorescent compounds to detect and quantify both membrane and lysosomal P-gp in Triple-Negative Breast Cancer (TNBC) SUM1315 and DU4475 cell lines. Results highlighted lysosomal P-gp staining by the LightSpot-FL-1, LightSpot-BrX-1, and LightSpot-BdO-1 fluorescent compounds (Mander's coefficients > 0.8 overlapping with LAMP2 immunostaining). After both cell lines were exposed to Olaparib, a significant increase in P-gp expression level and lysosomal distribution of P-gp was detected. Indeed, after 100 µM Olaparib exposure, LightSpot-FL-1 allowed us to quantify an increase in P-gp-positive lysosome number of 1293 and 334% for SUM1315 and DU4475 cells, respectively, compared to the control. Findings suggest that P-gp may relocate to lysosomes upon drug exposure, highlighting a dual resistance mechanism involving both membrane and lysosomal P-gp. This study demonstrated the potential of LightSpot fluorescent compounds to evaluate P-gp-mediated cell resistance to treatment and emphasized the need to assess global cell P-gp expression to improve cancer diagnosis.

Keywords: LightSpot fluorescent conjugates; lysosomal P-gp; multidrug resistance; permeability-glycoprotein; triple-negative breast cancer cell lines.


Conflict of interest statement

The authors declare no conflicts of interest.

Figures

Figure 1
Figure 1
Chemical structures of conjugates LightSpot-FL-1, LightSpot-BrX-1, LightSpot-Scy-1, and LightSpot-BdO-1. Bn, Cbz, and t-Bu abbreviations on the black peptidic scaffold represent benzyl, carbobenzyloxy, and tert-butyl groups, respectively. Fluorophores are shown in color.
Figure 2
Figure 2
Colocalization study between LightSpot fluorescent conjugates and lysosomal stainings. Cellular co-staining combining LightSpot-FL-1 (A,B), LightSpot-BrX-1 (C,D), LightSpot-Scy-1 (E,F), and LightSpot-BdO-1 (G,H), and anti-LAMP2 immunostaining, were realized in SUM1315 (A,C,E,F) and DU4475 (B,D,E,H) cells. For each case, merged images are presented next to the LightSpot and anti-LAMP2 staining images. Images were acquired with a Cytation™5MV multimodal plate reader (BioTek®, M = 40x, DAPI, GFP, Cy5, and RFP filters, scale bar = 20 µm). Pearson’s correlation (r) and Mander’s overlap (M) coefficients were calculated for each co-staining and are presented below images.
Figure 3
Figure 3
Colocalization study between LightSpot fluorescent conjugates and mitochondrial stainings. Cellular co-staining combining LightSpot-FL-1 (A,B), LightSpot-BrX-1 (C,D), LightSpot-Scy-1 (E,F), and LightSpot-BdO-1 (G,H), and anti-ATP5A immunostaining, were realized in SUM1315 (A,C,E,F) and DU4475 (B,D,E,H) cells. For each case, merged images are presented next to the LightSpot and anti-ATP5a staining images. Images were acquired with a Cytation™5MV multimodal plate reader (BioTek®, M = 40x, DAPI, GFP, Cy5, and RFP filters, scale bar = 20 µm). Pearson’s correlation (r), and Mander’s overlap (M) coefficients were calculated for each co-staining and are presented below images.
Figure 4
Figure 4
Colocalization study between LightSpot fluorescent conjugate staining and nuclear staining. Cellular co-staining combining LightSpot-FL-1 (A,B), LightSpot-BrX-1 (C,D), LightSpot-Scy-1 (E,F), and LightSpot-BdO-1 (G,H), and Hoechst 33,258 (H33258) nuclear staining were realized in SUM1315 (A,C,E,F) and DU4475 (B,D,E,H) cells. For each case, merged images are presented next to the LightSpot and H33258 staining images. Images were acquired with a Cytation™5MV multimodal plate reader (BioTek®, M = 40x, DAPI, GFP, Cy5, and RFP filters, scale bar = 20 µm). Pearson’s correlation (r), and Mander’s overlap (M) coefficients were calculated for each co-staining and are presented below images.
Figure 5
Figure 5
Validation of LightSpot fluorescent conjugate specificity using P-gp siRNAs in TNBC SUM1315 and DU4475 cell lines. To evaluate the specificity of the 4 conjugates, cells were exposed for 72 h to either no additional reagent (control), P-gp siRNAs, scrambled RNAs (scr RNA), or Lipofectamine2000 alone (LP2000). After PFA fixation, SUM1315 and DU4475 cells were stained with LightSpot-FL-1 (A), LightSpot-BrX-1 (D), LightSpot-Scy-1 (G), or LightSpot-BdO-1 (J) conjugates and imaged with Cytation™5MV (BioTek®, M = 40x, GFP, Cy5, and RFP filters, scale bar = 50 µm). Mean cellular fluorescence intensity on images was quantified using Gen5 software (BioTek®) in SUM1315 cells after LightSpot-FL-1 (B), LightSpot-BrX-1 (E), LightSpot-Scy-1 (H), or LightSpot-BdO-1 (K) staining and in DU4475 cells after LightSpot-FL-1 (C), LightSpot-BrX-1 (F), LightSpot-Scy-1 (I), or LightSpot-BdO-1 (L) staining. Data are presented on graphs as mean ± SD. Significance was determined by one-way ANOVA, ns p > 0.05, **** p < 0.0001.
Figure 6
Figure 6
Impact of OLA treatment on lysosome number in SUM1315 and DU4475 cell lines. SUM1315 cells were exposed to 0 (DMSO control), 10, 50, and 100 µM OLA doses for 3 h. After treatment, the number of lysosomes per cell was analyzed for each OLA treatment dose. For this, anti-LAMP2 immunostaining was imaged using Cytation™5MV automate (BioTek®, M = 40x, DAPI filter, scale bar = 20 µm) for SUM1315 (A) and DU4475 cells (D). Mean cell fluorescence intensity was calculated with Gen5 software (BioTek®) for SUM1315 (B) and DU4475 (E) cells. The average number of lysosomes (LAMP2-positive spots) per cell was calculated using Icy software (2.4.2.0 version) for SUM1315 (C) and DU4475 (F) cells. Significance was determined by one-way ANOVA, ns p > 0.05, ** p < 0.01, *** p < 0.001, **** p < 0.0001.
Figure 7
Figure 7
Impact of OLA treatment on lysosomal P-gp-mediated resistance in the SUM1315 cell line. SUM1315 cells were exposed to 0 (DMSO control), 10, 50, and 100 µM OLA doses for 3 h. After treatment, P-gp was stained with LightSpot fluorescent conjugates in PFA-fixed SUM1315 cells for each treatment condition. Fluorescent P-gp staining was acquired with Cytation™5MV (BioTek®, M = 40x, GFP, Cy5, and RFP filters, scale bar = 20 µm) cells for each LightSpot-FL-1 (A), LightSpot-BrX-1 (E), and LightSpot-BdO-1 (I) conjugate. Mean cell fluorescence intensity was calculated with Gen5 software (BioTek®) for LightSpot-FL-1 (B), LightSpot-BrX-1 (F), and LightSpot-BdO-1 (J). Fluorescence intensity data are presented on graphs as mean ± SD. Intracellular fluorescent spots of LightSpot staining were counted using Icy software. Average fluorescent spot number per cell is presented on graphs as mean ±  SD for LightSpot-FL-1 (C), LightSpot-BrX-1 (G), and LightSpot-BdO-1 (K) conjugates. Colocalization studies between LightSpot conjugates and anti-LAMP2 immunostaining were conducted for each treatment condition. For this, Pearson’s and Mander’s coefficients were calculated for LightSpot-FL-1 (D), LightSpot-BrX-1 (H), and LightSpot-BdO-1 (L) conjugates. Coefficients are presented as a heat map. Significance was determined by one-way ANOVA, ns p > 0.05, * p < 0.05, *** p < 0.001, **** p < 0.0001.
Figure 8
Figure 8
Impact of OLA treatment on lysosomal P-gp-mediated resistance in the DU4475 cell line. DU4475 cells were exposed to 0 (DMSO control), 10, 50, and 100 µM OLA doses for 3 h. After treatment, P-gp was stained with LightSpot fluorescent conjugates in PFA-fixed DU4475 cells for each treatment condition. Fluorescent P-gp staining was acquired with Cytation™5MV (BioTek®, M = 40x, GFP, Cy5, and RFP filters, scale bar = 20 µm) cells for each LightSpot-FL-1 (A), LightSpot-BrX-1 (E), and LightSpot-BdO-1 (I) conjugate. Mean cell fluorescence intensity was calculated with Gen5 software (BioTek®) for LightSpot-FL-1 (B), LightSpot-BrX-1 (F), and LightSpot-BdO-1 (J). Otherwise, intracellular fluorescent spots of LightSpot staining were counted using Icy software. Average fluorescent spot number per cell is presented on graphs as mean ±  SD for LightSpot-FL-1 (C), LightSpot-BrX-1 (G), and LightSpot-BdO-1 (K) conjugates. Colocalization studies between LightSpot conjugates and anti-LAMP2 immunostaining were conducted for each treatment condition. For this, Pearson’s and Mander’s coefficients were calculated for LightSpot-FL-1 (D), LightSpot-BrX-1 (H), and LightSpot-BdO-1 (L) conjugates. Coefficients are presented as a heat map. Significance was determined by one-way ANOVA, **** p < 0.0001.

Similar articles

References

    1. Bukowski K., Kciuk M., Kontek R. Mechanisms of Multidrug Resistance in Cancer Chemotherapy. Int. J. Mol. Sci. 2020;21:3233. doi: 10.3390/ijms21093233. - DOI - PMC - PubMed
    1. Sarkadi B., Homolya L., Szakács G., Váradi A. Human Multidrug Resistance ABCB and ABCG Transporters: Participation in a Chemoimmunity Defense System. Physiol. Rev. 2006;86:1179–1236. doi: 10.1152/physrev.00037.2005. - DOI - PubMed
    1. Robey R.W., Pluchino K.M., Hall M.D., Fojo A.T., Bates S.E., Gottesman M.M. Revisiting the Role of ABC Transporters in Multidrug-Resistant Cancer. Nat. Rev. Cancer. 2018;18:452–464. doi: 10.1038/s41568-018-0005-8. - DOI - PMC - PubMed
    1. Leonard G.D., Fojo T., Bates S.E. The Role of ABC Transporters in Clinical Practice. Oncologist. 2003;8:411–424. doi: 10.1634/theoncologist.8-5-411. - DOI - PubMed
    1. Lin J.H., Yamazaki M. Role of P-Glycoprotein in Pharmacokinetics: Clinical Implications. Clin. Pharmacokinet. 2003;42:59–98. doi: 10.2165/00003088-200342010-00003. - DOI - PubMed

MeSH terms

LinkOut - more resources