. 2025 Jul 21;26(14):7001.
doi: 10.3390/ijms26147001.

Vitamin D3 Modulates Inflammatory and Antimicrobial Responses in Oral Epithelial Cells Exposed to Periodontitis-Associated Bacteria

Affiliations

Vitamin D3 Modulates Inflammatory and Antimicrobial Responses in Oral Epithelial Cells Exposed to Periodontitis-Associated Bacteria

Fadime Karaca et al. Int J Mol Sci. .

Abstract

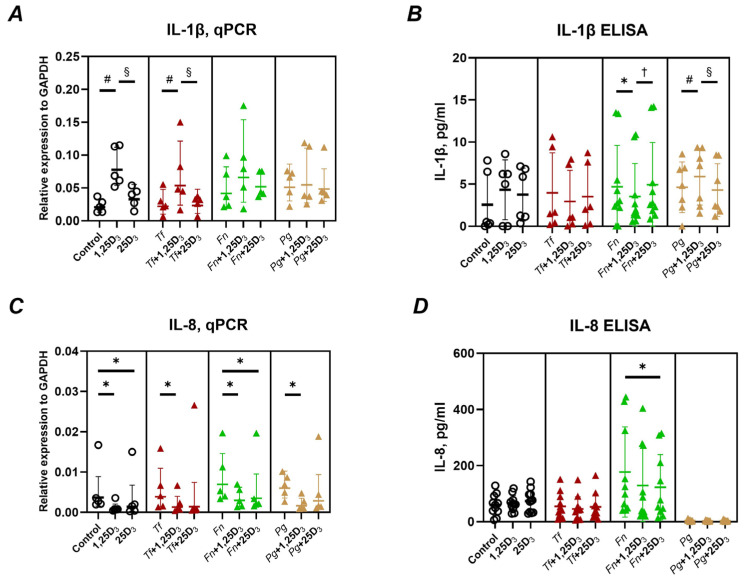
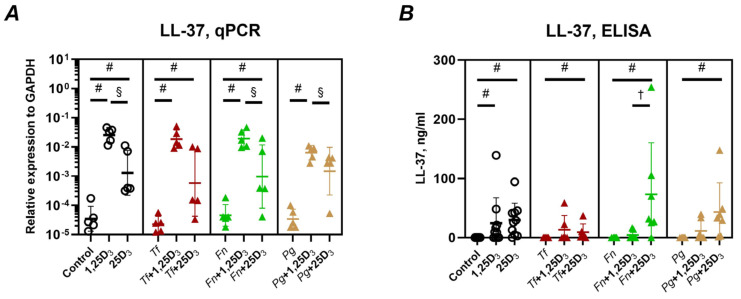
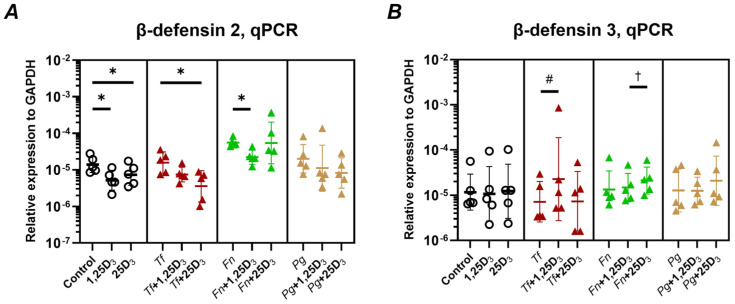
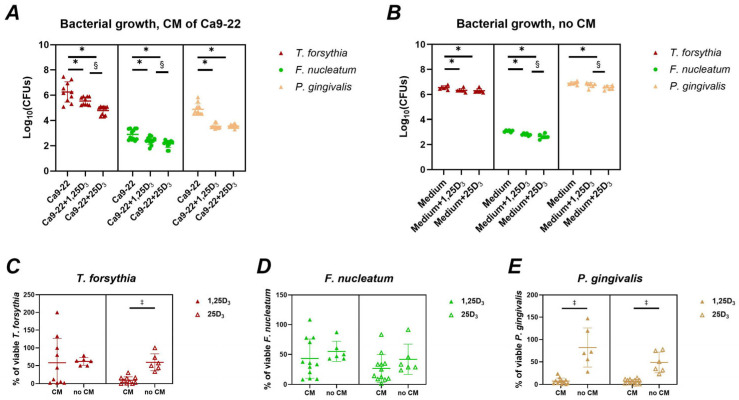
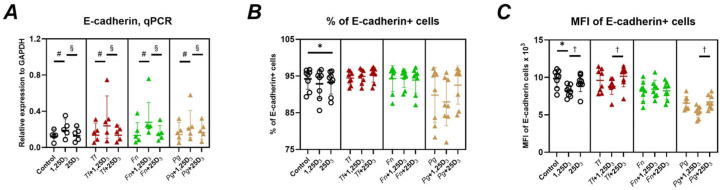
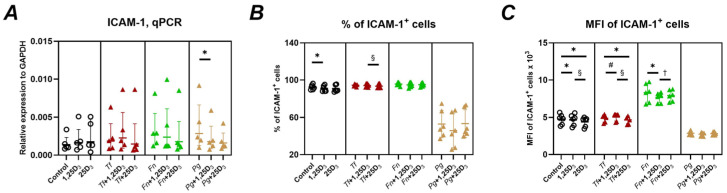
The oral epithelium is essential for maintaining oral health and plays a key role in the onset and progression of periodontitis. It serves as both a mechanical and immunological barrier and possesses antimicrobial activity. Vitamin D3, a hormone with known immunomodulatory functions, may influence oral epithelial responses. This study investigated the effects of two vitamin D3 metabolites on key immunological and antimicrobial functions of oral epithelial cells, both under basal conditions and during bacterial challenge. Ca9-22 oral epithelial cells were treated with 1,25(OH)2D3 or 25(OH)D3 in the presence or absence of Tannerella forsythia, Fusobacterium nucleatum, or Porphyromonas gingivalis. Inflammatory responses were assessed by measuring gene and protein expression of IL-1β and IL-8. Antimicrobial activity was evaluated via expression of LL-37, hBD-2, and hBD-3, as well as direct bacterial killing assays. Expression of epithelial integrity markers E-cadherin and ICAM-1 was also analyzed. Vitamin D3 metabolites reduced IL-8 expression and significantly increased LL-37 expression and production in Ca9-22 cells. Both forms enhanced antimicrobial activity against all tested pathogens and modulated epithelial integrity markers. Vitamin D3 positively regulates antimicrobial and barrier functions in oral epithelial cells, suggesting a potential role in supporting oral health and preventing periodontitis progression.

Keywords: Fusobacterium nucleatum; Porphyromonas gingivalis; Tannerella forsythia; antimicrobial activity; antimicrobial peptides; inflammation; oral epithelium; vitamin D3.


Conflict of interest statement

The authors declare no conflicts of interest. The funders had no role in the design of the study; in the collection, analyses, or interpretation of data; in the writing of the manuscript; or in the decision to publish the results.

Figures

Figure 1
Figure 1
Effect of different vitamin D3 metabolites on the gene expression and production of inflammatory mediators in Ca9-22 cells. Ca9-22 cells were treated with 10 nmol/L of either 1,25(OH)2D3 or 25(OH)D3 for 24 h. Treatments were performed in both uninfected cells (circle) and cells infected with T. forsythia (red triangles), F. nucleatum (green triangles), or P. gingivalis (yellow triangles) at an MOI of 50. Following treatment, the gene expression and protein levels of IL-1β (A,B) and IL-8 (C,D) were assessed using qPCR and ELISA, respectively. Panels (A,C) show the gene expression relative to that of GAPDH calculated by the 2−ΔCt method. Panels (B,D) represent the concentrations of the corresponding proteins in the conditioned media after treatment and infection, respectively. Each data point represents an individual experiment; lines and error bars indicate the mean and SD, respectively. Symbols indicate statistically significant differences (p < 0.05). *—significantly reduced gene expression or protein production following vitamin D3 metabolite treatment. #—significantly increased gene expression following vitamin D3 metabolite treatment. §—significantly increased gene expression after the treatment with 1,25(OH)2D3 compared to 25(OH)D3. —significantly decreased gene expression after the treatment with 1,25(OH)2D3 compared to 25(OH)D3.
Figure 2
Figure 2
Effect of vitamin D3 metabolites on the gene expression and production of cathelicidin antimicrobial peptide LL-37 in Ca9-22 cells. Ca9-22 cells were treated with 10 nmol/L of either 1,25(OH)2D3 or 25(OH)D3 for 24 h. Treatments were applied to both uninfected cells (circle) and cells infected with T. forsythia (red triangles), F. nucleatum (green triangles), or P. gingivalis (yellow triangles) at an MOI of 50. Following treatment, the gene expression and protein production of cathelicidin antimicrobial peptide (CAMP, LL-37) were measured by qPCR and ELISA, respectively. Panel (A) shows the gene expression relative to that of GAPDH calculated by the 2−ΔCt method. Panel (B) displays the concentration of LL-37 in the conditioned media after treatment. Each data point represents an individual experiment; lines and error bars indicate the mean and SD, respectively. Symbols indicate statistically significant differences (p < 0.05). #—significantly increased gene expression after vitamin D3 metabolite treatment §—significantly increased gene expression after treatment with 1,25(OH)2D3 compared to 25(OH)D3. —significantly lower peptide production after treatment with 1,25(OH)2D3 compared to 25(OH)D3.
Figure 3
Figure 3
Effect of vitamin D3 metabolites on the gene expression and production of β-defensins in Ca9-22 cells. Ca9-22 cells were treated with 10 nmol/L of either 1,25(OH)2D3 or 25(OH)D3 for 24 h. Treatments were applied to both uninfected cells (circle) and cells infected with T. forsythia (red triangles), F. nucleatum (green triangles), or P. gingivalis (yellow triangles) at an MOI of 50. Following treatment, the gene expression of β-defensin 2 (A) and β-defensin-3 (B) was determined by qPCR. The gene expression relative to that of GAPDH was calculated by the 2−ΔCt method. Each data point represents an individual experiment; lines and error bars indicate the mean and SD, respectively. Symbols indicate statistically significant differences (p < 0.05). *—significantly lower gene expression following vitamin D3 metabolite treatment. #—significantly higher gene expression following vitamin D3 metabolite treatment. —significantly lower gene expression following the treatment with 1,25(OH)2D3 compared to 25(OH)D3.
Figure 4
Figure 4
Antimicrobial activity of vitamin D3 metabolites mediated by Ca9-22 cells. Panel (A) Ca9-22 cells were treated with 10 nmol/L of either 1,25(OH)2D3 or 25(OH)D3 for 24 h. Conditioned media (CM) were then collected and used to treat T. forsythia (red triangles), F. nucleatum (green triangles) or P. gingivalis (yellow triangles). Panel (B) Media containing 10 nmol/L of either 1,25(OH)2D3 or 25(OH)D3, but without CA9-22 cells (no CM), was used to treat T. forsythia, F. nucleatum or P. gingivalis. Following treatment, bacteria were plated on selective agar plates and incubated anaerobically for 24 h, followed by counting colony-forming units (CFUs). Panels (CE) Percentage of viable cells relative to the corresponding groups not treated with 1,25(OH)2D3 or 25(OH)D3. Each data point represents an individual experiment; lines and error bars indicate the mean and SD, respectively. Symbols denote statistically significant differences (p < 0.05). *—significantly lower CFU counts following treatment with vitamin D3 metabolites. §—significantly higher CFUs counts after treatment with 1,25(OH)2D3 or 1,25(OH)2D3-conditioned media compared to 25(OH)D3. —significantly different % of live bacteria between treatment with and without CM.
Figure 5
Figure 5
Effect of vitamin D3 metabolites on E-cadherin gene and surface protein expression in Ca9-22 cells. Ca9-22 cells were treated with 10nmol/L of either 1,25(OH)2D3 or 25(OH)D3 for 24 h. Treatments were performed on uninfected cells (circle) and cells infected with T. forsythia (red triangles), F. nucleatum (green triangles), or P. gingivalis (yellow triangles) at an MOI of 50. Following treatment, the expression of the E-cadherin gene and surface protein levels were assessed by qPCR and flow cytometry, respectively. Panel (A): Gene expression relative to that of GAPDH calculated by the 2−ΔCt method. Panel (B):—Percentage of Ca9-22 cells positive for E-cadherin (E-cadherin+ cells). Panel (C): Mean fluorescence intensities (MFI) of E-cadherin on positive CA9-22 cells. Each data point represents an individual experiment; lines and error bars indicate the mean and SD, respectively. Statistical significance (p < 0.05) is indicated as follows: *—significantly decreased percentage of E-cadherin+ cells or MFI after treatment with vitamin D3 metabolites. #—significantly increased gene expression following vitamin D3 metabolite treatment. §—significantly higher gene expression after treatment with 1,25(OH)2D3 compared to 25(OH)D3. —significantly decreased MFI of E-cadherin+ cells after treatment with 1,25(OH)2D3 compared to 25(OH)D3.
Figure 6
Figure 6
Effect of vitamin D3 metabolites on ICAM-1 gene and surface protein expression in Ca9-22 cells. Ca9-22 cells were treated with 10 nmol/L of either 1,25(OH)2D3 or 25(OH)D3 for 24 h. Treatments were performed on uninfected cells (circle) and cells infected with T. forsythia (red triangles), F. nucleatum (green triangles), or P. gingivalis (yellow triangles) at an MOI of 50. Following treatment, the production of ICAM-1 gene and surface protein was assessed by qPCR and flow cytometry, respectively. Panel (A): Gene expression relative to that of GAPDH calculated by the 2−ΔCt method. Panel (B): Percentage of Ca9-22 cells positive for ICAM-1 (ICAM-1+ cells). Panel (C): Mean fluorescence intensities (MFI) of E-cadherin on positive CA9-22 cells. Each data point represents an individual experiment; lines and error bars indicate the mean and SD, respectively. Statistical significance (p < 0.05) is indicated as follows: *—significantly decreased ICAM-1 gene expression, percentage of ICAM-1+ cells or MFI of ICAM-1+ cells after vitamin D3 metabolite treatment. #—significantly increased MFI of ICAM-1+ cells following vitamin D3 metabolite treatment. §—significantly higher percentage of ICAM-1+ cells or MFI of ICAM-1+ cells after treatment with 1,25(OH)2D3 compared to 25(OH)D3. —significantly lower percentage of ICAM-1+ cells or MFI of ICAM-1+ cells after treatment with 1,25(OH)2D3 compared to 25(OH)D3.

Similar articles

References

    1. Deo P.N., Deshmukh R. Oral microbiome: Unveiling the fundamentals. J. Oral Maxillofac. Pathol. 2019;23:122–128. doi: 10.4103/jomfp.JOMFP_304_18. - DOI - PMC - PubMed
    1. Hajishengallis G., Lamont R.J. Beyond the red complex and into more complexity: The polymicrobial synergy and dysbiosis (PSD) model of periodontal disease etiology. Mol. Oral Microbiol. 2012;27:409–419. doi: 10.1111/j.2041-1014.2012.00663.x. - DOI - PMC - PubMed
    1. Radaic A., Kapila Y.L. The oralome and its dysbiosis: New insights into oral microbiome-host interactions. Comput. Struct. Biotechnol. J. 2021;19:1335–1360. doi: 10.1016/j.csbj.2021.02.010. - DOI - PMC - PubMed
    1. Wade W.G. The oral microbiome in health and disease. Pharmacol. Res. 2013;69:137–143. doi: 10.1016/j.phrs.2012.11.006. - DOI - PubMed
    1. Kilian M., Chapple I.L., Hannig M., Marsh P.D., Meuric V., Pedersen A.M., Tonetti M.S., Wade W.G., Zaura E. The oral microbiome—An update for oral healthcare professionals. Br. Dent. J. 2016;221:657–666. doi: 10.1038/sj.bdj.2016.865. - DOI - PubMed

MeSH terms

LinkOut - more resources