. 2025 Jul 9;16(7):707.
doi: 10.3390/insects16070707.

Proteomic Responses of the Springtail Folsomia candida to Drought

Affiliations

Proteomic Responses of the Springtail Folsomia candida to Drought

Yang Wang et al. Insects. .

Abstract

Springtails are adapted to life in the pore space of soil, where humidity in moist soil is close to saturation. Drought is the most important limiting factor for springtails; however, their molecular and physiological adaptations to low humidity are not well understood. The present study explored the global proteomic drought response of the springtail, Folsomia candida (Isotomidae, Collembola). In relatively dry soil (-360 kPa), adult springtails initially lost body water but re-established the normal body water content over the following two weeks. Nano LC-MS/MS analysis identified a total of 1729 unique proteins. Proteomic analysis and pathway enrichment found that the proteome generally did not show a dramatic induction of proteins in response to drought stress. After an initial down-regulation of pathways related to metabolism and growth, these pathways gradually returned to the same levels as in moist soil. Other pathways such as the cytoskeleton pathway, which is important in cell proliferation and differentiation, were predominantly down-regulated throughout the experiment in drought-exposed animals, which correlated with essentially no somatic growth of the springtails in dry soil. This study facilitates the understanding of the consequences of climate change on soil functioning and fertility.

Keywords: Collembola; desiccation; metabolism; pathway analysis; protein regulation.


Conflict of interest statement

Author Steffen Y. Bak was employed by the International Flavors & Fragrances Inc. The remaining authors declare that the research was conducted in the absence of any commercial or financial relationships that could be construed as a potential conflict of interest.

Figures

Figure 1
Figure 1
The body dry mass (mean ± SE, n = 5) of Folsomia candida throughout the experiment. The green dot indicates the body dry mass at the start of the experiment. Blue points and the line represent animals exposed to control soil humidity (20% of dry mass; −2.4 kPa). Orange points represent animals exposed to dry soil treatment (6% of dry mass; −360 kPa). The body dry mass increased significantly over time in the control treatment (p < 0.001).
Figure 2
Figure 2
The body water content (mean ± SE, n = 5) of Folsomia candida throughout the experiment. The green dot indicates the initial body water content at the start of the experiment. Blue points represent animals exposed to control soil humidity (20% of dry mass; −2.4 kPa), while orange points and the line represent animals exposed to dry soil conditions (6% of dry mass; −360 kPa). Springtails exposed to dry soil initially had lower water content but increased water content more rapidly over time compared to the control group.
Figure 3
Figure 3
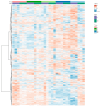
Heatmap of proteomic responses to the two soil water contents in time series. The time bar shows the days 1, 2, 5, 14, and 20 days in 5 different colors. SWC represents soil water content with two levels of 6 and 20 (percent of dry weight) using two colors. The value shows the range of fold changes of proteins in each replicate (down-regulated in blue, up-regulated in red). Each column in the heatmap is one biological replicate. n = three replicates for each treatment at each time point.
Figure 4
Figure 4
Volcano plots for differential proteins of drought group in time series. The five plots show differential abundances of proteins on days 1, 2, 5, 14, and 20, respectively. The criteria for fold change of proteins range less than log2(−1.5) = −0.585 and greater than log2(1.5) = 0.585 (left side of the left vertical dashed line and right side of the right vertical dashed line), and the criteria for −log10 FDR is 1.3 on the y-axis (equal and above the horizontal dashed line). The blue dots are down-regulated proteins with criteria (fold change ≤ −0.585, FDR < 0.05) and the red dots are up-regulated proteins with criteria (fold change ≥ 0.585, FDR < 0.05). The black dots are proteins that do not change (FDR > 0.05).
Figure 5
Figure 5
Changes in metabolic pathways in Folsomia candida under drought stress from day 1 to 20 with 8 metabolic pathways shown in different colors on days 1, 2, 5, 14, and 20. Each dot shows mean values of the pathway fold change each day. Black bars are standard deviations for fold change derived from differentially abundant proteins measured in each pathway (minimum 7 up to 157 proteins in a pathway). The asterisks represent significant fold changes in a pathway, compared to the control on specific days (“*” for p < 0.05, “**” for p < 0.01, “***” for p < 0.001).
Figure 6
Figure 6
Responsive pathways of Folsomia candida exposed to drought. Five essential pathways in this network are shown, including glycolysis/gluconeogenesis, TCA cycle, pentose phosphate pathway, butanoate metabolism, and fatty acid degradation. The five horizontally connected squares next to the protein name represent days 1, 2, 5, 14, and 20, respectively, and different colors in each square show the fold changes of up-regulated or down-regulated proteins in the pathways on each day, ranging from blue to red (−4.5 to 4.5). The green boxes indicate the names of carbohydrates, amino acids, and sugars in the pathways. Unidirectional and bidirectional arrows represent the steps as irreversible or reversible, respectively. The dashed arrows represent multiple steps in these biochemical processes.

References

    1. Potapov A.M., Guerra C.A., van den Hoogen J., Babenko A., Bellini B.C., Berg M.P., Chown S.L., Deharveng L., Kováč Ľ., Kuznetsova N.A., et al. Globally invariant metabolism but density-diversity mismatch in springtails. Nat. Commun. 2023;14:674. doi: 10.1038/s41467-023-36216-6. - DOI - PMC - PubMed
    1. Bødvarsson H. Alimentary studies of seven common soil-inhabiting Collembola of southern Sweden. Entomol. Scand. 1970;1:74–80.
    1. Ngosong C., Raupp J., Richnow H.H., Ruess L. Tracking Collembola feeding strategies by the natural C-13 signal of fatty acids in an arable soil with different fertilizer regimes. Pedobiologia. 2011;54:225–233. doi: 10.1016/j.pedobi.2011.02.004. - DOI
    1. Potapov A.A., Semenina E.E., Korotkevich A.Y., Kuznetsova N.A., Tiunov A.V. Connecting taxonomy and ecology: Trophic niches of collembolans as related to taxonomic identity and life forms. Soil Biol. Biochem. 2016;101:20–31. doi: 10.1016/j.soilbio.2016.07.002. - DOI
    1. Bardgett R.D., Chan K.F. Experimental evidence that soil fauna enhance nutrient mineralization and plant nutrient uptake in montane grassland ecosystems. Soil Biol. Biochem. 1999;31:1007–1014.

LinkOut - more resources