

Transcriptomic Insights into GABA Accumulation in Tomato via CRISPR/Cas9-Based Editing of SlGAD2 and SlGAD3
- PMID: 40725400
- PMCID: PMC12294585
- DOI: 10.3390/genes16070744
Transcriptomic Insights into GABA Accumulation in Tomato via CRISPR/Cas9-Based Editing of SlGAD2 and SlGAD3
Abstract
Background: γ-Aminobutyric acid (GABA) is a non-proteinogenic amino acid with key roles in plant metabolism, stress responses, and fruit nutritional quality. In tomato (Solanum lycopersicum), GABA levels are dynamically regulated during fruit development but decline in the late ripening stages.
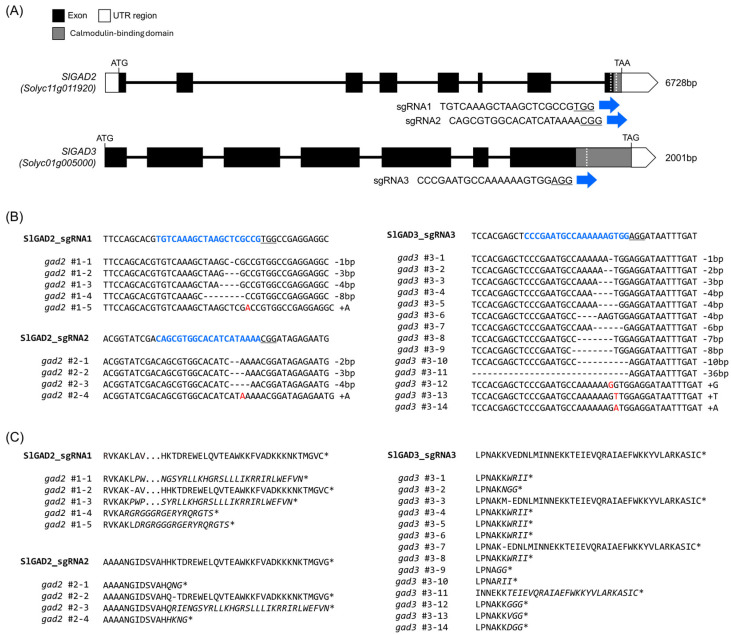
Methods: To enhance GABA accumulation, we used CRISPR/Cas9 to edit the calmodulin-binding domain (CaMBD) of SlGAD2 and SlGAD3, which encode glutamate decarboxylases (GADs). The resulting truncated enzymes were expected to be constitutively active. We quantified GABA content in leaves and fruits and performed transcriptomic analysis on edited lines at the BR+7 fruit stage.
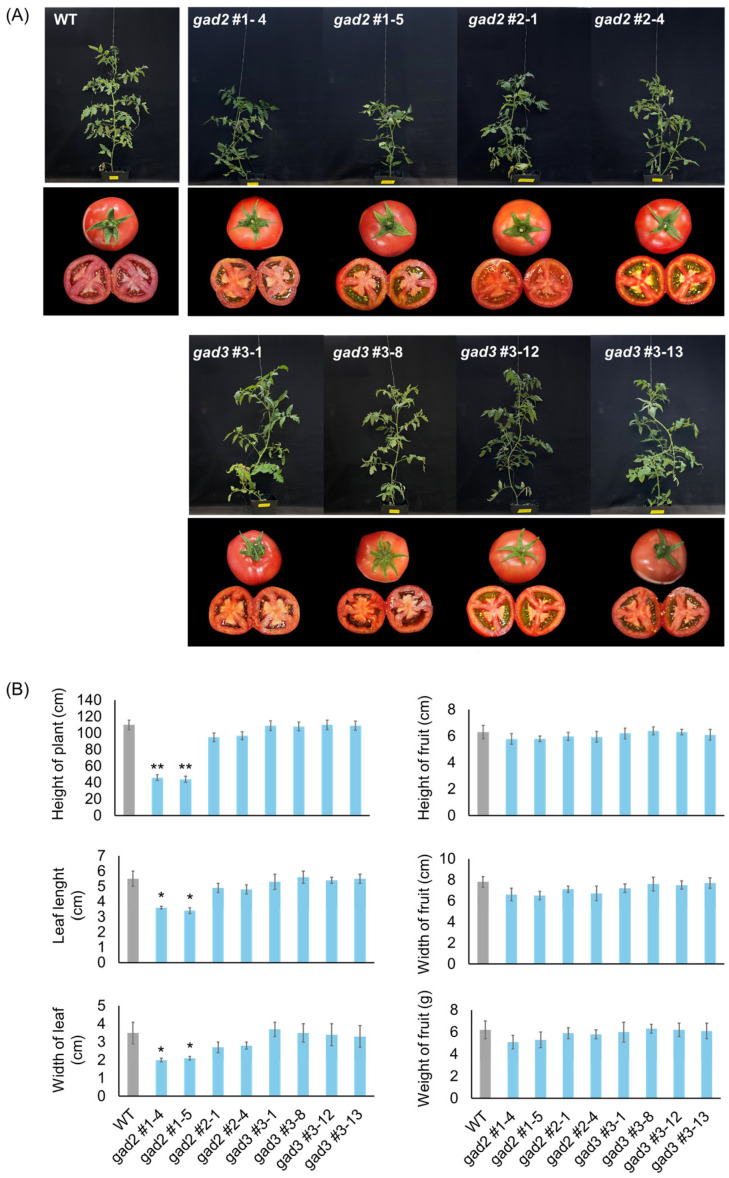
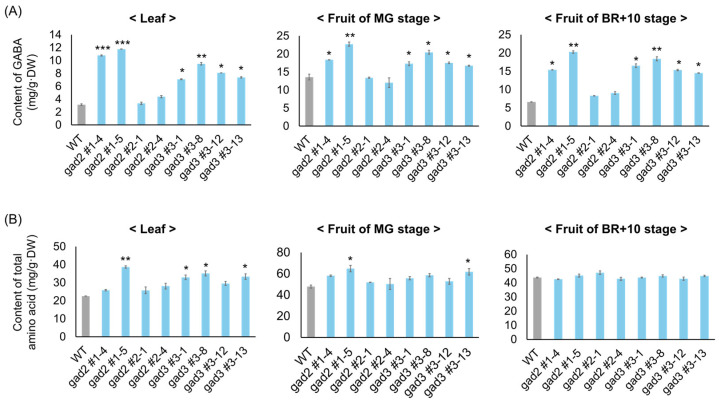
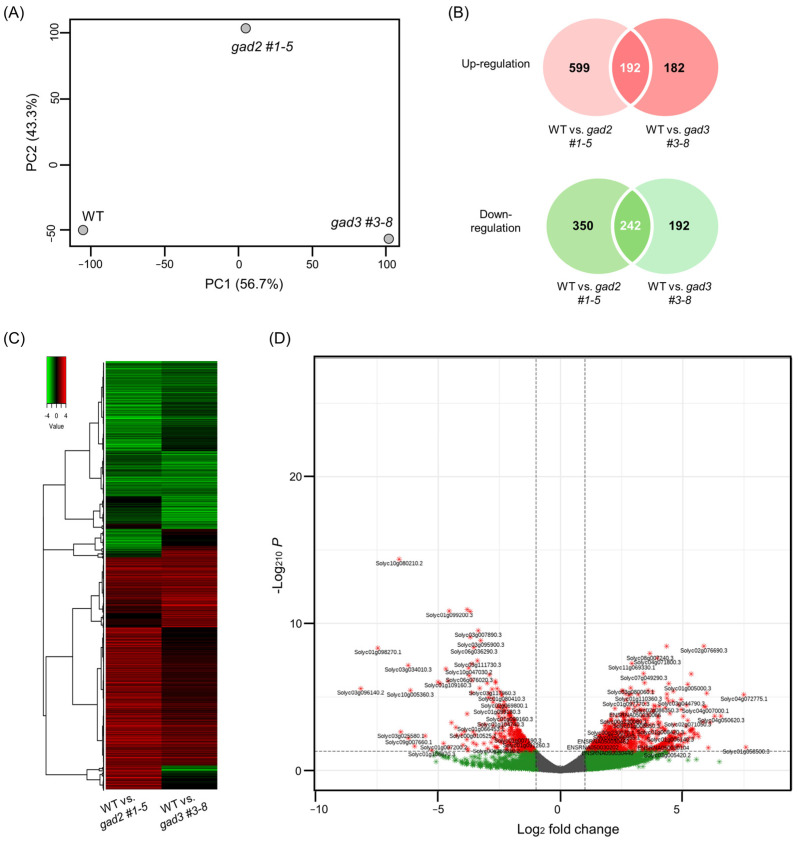
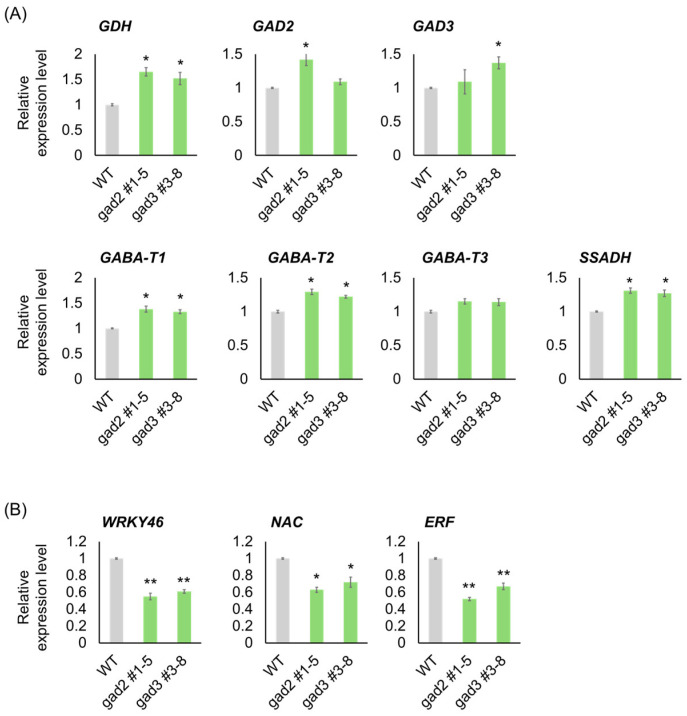
Results: CaMBD truncation significantly increased GABA levels in both leaves and fruits. In gad2 sg1 lines, GABA levels increased by 3.5-fold in leaves and 3.2-fold in BR+10 fruits; in gad3 sg3 lines, increases of 2.8- and 2.5-fold were observed, respectively. RNA-seq analysis identified 1383 DEGs in gad2 #1-5 and 808 DEGs in gad3 #3-8, with 434 DEGs shared across both lines. These shared DEGs showed upregulation of GAD, GABA-T, and SSADH, and downregulation of stress-responsive transcription factors including WRKY46, ERF, and NAC. Notably, total free amino acid content and fruit morphology remained unchanged despite elevated GABA.
Conclusions: CRISPR/Cas9-mediated editing of the CaMBD in SlGAD genes selectively enhances GABA biosynthesis in tomato without adverse effects on development or fruit quality. These lines offer a useful platform for GABA-centered metabolic engineering and provide insights into GABA's role in transcriptional regulation during ripening.
Keywords: CRISPR/Cas9; GABA; glutamate decarboxylase (GAD); metabolic engineering; tomato fruit; transcriptome.
Conflict of interest statement
The authors declare no conflicts of interest.
Figures
Similar articles
-
Tomato Glutamate Decarboxylase Genes SlGAD2 and SlGAD3 Play Key Roles in Regulating γ-Aminobutyric Acid Levels in Tomato (Solanum lycopersicum).Plant Cell Physiol. 2015 Aug;56(8):1533-45. doi: 10.1093/pcp/pcv075. Epub 2015 May 25. Plant Cell Physiol. 2015. PMID: 26009591
-
Efficient increase of ɣ-aminobutyric acid (GABA) content in tomato fruits by targeted mutagenesis.Sci Rep. 2017 Aug 1;7(1):7057. doi: 10.1038/s41598-017-06400-y. Sci Rep. 2017. PMID: 28765632 Free PMC article.
-
Activating glutamate decarboxylase activity by removing the autoinhibitory domain leads to hyper γ-aminobutyric acid (GABA) accumulation in tomato fruit.Plant Cell Rep. 2017 Jan;36(1):103-116. doi: 10.1007/s00299-016-2061-4. Epub 2016 Oct 4. Plant Cell Rep. 2017. PMID: 27704232
-
Gamma-Aminobutyric Acid: A Novel Biomolecule to Improve Plant Resistance and Fruit Quality.Plants (Basel). 2025 Jul 13;14(14):2162. doi: 10.3390/plants14142162. Plants (Basel). 2025. PMID: 40733399 Free PMC article. Review.
-
CRISPR/Cas genome editing in soybean: challenges and new insights to overcome existing bottlenecks.J Adv Res. 2025 Jul;73:53-72. doi: 10.1016/j.jare.2024.08.024. Epub 2024 Aug 18. J Adv Res. 2025. PMID: 39163906 Free PMC article. Review.
References
-
- Shimada M., Hasegawa T., Nishimura C., Kan H., Kanno T., Nakamura T., Matsubayashi T. Anti-hypertensive effect of γ-aminobutyric acid (GABA)-rich Chlorella on high-normal blood pressure and borderline hypertension in placebo-controlled double-blind study. Clin. Exp. Hypertens. 2009;31:342–354. doi: 10.1080/10641960902977908. - DOI - PubMed
MeSH terms
Substances
Grants and funding
LinkOut - more resources
Full Text Sources
Miscellaneous
