. 2025 Jun 27;16(7):756.
doi: 10.3390/genes16070756.

Differential Expression of Epstein-Barr Virus Sequences in Various Breast Cancer Subtypes

Affiliations

Differential Expression of Epstein-Barr Virus Sequences in Various Breast Cancer Subtypes

Alexander Blanchard et al. Genes (Basel). .

Abstract

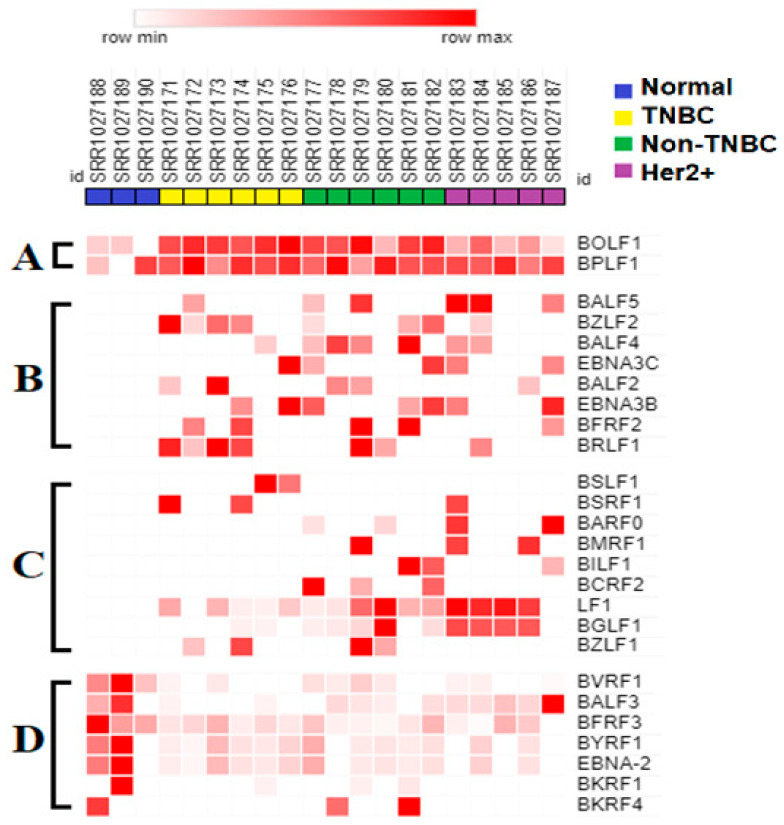
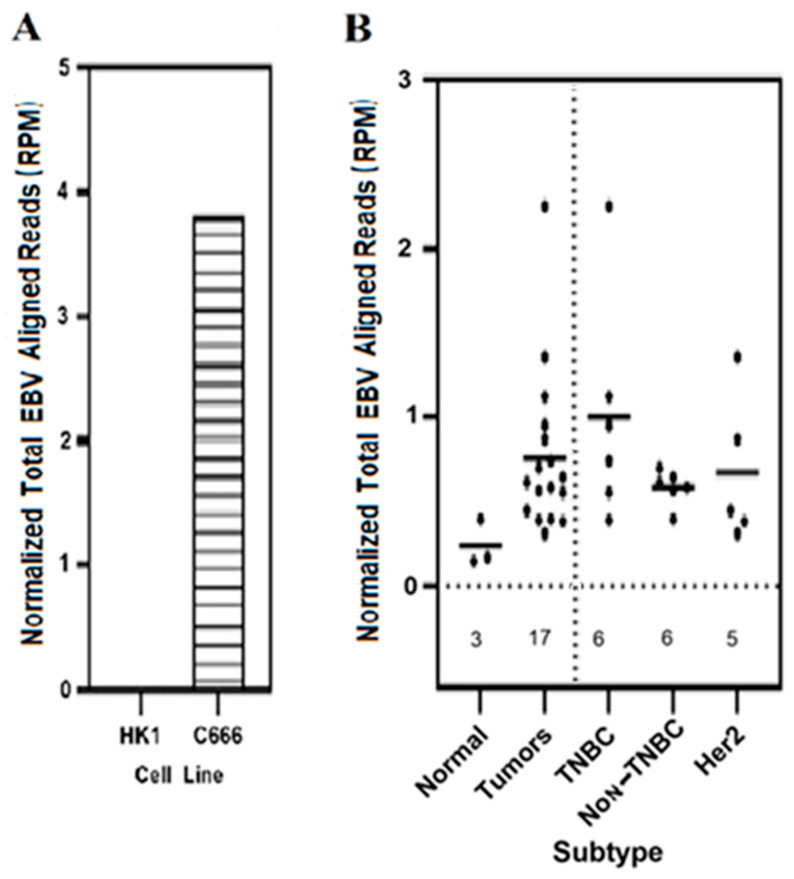
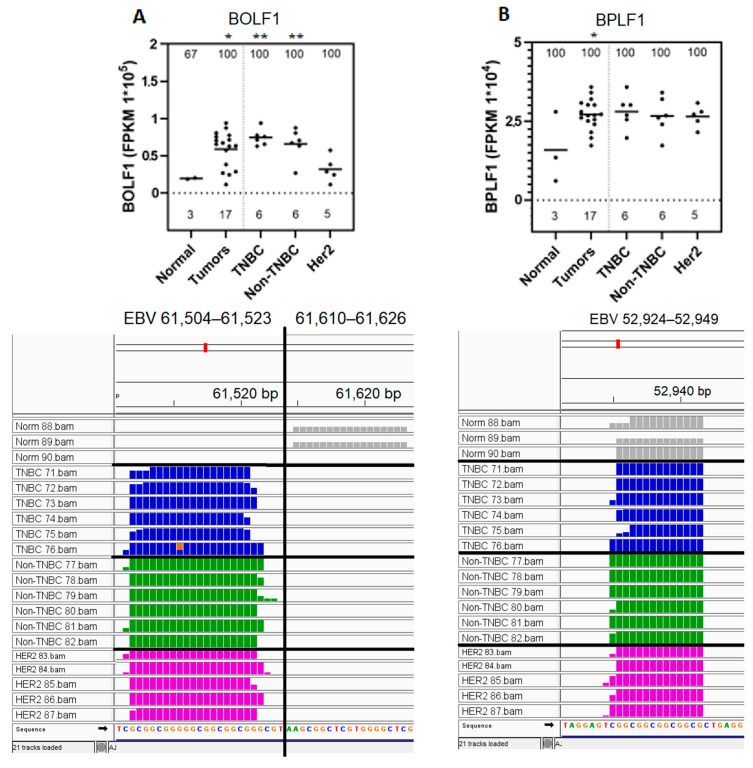
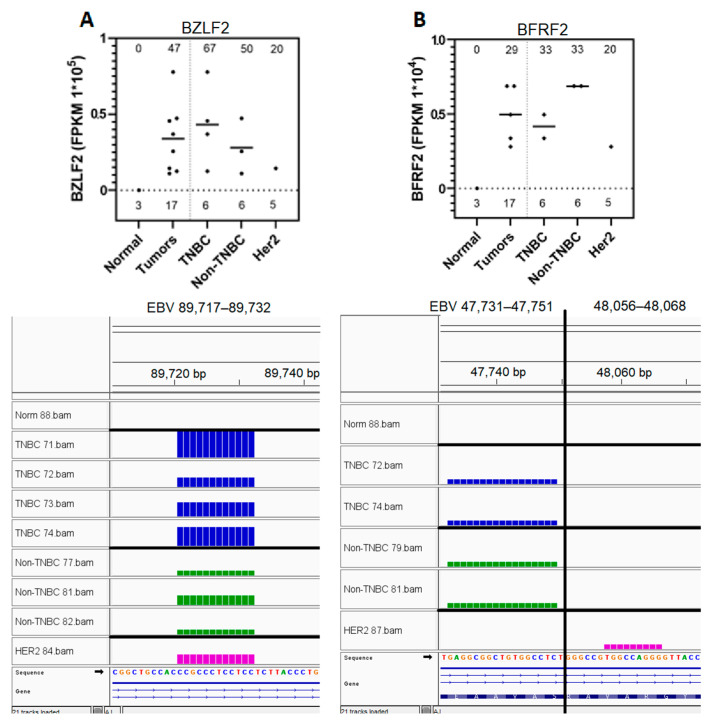
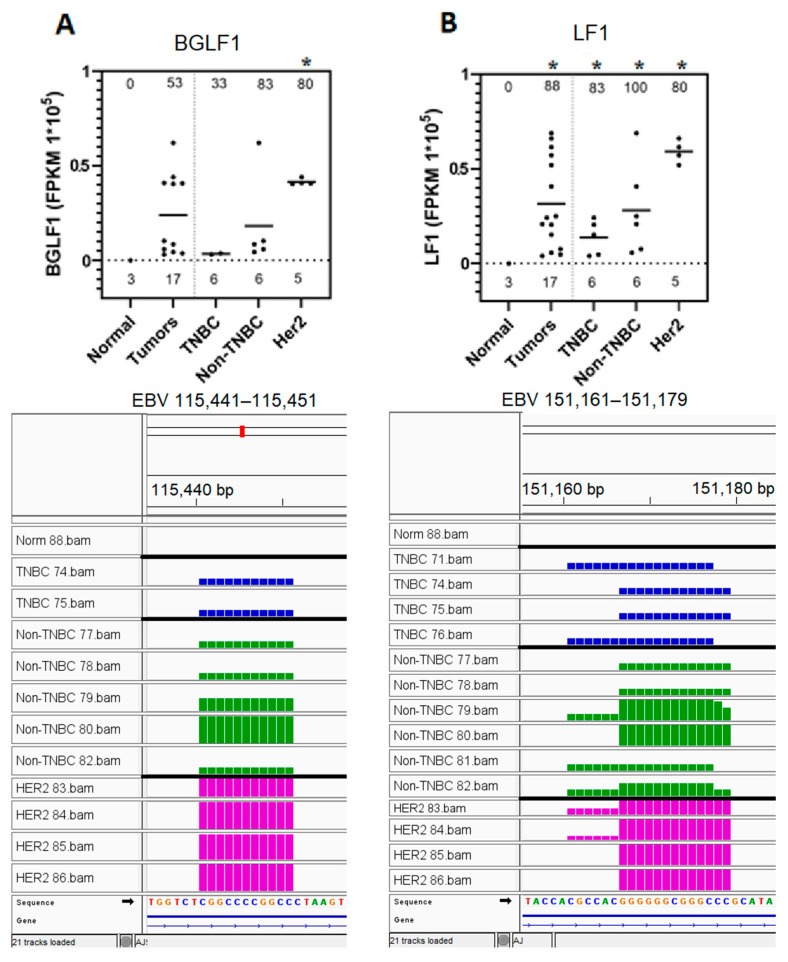
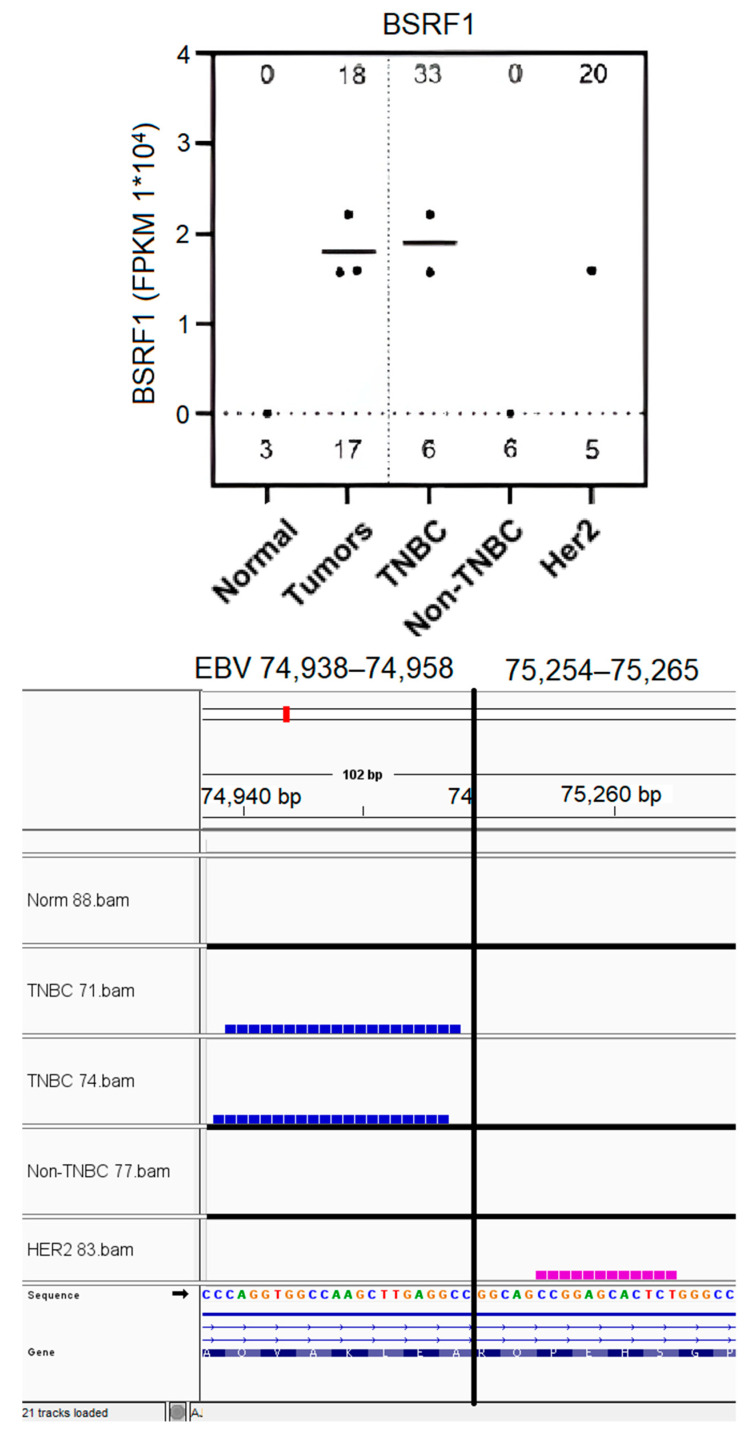
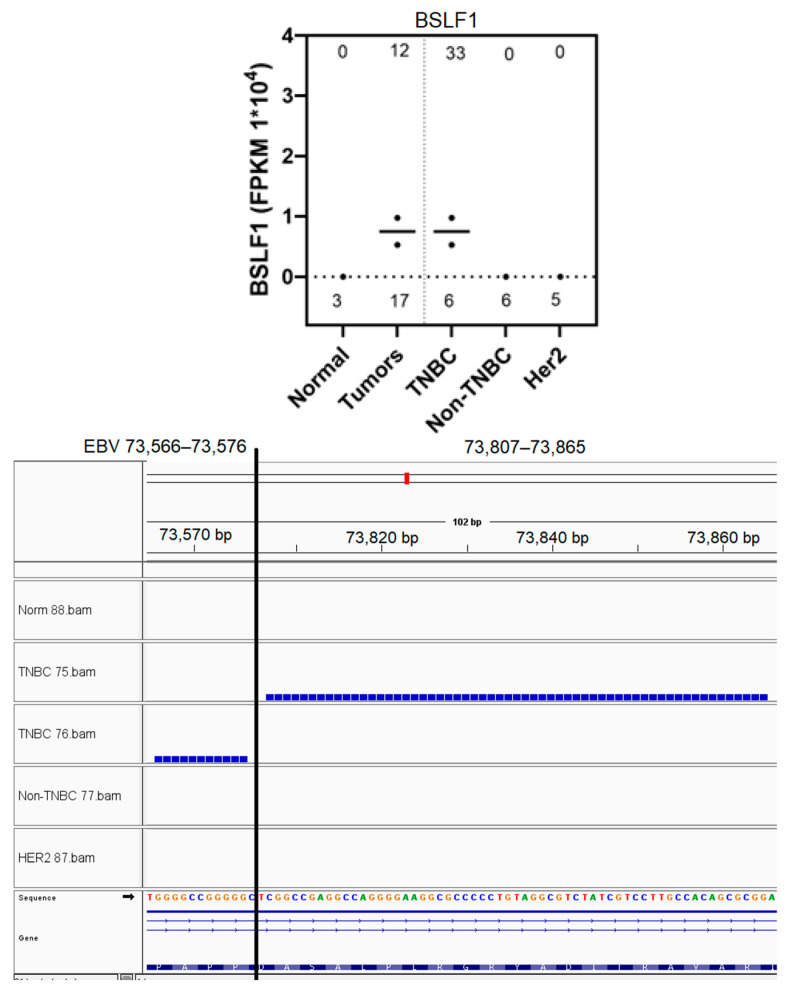
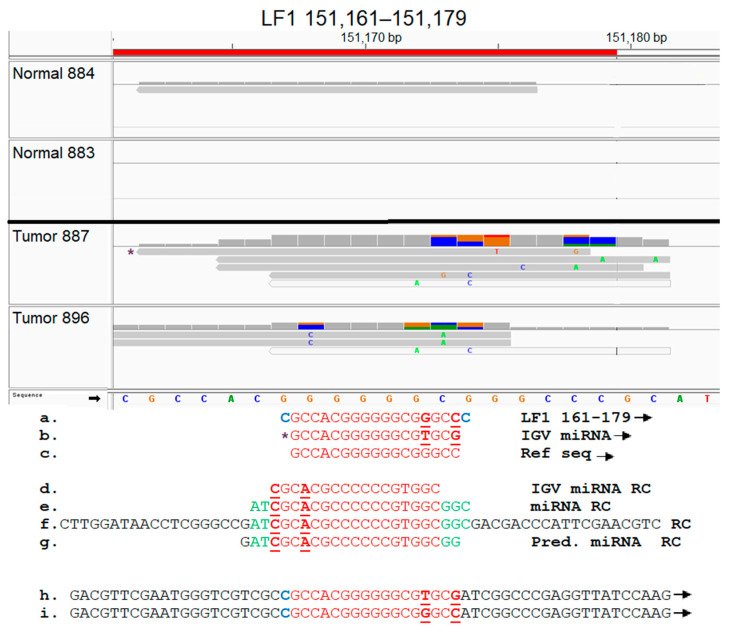
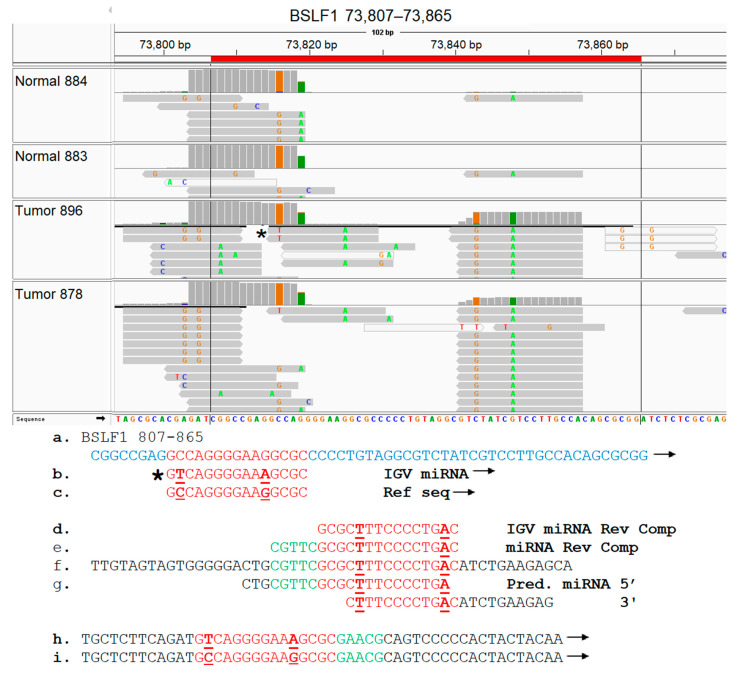
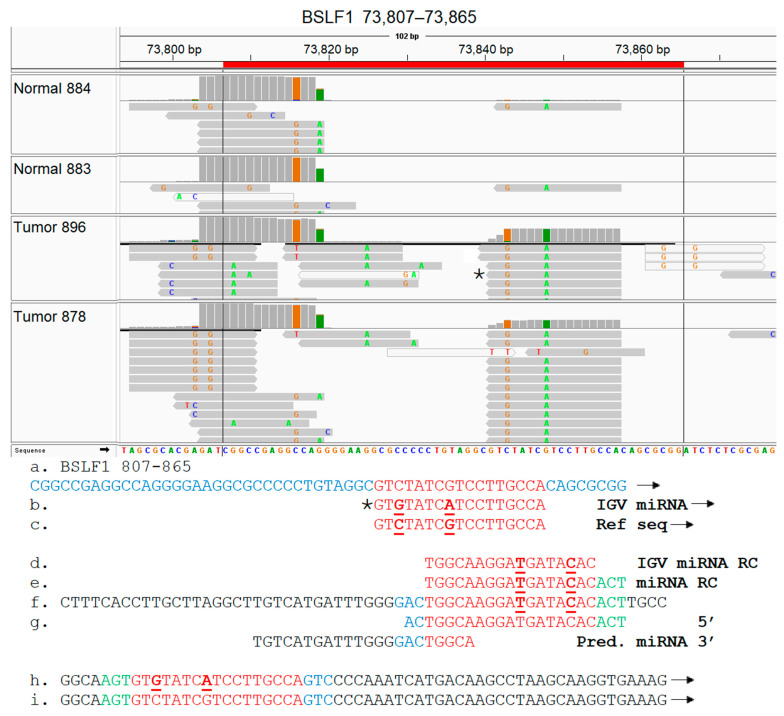
Background/Objectives: Breast cancer (BC) is the most common source of new cancer diagnoses among women and the second leading cause of cancer-related deaths in this group. The role of viral factors in the etiology, heterogeneity, and pathogenesis of this disease and its subtypes has not been incontrovertibly determined. Thus, in this study we began to address this problem by testing the hypothesis that the oncogenic Epstein-Barr virus (EBV) plays a role in this process. The approach involved determining the differential expression and predicted role of EBV gene sequences present in various subtypes of breast tumors as compared to those in control normal tissues. Methods: We utilized existing deep sequencing RNA-seq datasets derived from seventeen breast tumors and three control normal breast tissue samples to investigate the differential expression of EBV gene sequences. Results: We report three-fold higher levels of normalized total EBV-expressed sequences in tumors as compared to in control breast tissue. We also demonstrate differential expression of EBV gene transcript sequences in four categories of 26 known genes in breast cancer tumors as compared to that in normal breast tissue controls. Tumor-specific expression of EBV gene transcript sequences localized to seventeen genes; of these, tumor-specific EBV gene transcript-expressed sequences localizing to nine genes were strongly differentially expressed in a breast cancer subtype-specific manner. Furthermore, in a proof-of-concept investigation, we report, for the first time, that functional analysis of the differentially expressed integrated EBV transcript sequences demonstrate the capacity of these sequences to generate novel EBV miRNAs. We conclude that these integrated EBV sequences could potentially play a role in the pathogenesis of BC and its most aggressive subtypes. The functional role of these findings is currently under study.

Keywords: Epstein–Barr virus; HER2+ breast cancer; RNA-seq; bioinformatics; breast cancer; computational genomics; gene expression analysis; human gammaherpesvirus 4; triple-negative breast cancer; viral miRNA; viral oncogenesis.


Conflict of interest statement

The authors declare no conflicts of interest.

Figures

Figure 2
Figure 2
Expression of EBV gene transcript sequences in normal controls and in various breast cancer tumor subtypes. Trimmed raw RNA-seq reads from normal and various breast cancer subtypes (as shown in Figure 1B) were aligned against the EBV genome in FASTA format using OK. BAM file reads were assembled into transcripts and quantified by utilizing the StringTie tool and the EBV genome in gene feature format. A heat map depicting the relative quantity (in FPKM values) of the specific EBV gene transcript-expressed sequences is shown, and is stratified as follows: (A) EBV gene transcript sequences expressed in normal controls and tumors; (B) EBV gene transcript sequences expressed in all tumors but undetectable in normal control breast tissue; (C) EBV gene transcript sequences differentially expressed in the various breast cancer subtypes, but undetectable in normal controls; (D) EBV gene transcript sequences downregulated in the breast cancer tumor subtypes compared to in normal controls.
Figure 1
Figure 1
Quantitation of total EBV-expressed sequences in normal controls and in various breast cancer tumor subtypes. RNA-seq datasets obtained from the NCBI SRA Bioproject PRJNA227137 conducted by Eswaran et al. [79] were trimmed and aligned against the EBV genome in fasta format by utilizing the HISAT2 aligner, as described in Methods. The normalized total EBV-aligned expressed sequences in reads per million (RPM) quantitated from the BAM files for each sample are shown. (A) EBV-negative HK1 and EBV-positive C666 cell lines (SRR 7757113 and SRR 7757114, respectively, taken from pre-existing NCBI SRA RNA-seq data) used as negative and positive controls for the presence of EBV-expressed sequences, respectively. (B) Control normal breast tissues, all breast tumors, and the various breast cancer subtypes within all breast tumors utilized are shown. The number of the samples analyzed for each category are shown above the x-axis. TNBC, triple negative breast cancer subtype; Non-TNBC, luminal A and B; HER2; human epidermal growth factor receptor 2 positive breast cancer subtype.
Figure 3
Figure 3
Upregulated expression of EBV BOLF1 and BPLF1 gene transcript sequences in breast cancer tumors as compared to in control normal samples. BOLF1 and BPLF1 EBV gene transcript sequences quantitated in Figure 2A for each sample are shown in graphs (top panels). The number of the samples analyzed for the graphical representation of each subtype is shown above the x-axis. The % of the positive samples expressing each EBV gene transcript sequence for each sample subtype is shown at the top of each the graph. The analysis of the corresponding read coverage contained in the bam files is shown through IGV representation (bottom panels). (A). BOLF1 gene sequences expression in graphical (top panel) and IGV visualization of the corresponding bam files (bottom panel). (B). BPLF1 gene sequences expression in graphical (top panel) and IGV visualization of the corresponding bam file (bottom panel). Statistical testing was performed for each subtype against controls; subtypes marked with * are upregulated with p < 0.05 and ** with p < 0.01.
Figure 4
Figure 4
Expression of EBV BZLF2 and BFRF2 gene sequences in breast tumors and subtypes and not in normal breast tissue controls. Expression analysis of the EBV gene sequences in normal controls and in various breast cancer tumor subtypes was determined as explained under Figure 2B. (A) BZLF2 gene sequence expression in graphical format (top panel) and IGV visualization of the corresponding BAM file read coverage (bottom panel). (B) BFRF2 gene sequence expression in graphical format (top panel) and IGV visualization of the corresponding BAM file read coverage (bottom panel). The number of samples analyzed for the graphical representation for each subtype is shown above the x-axis. The % of the positive samples expressing each EBV gene sequence for each subtype is shown at the top of each graph.
Figure 5
Figure 5
Preferential expression of EBV BGLF1 and LF1 gene sequences in HER2-positive tumors and not in normal breast tissue controls. Expression analysis of the EBV gene sequences in normal controls and in various breast cancer tumor subtypes was determined as explained under Figure 2C. (A) BGLF1 gene sequence expression in graphical format (top panel) and IGV visualization of the corresponding BAM file read coverage (bottom panel). (B) LF1 gene sequence expression in graphical format (top panel) and IGV visualization of the corresponding BAM file read coverage (bottom panel). The number of samples analyzed for the graphical representation for each subtype is shown above the x-axis. The % of the positive samples expressing each EBV gene sequence for each subtype is shown at the top of each graph. Statistical testing was performed for each subtype against controls; subtypes marked with * are upregulated with p < 0.05.
Figure 6
Figure 6
Preferential expression of EBV gene BSRF1 transcript sequences in TNBC and HER2 breast tumors. EBV BSRF1 gene transcript sequences quantitated (as in Figure 2C) for each sample are graphically represented (top panel). The coverage contained in the corresponding BAM file is shown through IGV visualization (bottom panel). The number of the samples analyzed for the graphical representation for each subtype is shown above the x-axis. The % of the positive samples expressing each EBV gene sequence for each subtype is shown at the top of each graph.
Figure 7
Figure 7
Specific expression of EBV BSLF1 gene transcript sequences in TNBC tumors. EBV BSRF1 gene sequences quantitated (as in Figure 2C) for each sample are graphically represented (top panel). The coverage contained in the corresponding BAM file is shown through IGV visualization (bottom panel). The number of the samples analyzed for the graphical representation for each subtype is shown above the x-axis. The % of the positive samples expressing each EBV gene sequence for each subtype is shown at the top of each graph.
Figure 8
Figure 8
Identification of a novel EBV miRNA potentially generated from the LF1 (151,161–151,179) hotspot sequences. Breast tumor miRNA-seq sequences were aligned against the EBV genome, as described in Methods. The aligned BAM files were visualized using IGV, and the EBV IGV miRNAs localizing within the LF1 hotspot regions are shown (top panel). For each sample utilized, bam file coverage is shown on the top line, and the EBV IGV miRNA reads are shown in the lower section. The sequence of one IGV miRNA marked by * was analyzed further. (a). LF1 complete hotspot sequence. (b). EBV IGV miRNA sequence. (c). Reference EBV IGV miRNA sequence. (d). EBV IGV miRNA in reverse complement (RC) due to alignment on reverse strand (e). Complete EBV IGV miRNA sequence retrieved from EBV-aligned miRNA BAM file. (f). RNA-seq sequence containing the complete 22 nucleotide miRNA sequence shown in (e). (g). miRNA predicted by processing sequence shown in (f) through MatureBayes software. (h,i) Forward strand of the reverse complement shown in (f), with and without SNPs, respectively. Note: Nucleotide sequences different between reference and actual miRNA sequence are bolded and underlined. RC and forward arrow denotes reverse complement and forward strand, respectively. Red sequences are found in hotspot and miRNA. Blue indicates the sequence appears in hotspot but not in miRNA. Green and black sequences indicate putative human genes, with green sequences found in miRNA but not in hotspot.
Figure 9
Figure 9
Identification of a novel EBV miRNA potentially generated from the BSLF1 (73,815–73,829) hotspot sequences. Breast tumor miRNA-seq sequences were aligned against the EBV genome, as described in Methods. The aligned BAM files were visualized using IGV, and the EBV IGV miRNAs localizing within the BSLF1 hotspot regions are shown (top panel). For each sample utilized, bam file coverage is shown on the top line, and the EBV IGV miRNA reads are shown in the lower section. The sequence of one IGV miRNA marked by * was analyzed further. (a). BSLF1 complete hotspot sequence. (b). EBV IGV miRNA sequence. (c). Reference EBV IGV miRNA sequence. (d). EBV IGV miRNA in reverse complement (RC) due to alignment on reverse strand (e). Complete EBV IGV miRNA sequence retrieved from EBV-aligned miRNA BAM file. (f). RNA-seq sequence containing the complete 22 nucleotide miRNA sequence shown in (e). (g). miRNA predicted by processing sequence shown in (f) through MatureBayes software. (h,i) Forward strand of the reverse complement shown in (f), with and without SNPs, respectively. Note: Nucleotide sequences different between reference and actual miRNA sequence are bolded and underlined. RC and forward arrow denotes reverse complement and forward strand, respectively. Red sequences are in hotspot and miRNA. Blue indicates sequence appears in hotspot but not in miRNA. Green and black sequences are putative human sequences with green sequences found in miRNA but not in hotspot.
Figure 10
Figure 10
Identification of a novel EBV miRNA potentially generated from the BSLF1 (73,841–73,857) hotspot sequences. Breast tumor miRNA-seq sequences were aligned against the EBV genome, as described in Methods. The aligned BAM files were visualized using IGV, and the EBV IGV miRNAs localizing within the BSLF1 hotspot regions are shown (top panel). For each sample utilized, bam file coverage is shown on the top line, and the EBV IGV miRNA reads are shown in the lower section. The sequence of one IGV miRNA marked by * was analyzed further. (a). BSLF1 complete hotspot sequence. (b). EBV IGV miRNA sequence. (c). Reference EBV IGV miRNA sequence. (d). EBV IGV miRNA in reverse complement (RC) due to alignment on reverse strand (e). Complete EBV IGV miRNA sequence retrieved from EBV-aligned miRNA BAM file. (f). RNA-seq sequence containing the complete 20 nucleotide miRNA sequence shown in (e). (g). miRNA predicted by processing sequence shown in (f) through MatureBayes software. (h,i) Forward strand of the reverse complement shown in (f), with and without SNPs, respectively. Note: Nucleotide sequences different between reference and actual miRNA sequence are bolded and underlined. RC and forward arrow denotes reverse complement and forward strand, respectively. Red sequences are in hotspot and miRNA. Blue indicates sequence appears in hotspot but not in miRNA. Green and black sequences are putative human sequences, with green sequences found in miRNA but not in hotspot.

Similar articles

References

    1. Zhang Y., Ji Y., Liu S., Li J., Wu J., Jin Q., Liu X., Duan H., Feng Z., Liu Y., et al. Global burden of female breast cancer: New estimates in 2022, temporal trend and future projections up to 2050 based on the latest release from GLOBOCAN. J. Natl. Cancer Cent. 2025;5:287–296. doi: 10.1016/j.jncc.2025.02.002. - DOI - PMC - PubMed
    1. Siegel R.L., Kratzer T.B., Giaquinto A.N., Sung H., Jemal A. Cancer statistics, 2025. CA Cancer J. Clin. 2025;75:10–45. doi: 10.3322/caac.21871. - DOI - PMC - PubMed
    1. Swain S.M., Shastry M., Hamilton E. Targeting HER2-positive breast cancer: Advances and future directions. Nat. Rev. Drug Discov. 2023;22:101–126. doi: 10.1038/s41573-022-00579-0. - DOI - PMC - PubMed
    1. Prat A., Perou C.M. Deconstructing the molecular portraits of breast cancer. Mol. Oncol. 2011;5:5–23. doi: 10.1016/j.molonc.2010.11.003. - DOI - PMC - PubMed
    1. Carvalho E., Canberk S., Schmitt F., Vale N. Molecular Subtypes and Mechanisms of Breast Cancer: Precision Medicine Approaches for Targeted Therapies. Cancers. 2025;17:1102. doi: 10.3390/cancers17071102. - DOI - PMC - PubMed

MeSH terms