. 2025 Dec;14(1):2539442.
doi: 10.1080/2162402X.2025.2539442. Epub 2025 Jul 28.

Inhibition of FAK promotes pancreatic cancer immunotherapy by mediating CXCL10 secretion to enhance CD8+ T cell infiltration

Affiliations

Inhibition of FAK promotes pancreatic cancer immunotherapy by mediating CXCL10 secretion to enhance CD8+ T cell infiltration

Yu-Chen Shi et al. Oncoimmunology. 2025 Dec.

Abstract

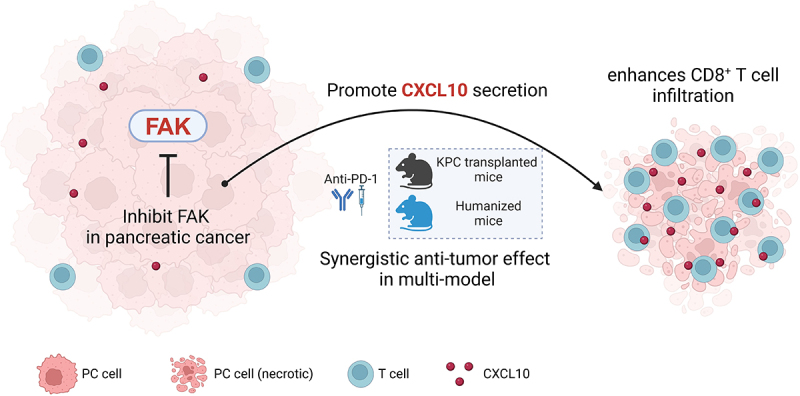
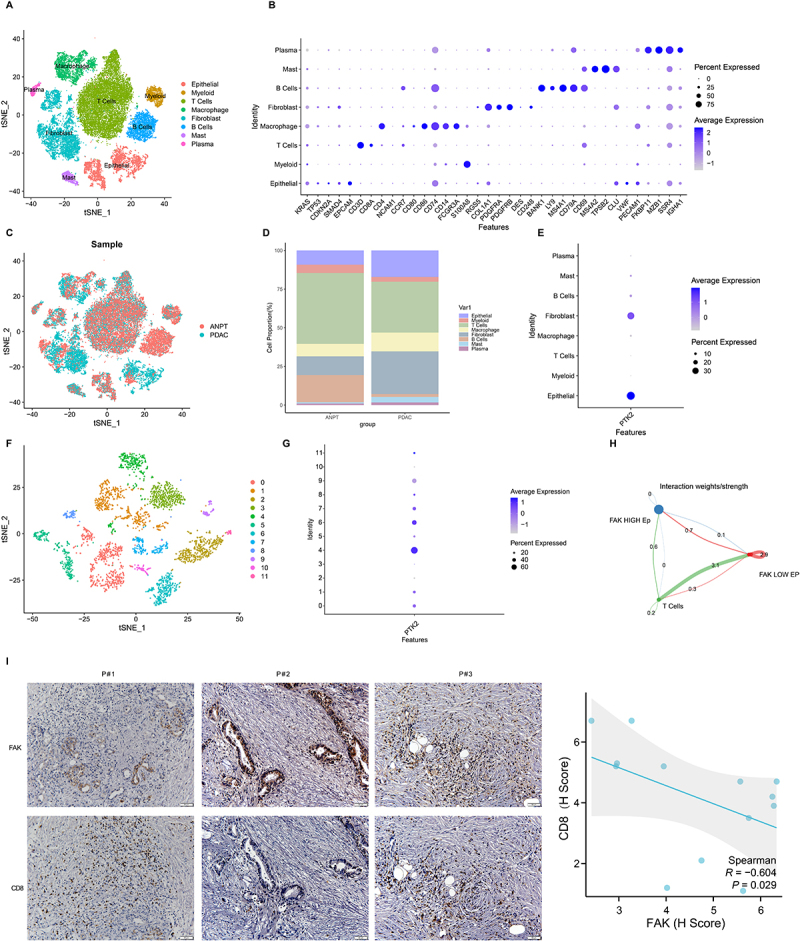
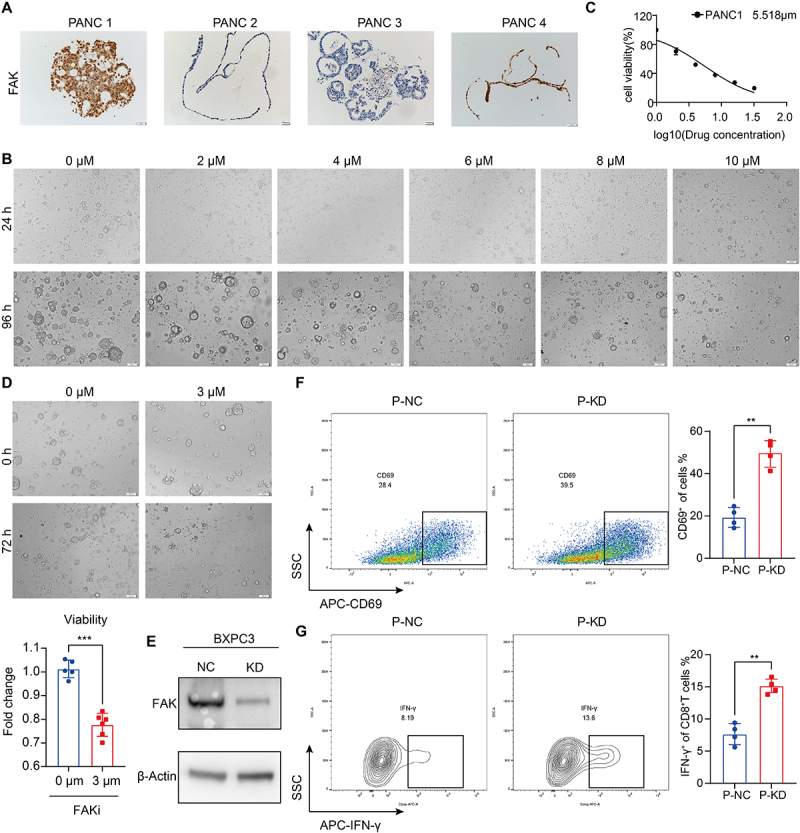
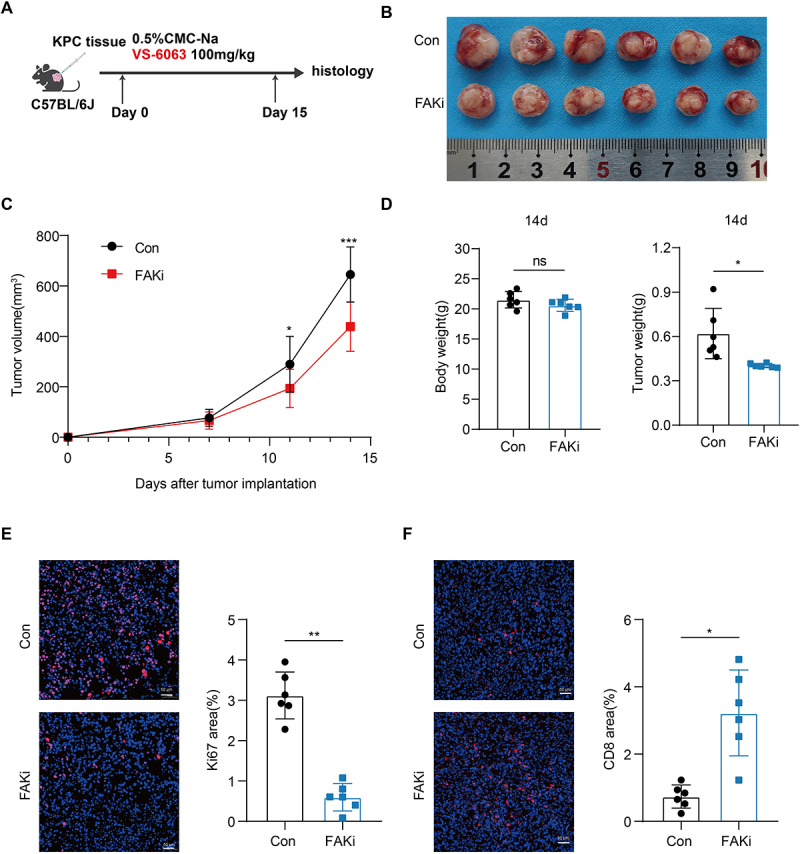
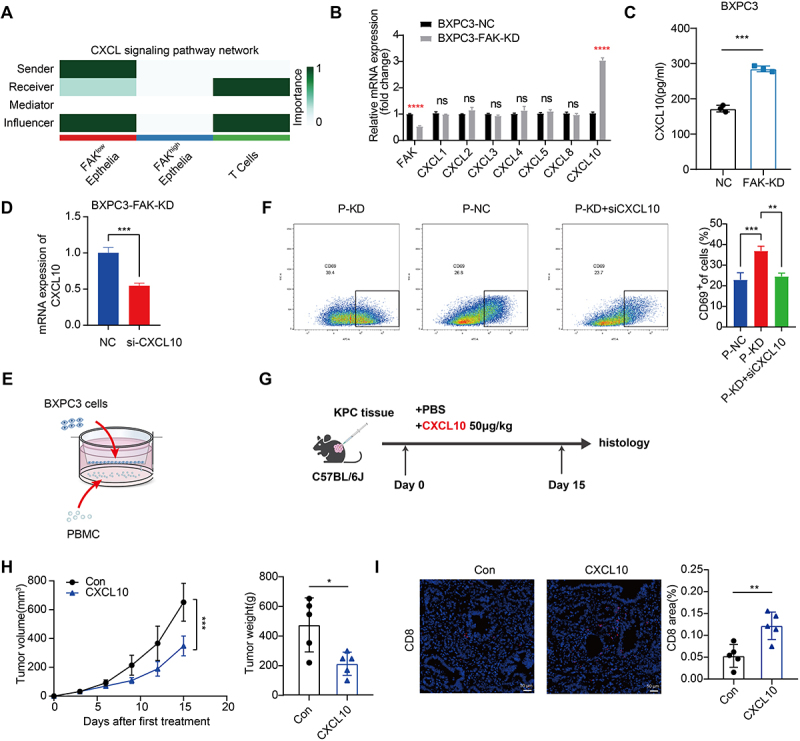
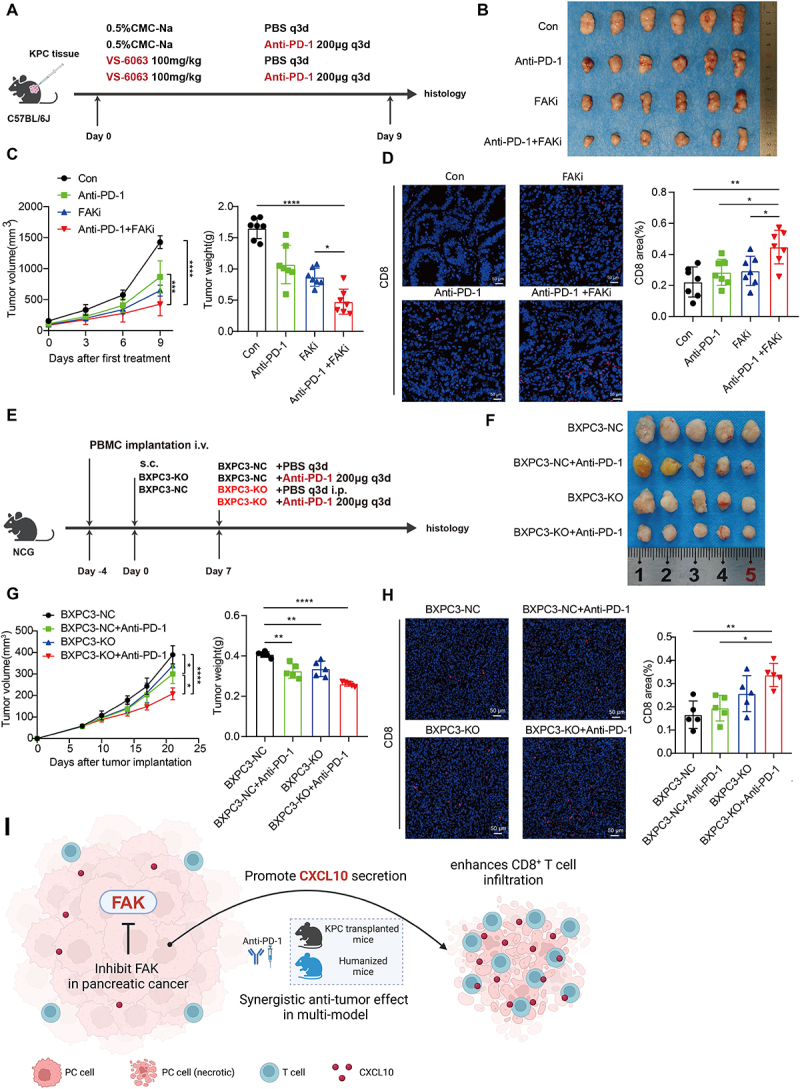
Immunotherapy has demonstrated potential in treating various malignant tumors, but its efficacy in pancreatic cancer (PC) remains limited, possibly due to the dense stromal components and immunosuppressive microenvironment of PC. Focal adhesion kinase (FAK), a non-receptor tyrosine kinase, plays a crucial role in the tumor microenvironment and intracellular signaling pathways. However, the specific role of FAK in the development and progression of PC, as well as its regulatory mechanisms on the tumor immune microenvironment (TIM), are still not fully understood. In this study, we analyzed single-cell sequencing datasets and clinical specimens to evaluate the role of FAK in the immune response of PC. We verified the impact of FAK alterations on CD8+ T cell infiltration using a co-culture system of patient-derived organoids (PDO) and immune cells. Additionally, mouse PC models and dual humanized models are established to investigate the in vivo function of FAK and the potential of its inhibitors for immunotherapy. Our results demonstrate that FAK is associated with the immunosuppressive microenvironment in PC. Inhibiting FAK enhances CD8+ T cell infiltration by promoting CXCL10 secretion in PC. Moreover, FAK inhibitors exhibit a synergistic anti-tumor effect when combined with immune checkpoint inhibitors. This study explores the potential of FAK as a therapeutic target, particularly its role in modulating TIM, thereby providing new research directions for the treatment of PC.

Keywords: CXCL10; Focal Adhesion Kinase (FAK); Pancreatic Cancer (PC); Tumor Immune Microenvironment (TIM); immunotherapy.


Conflict of interest statement

No potential conflict of interest was reported by the author(s).

Figures

None
Graphical abstract
Figure 1.
Figure 1.
FAK is associated with the immunosuppressive microenvironment in pancreatic cancer. (A) The cell type annotation of 33,794 cells using t-distributed stochastic neighbor embedding (t-SNE) and uniform manifold approximation, categorizing them into a total of 8 types, including epithelial, myeloid, T cells, macrophage, fibroblast, B cell and mast cells, and plasma. (B) T-SNE plots showing average expression of gene markers for all cell clusters. (C) T-SNE plots showing the cell distribution originated from adjacent noncancerous pancreatic tissue (ANPT) and pancreatic ductal adenocarcinoma (PDAC). (D) Bar plot showing the overall cell composition of normal and tumor samples, colored by cell types. (E) The expression of FAK in various cells. (F) T-SNE plots showing the various subpopulations of epithelial cells. (G) The expression levels of FAK various subpopulations of epithelial cells. (H) Cell-cell communication from FAK high cells and FAK low cells to T cells. (I) Representative images and quantitation of the expression of FAK and CD8 in PDAC. Scale bars, 50 µm.
Figure 2.
Figure 2.
Inhibition of FAK can enhance the cytotoxic effect of PBMCs on pancreatic cancer PDOs. (A) Representative images and quantitation of the expression of FAK in pancreatic cancer PDOs. Scale bars, 50 µm. (B) Representative images of organoids treated with different concentrations of FAK inhibitors. Scale bars, 100 µm. (C) Dose-response curve of FAK inhibitors VS-6063 on human pancreatic cancer PANC1 cell viability. (D) Representative images of organoids treated with different concentrations of FAK inhibitors. Scale bars, 100 µm. (E) Western blotting analysis of FAK protein levels in control (NC) and FAK-knockdown (KD) BXPC3 cells. (F) FACS analysis PBMCs of CD69+ of anti-CD3/CD28-activated after co-culturing BXPC3-NC or BXPC3-FAK-KD (n = 3). (G) FACS analysis CD8 of IFN-γ of anti-CD3/CD28-activated after co-culturing BXPC3-NC or BXPC3-FAK-KD (n = 3). P-KD: BXPC3-FAK-KD; P-NC: BXPC3-NC. Error bars indicate standard error (SE). p-values were calculated by the Student’s t-test and Kruskal-Wallis test. **p < 0.01; ***p < 0.001.
Figure 3.
Figure 3.
Inhibition of FAK can decelerate the growth of pancreatic cancer xenografts. (A) Schematic diagram of the construction of a subcutaneous tumor graft model (KPC tumor) in C57BL/6J mice and the drug administration strategy. VS-6063 is soluble in carboxymethyl cellulose sodium (CMC-Na). (B) Actual photographs of tumor tissue from different treatment groups (n = 6/group). (C) Tumor growth curves of mice in different treatment groups (n = 6/group). (D) Average and standard error of the mean of the body weight and tumor weight in different treatment groups (n = 6/group). (E) Representative images and quantification results of Ki-67 in mice from different treatment groups (n = 6/group), scale bars, 50 µm. (F) Representative images and quantification results of CD8+ T cell in different treatment groups of mice (n = 6/group), scale bars, 50 µm. FAKi: FAK inhibitor. p-values were calculated by two-way ANOVA with Tukey’s multiple comparison test. *p < 0.5. Error bars indicate standard error (SE). p-values were calculated by the Student’s t-test and Kruskal-Wallis test. *p < 0.05; **p < 0.01; ***p < 0.001; ns, non-significant.
Figure 4.
Figure 4.
FAK can mediate the immune response in pancreatic cancer through the secretion of CXCL10. (A) Communication status in different cells of CXCL signaling pathway network. (B) RT-PCR detection of the expression of CXCL-related genes after knockdown of FAK in BXPC3 cells. The data are presented as the means ± SD. p-values were calculated by two-way ANOVA with Tukey’s multiple comparison test. ****p < 0.0001; ns, non-significant. (C) ELISA validation of CXCL10 expression after knockdown of FAK in BXPC3 cells (FAK-KD) (n = 3). p-values were calculated by two-way ANOVA with Tukey’s multiple comparison test. ***p < 0.001. (D) RT-PCR detection of the expression of CXCL10 after knockdown of CXCL10 (si-CXCL10) in BXPC3-FAK-KD cells. The data are presented as the means ± SD. p-values were calculated by two-way ANOVA with Tukey’s multiple comparison test. ***p < 0.001. (E) BXPC3 cells co-culture schematic diagram with PBMC. (F) FACS analysis PBMCs of CD69+ of anti-CD3/CD28-activated after co-culturing BXPC3 cells (n = 3). p-values were calculated by two-way ANOVA with Tukey’s multiple comparison test. **p < 0.01; ***p < 0.001. (G) Schematic diagram of the construction of a subcutaneous tumor graft model (KPC tumor) in C57BL/6J mice and the drug administration strategy. (H) Tumor growth curves of mice and tumor weight in different treatment groups (n = 5/group). p-values were calculated by two-way ANOVA with Tukey’s multiple comparison test. *p < 0.5. (I) Representative images and quantification results of CD8+ T cell in different treatment groups of mice (n = 5/group), scale bars, 50 µm. p-values were calculated by two-way ANOVA with Tukey’s multiple comparison test. **p < 0.01.
Figure 5.
Figure 5.
Fak inhibitors exhibit a combined anti-tumor effect with immune checkpoint inhibitors. (A) Schematic diagram of the construction of a subcutaneous tumor graft model (KPC tumor) in C57BL/6J mice and the drug administration strategy.VS-6063 is soluble in carboxymethyl cellulose sodium (CMC-Na). (B) Actual photographs of tumor tissue from different treatment groups (n = 6/group). (C) Tumor growth curves of mice and tumor weight in different treatment groups (n = 6/group). p-values were calculated by two-way ANOVA with Tukey’s multiple comparison test. *p < 05;****p < 0.0001. (D) Representative images and quantification results of CD8+ T cell in different treatment groups of mice (n = 6/group), Scalebars, 50 µm. p-values were calculated by two-way ANOVA with Tukey's multiple comparison test. *p < 05; **p < 0.01. (E) Strategy for the construction of double humanized mouse model and administration.(F) Actual photographs of tumor tissue from different treatment groups (n = 6/group). (G) Tumor growth curves of mice and tumor weight in different treatment groups (n = 5/group). p-values were calculated by two-way ANOVA with Tukey’s multiple comparison test. **p < 0.01;****p < 0.0001. (H) Representative images and quantification results of CD8+ T cell in different treatment groups of mice (n = 5/group), Scalebars, 50 µm. p-values were calculated by two-way ANOVA with Tukey's multiple comparison test. *p < 0.5 **p < 0.01. (I) Mechanism diagram of inhibiting FAK in tumors to exert anti-tumor effects.

Similar articles

References

    1. Wang Z, Qin J, Zhao J, Li J, Li D, Popp M, Popp F, Alakus H, Kong B, Dong Q, et al. Inflammatory IFIT3 renders chemotherapy resistance by regulating post-translational modification of VDAC2 in pancreatic cancer. Theranostics. 2020;10(16):7178–17. doi: 10.7150/thno.43093. - DOI - PMC - PubMed
    1. Zhou Z, Zhang Y, Li J, Weng S, Li J, Chen S, Lv J, Xu N, Zhang Y, Yang S, et al. Wen J.Crosstalk between regulated cell death and immunity in redox dyshomeostasis for pancreatic cancer. Cellular Signalling. 2023;109:110774. doi: 10.1016/j.cellsig.2023.110774. - DOI - PubMed
    1. Hu M, Deng F, Song X, Zhao H, Yan F.. Yan F.undefined.The crosstalk between immune cells and tumor pyroptosis: advancing cancer immunotherapy strategies. J Exp & Clin Cancer Res. 2024;43(1):190. doi: 10.1186/s13046-024-03115-7. - DOI - PMC - PubMed
    1. Olaoba OT, Yang M, Adelusi TI, Maidens T, Kimchi ET, Staveley-O’Carroll KF, Li G.. Li G.Targeted therapy for highly desmoplastic and immunosuppressive tumor microenvironment of pancreatic ductal adenocarcinoma. Cancers (Basel). 2024;16(8):1470. doi: 10.3390/cancers16081470. - DOI - PMC - PubMed
    1. Patel JM, Cui Z, Wen ZF, Dinh CT, Hu H-M. Hu HM.Peritumoral administration of DRibbles-pulsed antigen-presenting cells enhances the antitumor efficacy of anti-GITR and anti-PD-1 antibodies via an antigen presenting independent mechanism. J For Immunother Of Cancer. 2019;7(1):311. doi: 10.1186/s40425-019-0786-7. - DOI - PMC - PubMed

MeSH terms